SUSHI - On its way to new lows
The bear flag has been broken to the downside, and there is a high probability that we will set new lows soon.
Initial target is 2021's low at 0.472.
Pullbacks to the upside are selling opportunities.
SUSHIUSDT.P trade ideas

Proboy vniz homework_ manvelov_testProboy down
Addition to the homework Number 2 to test if the short position was indicated correctly

$SUSHI (Swap) - BreakOut, Target $0.90CRYPTOCAP:SUSHI - Making Moves!
Nice ascending Triangle break-out. Target: +26%.
In line with 200day moving average at approx. $0.90
First Target: Supply zone at $0.84
Do you think sushi will flip trend?

🔥 SUSHI'S Best Trade You Will Make This YearSUSHI has found very strong support at the 2020 lows a couple of weeks ago. Since then, SUSHI has been seeing strong gains.
This trade is based on the idea that SUSHI's bear market low is in and that we will generally only go up for the foreseeable future.
I'm expecting a minor correction over the coming weeks, hence the entry at 0.7, stop below the May lows, target at 23$.
This is a long-term trade and can take another 2 years to hit the profit target. Nevertheless, a risk-reward of >100 is incredible and can lead to some serious gains.

Finally breaking out since more than 21 months..!🔸Breaking out the falling wedge in weekly chart meaning sushi aimed great targets.
specifically after this long time accumulation (21 months).
🔸Sushi need to clear 0.618 fib level , successfull retest after that we can see sushi hit 3$
Dont forget to support us with ur like, comment and follow to get all the news

$SUSHI Performing Ascending Triangle in 1D TF Also BREAKOUT DONEWhat the Ascending Triangle Shows Us
The ascending trend line chart pattern is a bullish formation. It signals that the market is consolidating after an uptrend, with the buyers still in control. The occurrence of the higher lows is pointing toward a likely breakout as the wedge narrows down."
**There are three key features of an ascending triangle:
Strong trend - In order for the ascending triangle to exist in the first place, the price action must stem from a clear uptrend;
Temporary pause - This element refers to the consolidation phase, which will help the buyers consolidate their strength;
Breakout - The break of the upper flat line marks the breakout, which activates the pattern. It also helps us determine the entry, take profit, and stop loss at a later stage.


SHUSI USDT HELLO GUYS THIS MY IDEA 💡ABOUT SHUSIUSDT is nice to see strong volume area....
Where is lot of contract accumulated..
I thing that the buyers from this area will be defend this LONG position..
and when the price breakout this resistance , strong buyers will be push up the market again..
IF you like my work please like and follow thanks

SUSHIUSDT → Resistance breakout. Expect momentum BINANCE:SUSHIUSDT is forming a bearish wedge and after retesting the global bottom, the price starts to strengthen, breaking the resistance of the pattern
A symmetrical triangle has been forming for the last few weeks, within which the potential is accumulating. Within the forming figure, the price is breaking the resistance of the global wedge, but is still trapped under the triangle resistance. Most likely, when breaking the symmetrical triangle resistance, the coin can show an excellent bullish momentum. The market is waiting for activity from bitcoin, but it has reduced its volatility to a minimum, showing little reaction over the past few weeks only yesterday when the market bought back the decline and altcoins reacted accordingly.
The SUSHI bulls may prove themselves in the near future
Support levels: 0.637, previously broken wedge resistance
Resistance levels: Triangle resistance, 0.827
I expect consolidation above the wedge and retest of the triangle resistance with the subsequent breakout and growth towards these levels.
Regards R. Linda!

SUSHIUSDT- tries to break through the resistance levelHello everyone! Today I found a pretty positive chart at SUSHIUSDT. The coin has been trying for six months to form a good foundation to go beyond the resistance level of 0.74. All this time, the price does not update its lows and presses this level. Therefore, in the near future I expect a coin at the 0.9 mark, at the next logical resistance level.

SUSHIUSDT accumulation phaseSUSHIUSDT is currently in an accumulation phase, which means that the price has been consolidating and trading within a relatively narrow range. This phase is characterized by lower volatility and indecision among traders as they wait for a clear direction in the market.
The daily resistance level at 0.719 is a significant price level that has been preventing the price from moving higher. As long as the price remains below this resistance level, it signifies that there is selling pressure at that price, which keeps the price contained within the accumulation range.
However, if the price manages to break above the 0.719 resistance level and sustains its movement beyond it, this could be considered a bullish breakout according to Plancton's Rules. A bullish breakout occurs when the price moves above a key resistance level, indicating a potential shift in market sentiment from bearish to bullish.
In accordance with Plancton's Rules, a new long position is suggested if the price successfully flips the resistance level. A long position involves buying the asset with the expectation that its price will rise. By initiating a long position after the breakout, traders aim to capitalize on the potential upward momentum and price appreciation that may follow.
–––––
Follow the Shrimp 🦐
Keep in mind.
🟣 Purple structure -> Monthly structure.
🔴 Red structure -> Weekly structure.
🔵 Blue structure -> Daily structure.
🟡 Yellow structure -> 4h structure.
⚫️ Black structure -> <= 1h structure.
Follow the Shrimp 🦐

SUSHIUSDT 1DAscending Triangle formation on #SUSHI daily timeframe. Breaking above the resistance zone will send us to $0.85 and $0.90 targets.

sushiIn the first stage, we have a resistance zone in the red lines, if it is crossed, the higher red lines will be activated.

Pull back to 0.95Monthly Chart
SUSHI BINANCE:SUSHIUSDT has downed 98% from ATH and created a reversal pattern DB
Daily Chart
Now, SUSHI is trading at 0.71x
BINANCE:SUSHIUSDT will move up to 0.95 for correction phase
Chart 4H TF
BINANCE:SUSHIUSDT is range from 0.7 - 0.75
Wait for breakout that range

$Sushi's Rising Channel (another angle)CRYPTOCAP:SUSHI in a rising Channel...
Two things can happen:
1. Price Action could have an upward breakout of the channel to hit up resistances: 0.85, 0.90
2. #sushi Price action could break down from channel to retest down supports: 0.65, 0.59.
Remains to be seen
@SushiSwap

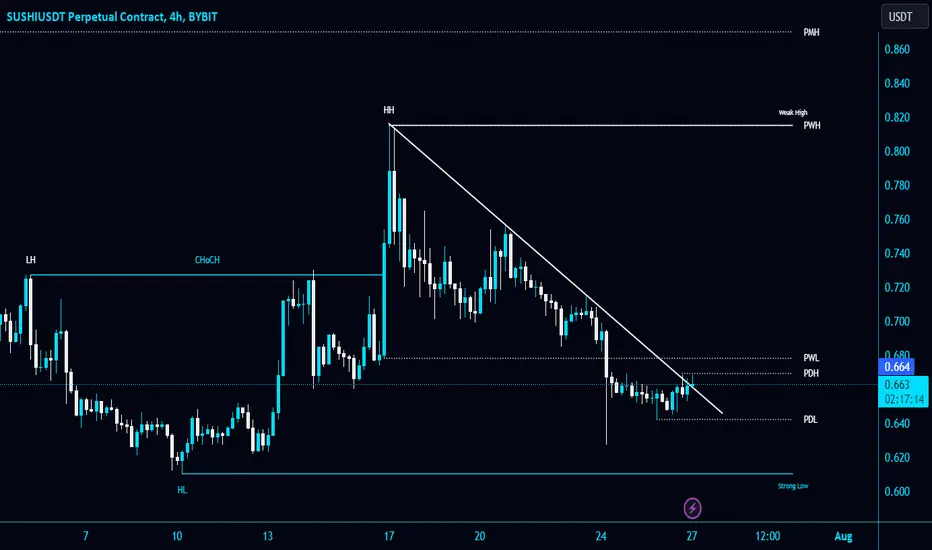
#SUSHI/USDT is trying to break the Diagonal Trendline in 4-Hour CRYPTOCAP:SUSHI needs to clear PWL $0.678 to gain bullish momentum. Wait for Momentum candle. BO is looking weak right now.

SUSHI/USDT Bounced off EMAsHey traders 👋
Let's start this day with SUSHI coin where we see a good chance for potential drop to happen but before that......We have had already that small bounce from EMAs of 200&100 where price bounced nicely and might go for upper resistance zone. That zone is going to be our potential sell zone so let's wait out and see what we will get here!
If you like ideas provided by our team you can show us your support by liking and commenting.
Yours Sincerely,
Swallow Team
Disclamer:
We are not financial advisors. The content that we share on this website are for educational purposes and are our own personal opinions.

$SUSHI, bullishness coming? Confirmed 2D Buy from the UCTS for CRYPTOCAP:SUSHI
If BTC behaves, then this will follow
⏳
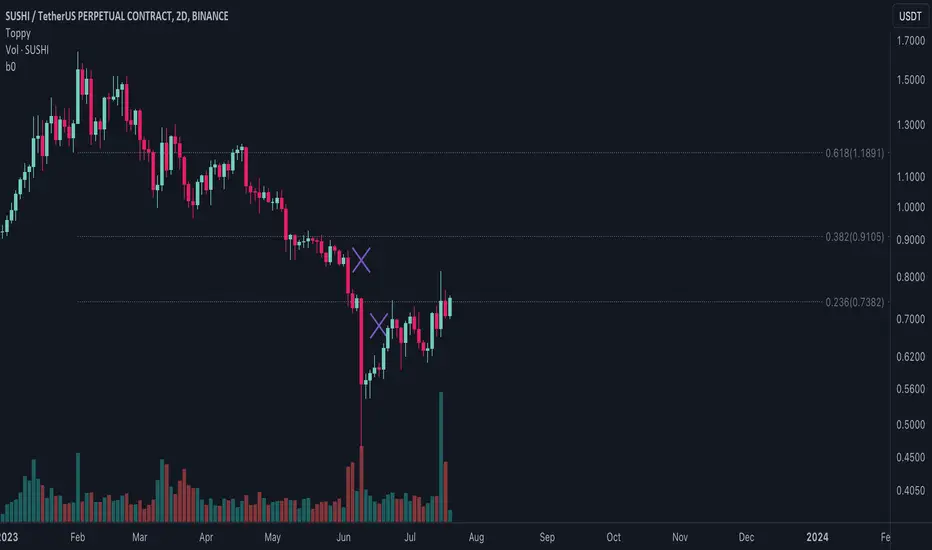
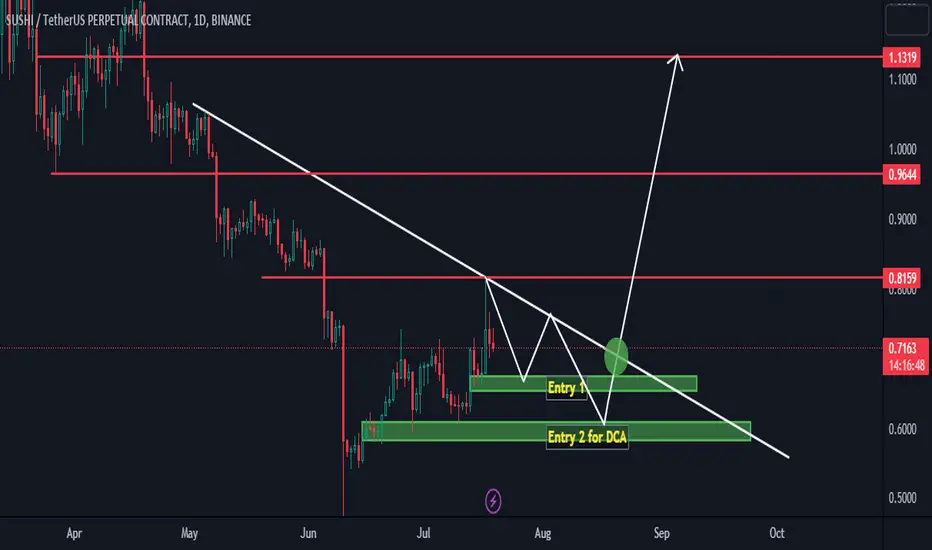
sushi midterm viewSushi is looking neutral here but lower best entries are possible. Entry 1 and Entry 2 are given for it. In next few weeks it can pump hard
$SUSHIDuring the bearish market phase, SUSHI, which has been trading within a descending channel for months, experienced a slightly negative divergence in the market due to fundamental issues on its platform compared to other coins, resulting in a greater decline.
Yesterday, SUSHI witnessed a 17% price increase following a partnership agreement in the DeFi space.
From a technical perspective, we can observe that it has re-entered the descending channel. There is a possibility of retesting the previous level it broke, around $0.91 which is the 20MA on weekly chart. Subsequently, price movements will be entirely dependent on economic developments such as the Federal Reserve Meetings(FOMC) and Jerome Powell's statements regarding interest rates, which will determine market direction this summer.
It is important to note that this trade prediction is purely short-term and does not constitute any investment advice. In the medium term, price movements will be heavily influenced by the statements made during the FED meetings and upcoming financial datas such as inflation rate and non-farm payrolls.
-yesterday daily RSI almost touched the resistance (a price decline expected before the target and we seeing right now)
-Resistance areas= $0.91, $0.80, $1.12
-Support areas = $0.70, $0.60
-Suggested entry price = around $0.70
-target price = $0.87

SushiSwap $1 move?👀 SUSHIUSDT Today Analysis
💎 Sushi USDT is primed for an impressive move, currently trading in a demand area and setting the stage for a bullish trend.
💎 It's maintaining strong momentum above the EMA 50, having successfully closed one daily candle above it, which further strengthens the bullish outlook.
💎 Above, there's a supply zone that the price is expected to reach, grab liquidity, and mitigate.
💎In the dynamic world of crypto, staying informed and adaptable is key. Stay tuned for more updates and enjoy your trading journey

SUSHIUSDTCompare the OBV chart to the price chart
massive divergence has been forming on a HTF
Notice the volume spike breaking the OBV trend out of the range to local highs
price action could be a spring section of a wyckoff accumullation
if the price reclaims the range low around 0.85usdt the price may not return to this spring range for a long time and could continue ranging the above price zone for the rest of the year
basically could be a very safe entry that never goes back under your buying price
the chances of this are higher given the OBV trend and the volumespike to break the downtrend that lead to this price zone
if we reclaim the previous range and then revisit the high of that range thats around 163% in profit from here.
stops at the lows
