Is Silicon's Silent Giant Rewriting the Rules of AI?Broadcom has emerged as a critical, yet understated, architect of the artificial intelligence revolution. While consumer-facing AI applications dominate headlines, Broadcom operates in the infrastructure layer, designing custom chips, controlling networking technology, and managing enterprise cloud
Key facts today
Next report date
—
Report period
—
EPS estimate
—
Revenue estimate
—
3.55 EUR
5.42 B EUR
47.39 B EUR
4.63 B
About Broadcom Inc.
Sector
Industry
CEO
Hock E. Tan
Website
Headquarters
Palo Alto
Founded
1961
ISIN
US11135F1012
FIGI
BBG00KJLNQ23
Broadcom Inc. is a global technology company, which designs, develops, and supplies semiconductors and infrastructure software solutions. It operates through the Semiconductor Solutions and Infrastructure Software segments. The Semiconductor Solutions segment refers to product lines and intellectual property licensing. The Infrastructure Software segment relates to mainframe, distributed and cyber security solutions, and the FC SAN business. The company was founded in 1961 and is headquartered in Palo Alto, CA.
Related stocks
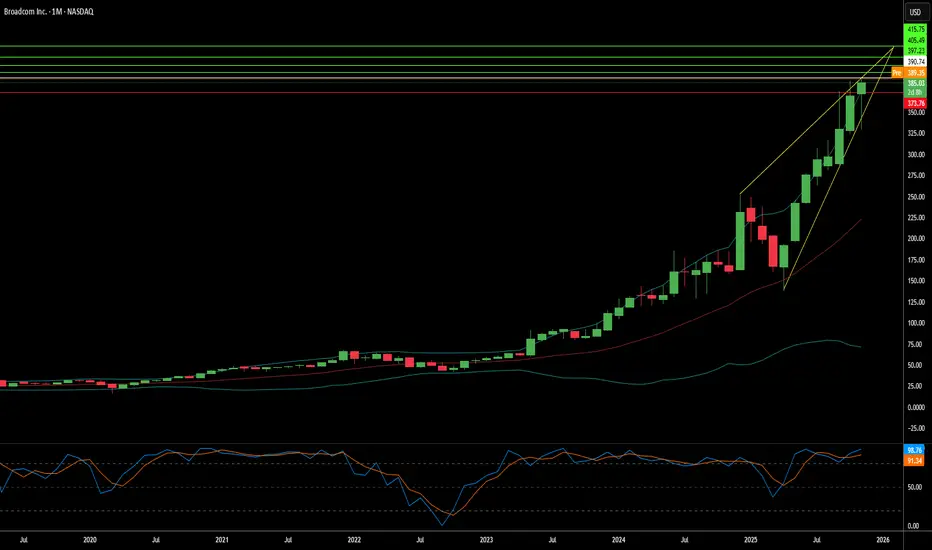
Broadcom: The Sleeping Giant Awakens— The New Leader in AIBroadcom is no longer the quiet infrastructure company it used to be.
In 2025, AVGO has transformed into a direct AI compute powerhouse, and the chart is reflecting this shift with powerful clarity.
Chart Reading — AVGO
AVGO has reclaimed its April 7th key angle—the foundational 1-degree / 1-do

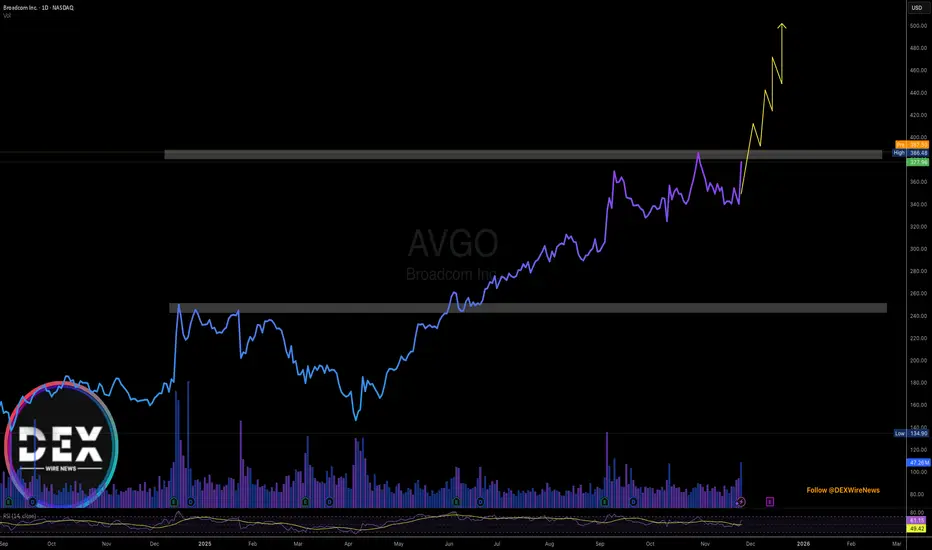
Breaking: Broadcom Inc. (AVGO) Surged 11% Yesterday Eyeing $500 Broadcom Inc. (NASDAQ; NASDAQ:AVGO ) shares saw a noteworthy uptick of 11% in extended market trading further extending the gains to todays premarket session up by 2.34%.
Should the stock break the ceiling of the $388 resistant zone, coupled with the RSI at 61, a bullish move to the $500 resistant
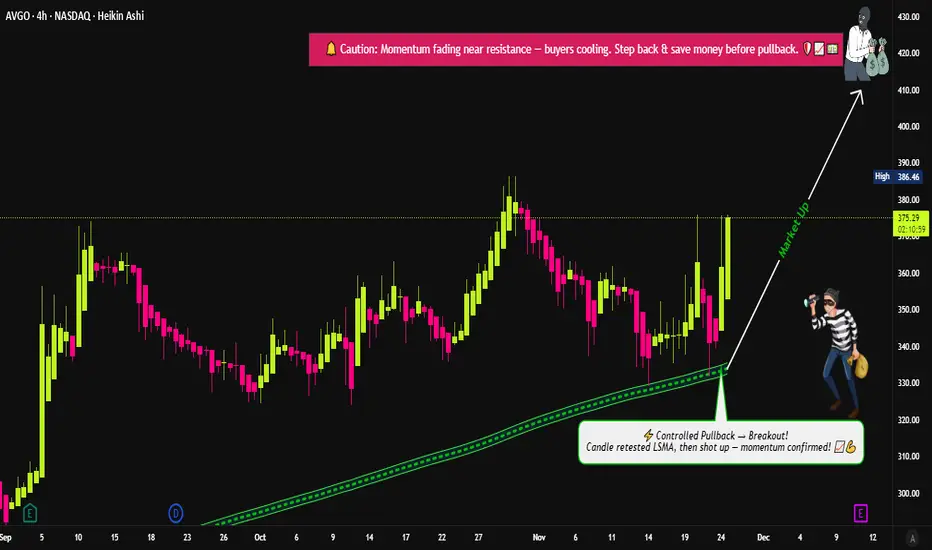
Is Broadcom Setting Up a Clean LSMA Pullback Entry?📈 Trade Setup: AVGO – Broadcom Inc. (NASDAQ)
Plan: Bullish pullback confirmed with LSMA pullback technique. We're looking for a dip towards an LSMA-supported zone to accumulate in multiple layers — the classic “thief” way.
🎯 Entry Strategy (Layered “Thief” Style)
We’re using a layering strategy — p
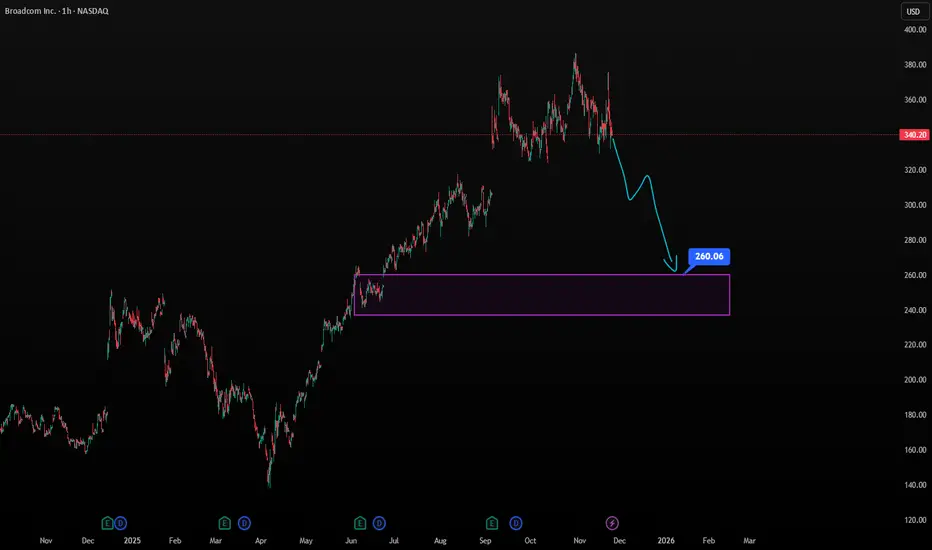
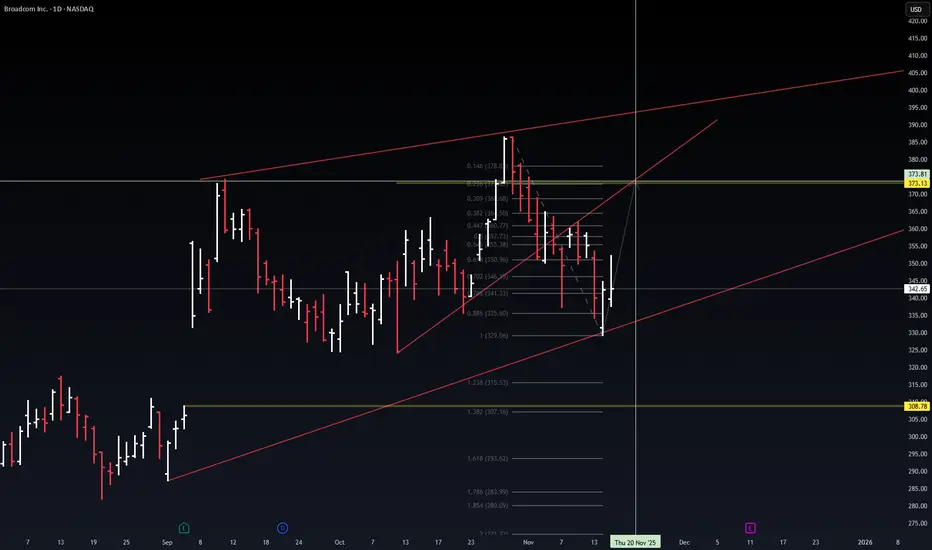
Midterm Stock Forecast for BroadcomNASDAQ:AVGO trades near $340, consolidating after significant gains. A drop below $320 may trigger selling toward $260 as H1 trend support breaks. Conversely, holding current levels and breaking $373 unlocks a move toward $480. Strong semiconductor demand and AI-networking exposure support long-te
AVGO: Institutional Forecast Meets Structural ConfirmationSharing a quick snapshot from the WaverVanir research desk.
Our Institutional Model and structural price-action analysis are aligned on a high-probability setup in AVGO:
Model Highlights
Current: $342.65
Target: $368.31 (+7.5% in 30 days)
Signal: Strong Buy
Direction Confidence: 67%
Confidenc
AVGO at a Critical Breakout: AI Boom or Pullback Ahead?Bullish Scenario (Breakout Above Channel)
Entry:
• Valid breakout above $405–410
• Preferably a daily close above the channel top
Targets:
1. Target 1: $430
2. Target 2: $455–460 (main target)
Stop Loss:
• $395
(If price falls back below the broken resistance)
Bearish Scenario (Rejecti

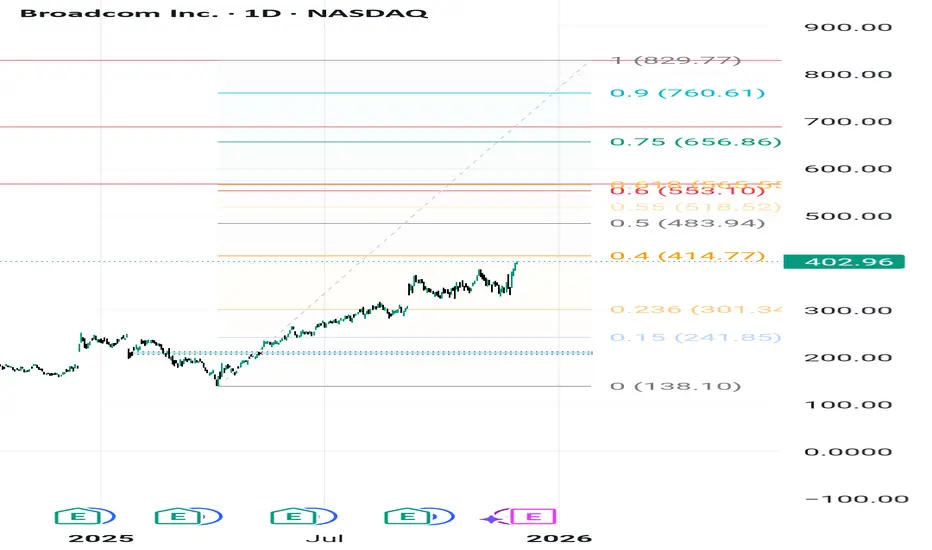
AVGO: Path to $829.77 – Navigating Critical Fibonacci Zones1. Overall Thesis and Price Structure
Broadcom Inc. (AVGO) exhibits a strong underlying bullish trend, fundamentally driven by demand for its AI chips and the successful integration of VMware. The technical objective targets a final high of $829.77. However, the path requires breaking through si
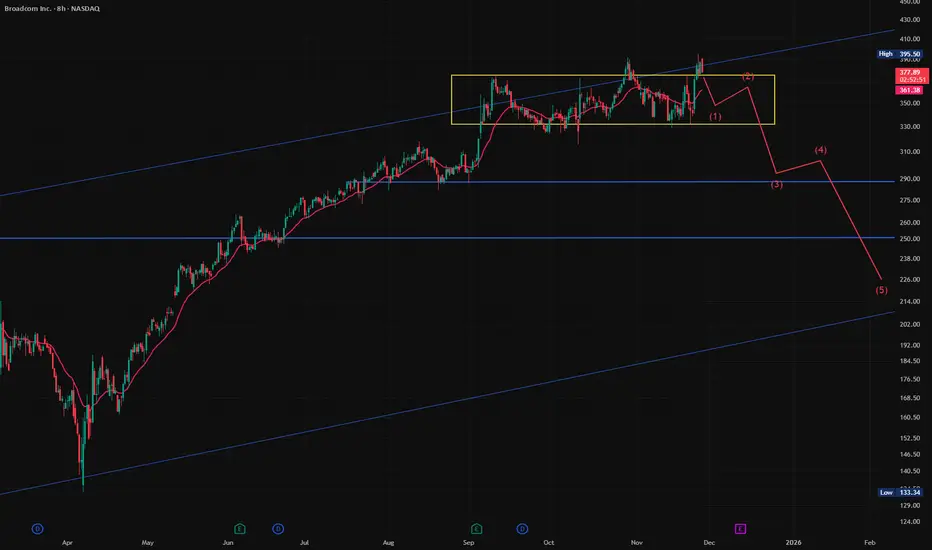
$AVGO a multi year channel overshoot is statistically bearishI have re-entered this NASDAQ:AVGO short. Odds are still 75% the yellow box will break to the downside eventually (a multi year channel line overshoot historically only has a 25% of succes)
This week is a seasonal Thanksgiving bullish week with strong news from Google, probably won't happen again
Broadcom Rides the AI Wave, Fueling Nasdaq's AscentSemiconductor titan Broadcom (NASDAQ: AVGO) emerged as a key catalyst driving the Nasdaq Composite significantly higher during a robust trading session for the technology sector. This bullish momentum was fueled by a confluence of positive developments within the artificial intelligence ecosystem, d
See all ideas
Summarizing what the indicators are suggesting.
Neutral
SellBuy
Strong sellStrong buy
Strong sellSellNeutralBuyStrong buy
Neutral
SellBuy
Strong sellStrong buy
Strong sellSellNeutralBuyStrong buy
Neutral
SellBuy
Strong sellStrong buy
Strong sellSellNeutralBuyStrong buy
An aggregate view of professional's ratings.
Neutral
SellBuy
Strong sellStrong buy
Strong sellSellNeutralBuyStrong buy
Neutral
SellBuy
Strong sellStrong buy
Strong sellSellNeutralBuyStrong buy
Neutral
SellBuy
Strong sellStrong buy
Strong sellSellNeutralBuyStrong buy
Displays a symbol's price movements over previous years to identify recurring trends.
Curated watchlists where 1YD is featured.


Frequently Asked Questions
The current price of 1YD is 333.10 EUR — it has decreased by −4.16% in the past 24 hours. Watch Broadcom Inc. stock price performance more closely on the chart.
Depending on the exchange, the stock ticker may vary. For instance, on SWB exchange Broadcom Inc. stocks are traded under the ticker 1YD.
1YD stock has risen by 11.65% compared to the previous week, the month change is a 2.16% rise, over the last year Broadcom Inc. has showed a 119.61% increase.
We've gathered analysts' opinions on Broadcom Inc. future price: according to them, 1YD price has a max estimate of 461.31 EUR and a min estimate of 258.68 EUR. Watch 1YD chart and read a more detailed Broadcom Inc. stock forecast: see what analysts think of Broadcom Inc. and suggest that you do with its stocks.
1YD stock is 4.67% volatile and has beta coefficient of 2.16. Track Broadcom Inc. stock price on the chart and check out the list of the most volatile stocks — is Broadcom Inc. there?
Today Broadcom Inc. has the market capitalization of 1.64 T, it has increased by 5.89% over the last week.
Yes, you can track Broadcom Inc. financials in yearly and quarterly reports right on TradingView.
Broadcom Inc. is going to release the next earnings report on Dec 11, 2025. Keep track of upcoming events with our Earnings Calendar.
1YD earnings for the last quarter are 1.48 EUR per share, whereas the estimation was 1.46 EUR resulting in a 1.69% surprise. The estimated earnings for the next quarter are 1.62 EUR per share. See more details about Broadcom Inc. earnings.
Broadcom Inc. revenue for the last quarter amounts to 13.97 B EUR, despite the estimated figure of 13.86 B EUR. In the next quarter, revenue is expected to reach 15.14 B EUR.
1YD net income for the last quarter is 3.63 B EUR, while the quarter before that showed 4.38 B EUR of net income which accounts for −17.28% change. Track more Broadcom Inc. financial stats to get the full picture.
Yes, 1YD dividends are paid quarterly. The last dividend per share was 0.50 EUR. As of today, Dividend Yield (TTM)% is 0.59%. Tracking Broadcom Inc. dividends might help you take more informed decisions.
Broadcom Inc. dividend yield was 1.25% in 2024, and payout ratio reached 170.61%. The year before the numbers were 2.19% and 55.79% correspondingly. See high-dividend stocks and find more opportunities for your portfolio.
As of Dec 2, 2025, the company has 37 K employees. See our rating of the largest employees — is Broadcom Inc. on this list?
EBITDA measures a company's operating performance, its growth signifies an improvement in the efficiency of a company. Broadcom Inc. EBITDA is 28.66 B EUR, and current EBITDA margin is 48.98%. See more stats in Broadcom Inc. financial statements.
Like other stocks, 1YD shares are traded on stock exchanges, e.g. Nasdaq, Nyse, Euronext, and the easiest way to buy them is through an online stock broker. To do this, you need to open an account and follow a broker's procedures, then start trading. You can trade Broadcom Inc. stock right from TradingView charts — choose your broker and connect to your account.
Investing in stocks requires a comprehensive research: you should carefully study all the available data, e.g. company's financials, related news, and its technical analysis. So Broadcom Inc. technincal analysis shows the buy rating today, and its 1 week rating is buy. Since market conditions are prone to changes, it's worth looking a bit further into the future — according to the 1 month rating Broadcom Inc. stock shows the buy signal. See more of Broadcom Inc. technicals for a more comprehensive analysis.
If you're still not sure, try looking for inspiration in our curated watchlists.
If you're still not sure, try looking for inspiration in our curated watchlists.