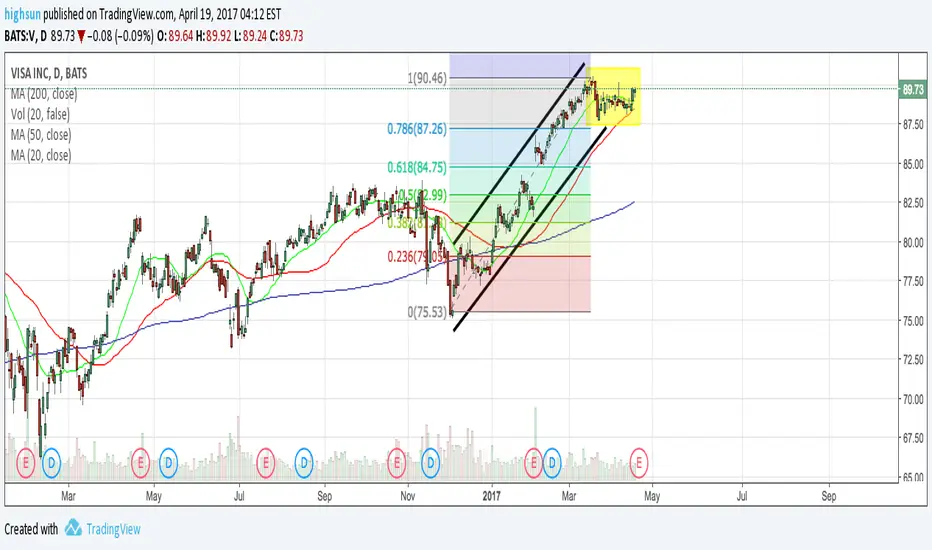
VISA sweet spotVISA sweet spot . Mulitple trend line resistance . Note that earnings have not improved in past 2 quarters but price is up 18% ..
3V64 trade ideas


$V continuation pattern breakouthigher time is in strong uptrend and showing strength
intermediate time frame also in uptrend and rising moving averages with the shorter time moving average slightly flattening showing consolidation with price trading around it
price is seen here forming a resistance at the 96.16-96.17 area with the three price rejection candles
forming a ascending triangle possibly looking for more retests of the resistance and higher lows to show buyers conviction
this is mostly a monitoring situation not a play yet
on the lower time frame- it is showing a bullish rectangle pattern- longer it stays in the range more energy will be built for the possible breakout move
just have to watch what price does in the upcoming couple days
measured move is a .33 move if broken out of resistance which will bring price to 96.50 area and extension level .618 at the 97.1x area

5.17.2017 Trade Idea: VIf you are interested in more of our trades, check out our profile and Tradingview Indicator @ChaoticTrader

V - continuing long trend with a small bull flagV is moving higher in a rising channel and now close to support trendline
a break above 93$ will be bullish acting as a bull flag pattern to 97.5$


Visa AnalysisCurrently moving sideways. Still in uptrend. Possible Support and Resistance line identified w/ Fib Retracement. Wait.


VISA RISING WEDGEWe can clearly see exhaustion of uptrend and breakout of rising wedge.
Do not chase price, just wait for pullback and enter trade.
Final target at 60.00


Another indicator Visa will move upHistorically when the RSI reaches this level the stock moves up at least 1.00% over the next few weeks with an average move of 3.75%. The stock will most likely fall over the next few trading days before testing resistance at 83.70. I plan to place CALLS over the next few days on the dip.

Visa pointing up soonHistorically when the coppock curve reaches this level the stock gains a an average of 5.11% over the next few weeks. Because Visa has had 4 consecutive days of solid gains, it may drop over the next 1-2 trading days. Buying the dip would be a great options play. The pink zone is the target area for the price to reach. My conservative play is a move to at least 83.70 which has been a frequent area of resistance.


VISA is in critical price level. Bull or Bear will dominant? Visa is trying to make fourth test to break and close above $82 on weekly chart.
