AMGN | Healthcare STRONG | LONGAmgen, Inc. is a biotechnology company, which engages in the discovery, development, manufacture, and marketing of human therapeutics. The company was founded by William K. Bowes, Jr., Franklin Pitcher Johnson, Jr., George B. Rathmann, and Joseph Rubinfeld on April 8, 1980 and is headquartered in Th
Key facts today
Next report date
—
Report period
—
EPS estimate
—
Revenue estimate
—
11.10 EUR
3.95 B EUR
32.10 B EUR
537.37 M
About Amgen Inc.
Sector
Industry
CEO
Robert A. Bradway
Website
Headquarters
Thousand Oaks
Founded
1980
ISIN
US0311621009
FIGI
BBG000DJ1RM8
Amgen, Inc. is a biotechnology company, which engages in the discovery, development, manufacture, and marketing of human therapeutics. The company was founded by William K. Bowes, Jr., Franklin Pitcher Johnson, Jr., George B. Rathmann, and Joseph Rubinfeld on April 8, 1980 and is headquartered in Thousand Oaks, CA.
Related stocks

AMGN: the medicine cabinet for your portfolioOn the weekly chart, Amgen (AMGN) trades at $289.56, holding above the key $272–280 support zone, aligned with the 0.705–0.79 Fibo levels. This area forms a clear buy zone, where buyers are likely to step in. The technical structure remains bullish: the uptrend is intact, with targets at $346.85, ma

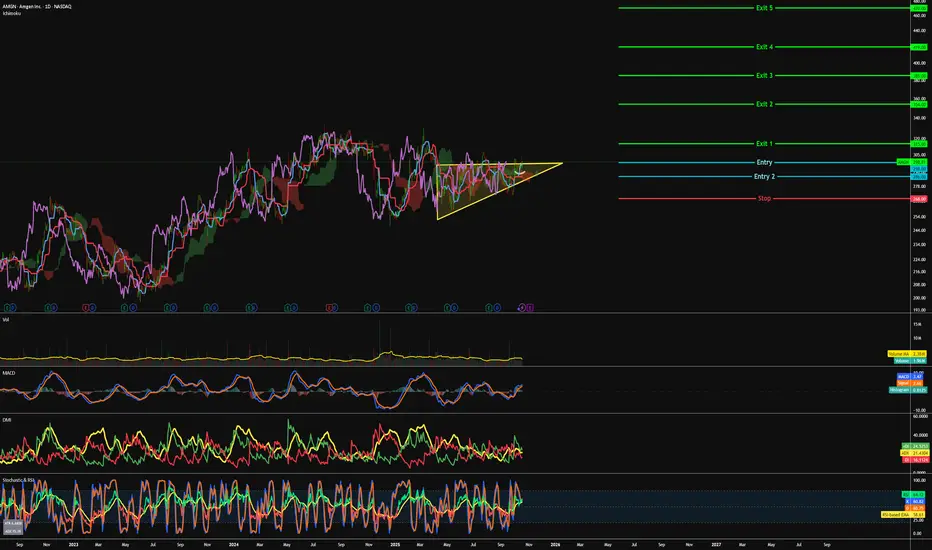
AMGN - Combo bullish signs=======
Volume
=======
- Healthy
==========
Price Action
==========
- Bullish flag spotted
- Supported above $310
- Gapped up from a near 6 month ascending triangle
=================
Technical Indicators
=================
- Ichimoku
>>> price above cloud
>>> Green kumo expanding
>>> Tenken - A

AMGN Long TradeThis will likely pump over 300$
Its pushing over vwap now and 320$ seems like a decent tp area
TP1 304$
TP2 320$
TP3 344$

AMGN - To see a new high=======
Volume
=======
- neutral
==========
Price Action
==========
- rounding bottom recently
- Ascending triangle noticed
=================
Technical Indicators
=================
- Ichimoku
>>> price above cloud
>>> Green kumo budding
>>> Tenken - above clouds and pointing up
>>> Chiku - wi
return to structure with multiple confluences some divergences as well as return to narrative strong point , volume profile helps check out upside story
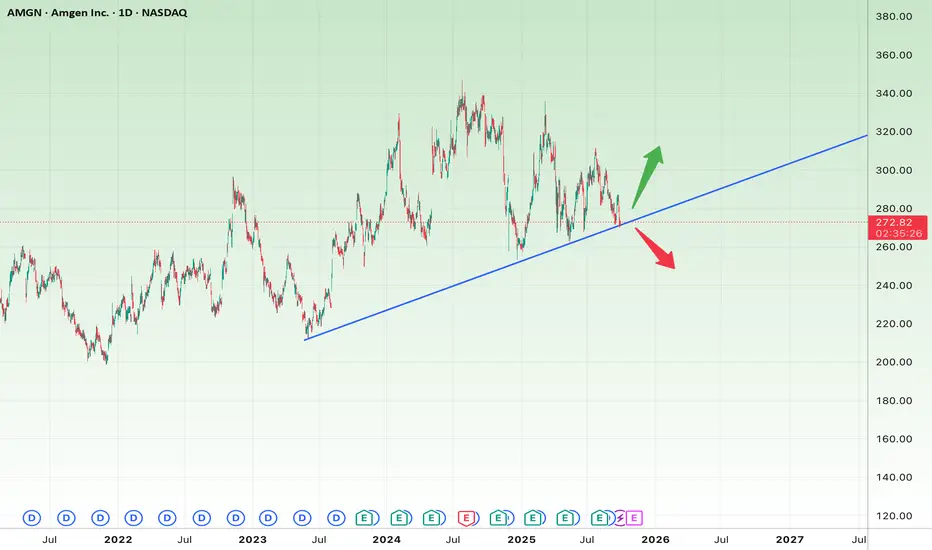
Professional Technical Analysis of AMGN (Amgen Inc.)
Looking at the daily chart of AMGN, here’s the outlook:
📊 Short-Term Outlook (1–4 weeks)
Price Structure: The stock is testing a long-term ascending trendline (blue line). This level has repeatedly acted as strong support since early 2023.
Risk: If buyers fail to defend the trendline, a breakdow
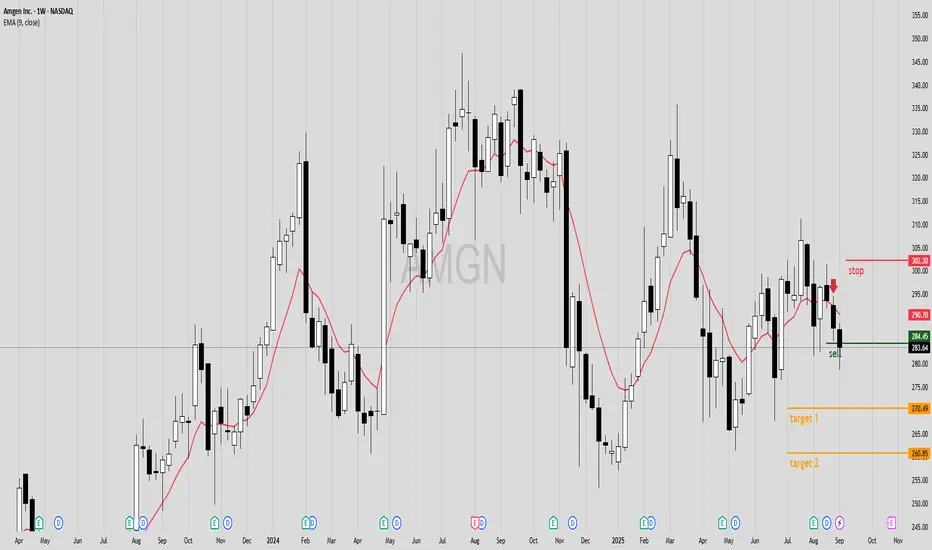
Test sell in AMGN strategy simulator at 284.45Testing a sell of AMGN in the strategy simulator, with first target at 270.49, second target at 260.85, and stop at 302.30
Utilizing algorithms to identify A+ trade opportunitiesMy typical video consists of analyzing a specific chart and telling its story. But here, I take a different approach and analyze how to actually capitalize on the knowledge we have through the algorithms.
As you'll see, these are repeated algorithms that we've identified from previous price actio

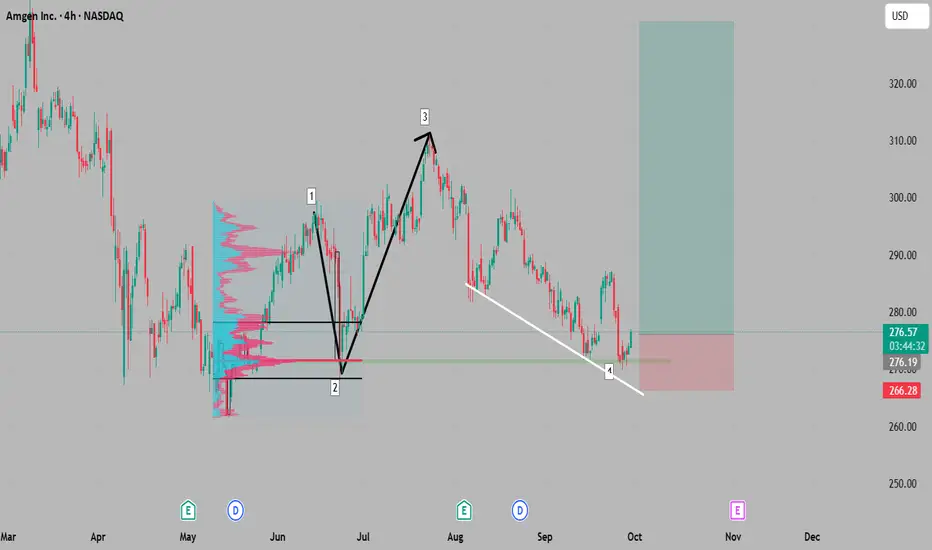
AMGN Long Trade Setup!📈
🕒 Timeframe: 30 min
🔻 Pattern: Falling wedge nearing breakout 🔼
📍 Entry Zone: ~$277.00 ✅
🎯 Target: $283.35 💰
🛑 Stop Loss: Below $274.00 ⚠️
🔥 Why It Looks Bullish:
🔺 Falling wedge structure — a known bullish pattern
🧱 Strong bounce off demand zone (support + yellow line)
💚 Green reversal candle

See all ideas
Summarizing what the indicators are suggesting.
Neutral
SellBuy
Strong sellStrong buy
Strong sellSellNeutralBuyStrong buy
Neutral
SellBuy
Strong sellStrong buy
Strong sellSellNeutralBuyStrong buy
Neutral
SellBuy
Strong sellStrong buy
Strong sellSellNeutralBuyStrong buy
An aggregate view of professional's ratings.
Neutral
SellBuy
Strong sellStrong buy
Strong sellSellNeutralBuyStrong buy
Neutral
SellBuy
Strong sellStrong buy
Strong sellSellNeutralBuyStrong buy
Neutral
SellBuy
Strong sellStrong buy
Strong sellSellNeutralBuyStrong buy
Displays a symbol's price movements over previous years to identify recurring trends.
AMGN.GA
Amgen Inc. 8.125% 01-APR-2097Yield to maturity
6.11%
Maturity date
Apr 1, 2097
US31162BP4
Amgen Inc. 5.375% 15-MAY-2043Yield to maturity
6.03%
Maturity date
May 15, 2043
US31162DU1
Amgen Inc. 5.75% 02-MAR-2063Yield to maturity
5.84%
Maturity date
Mar 2, 2063
US31162DG2
Amgen Inc. 4.4% 22-FEB-2062Yield to maturity
5.80%
Maturity date
Feb 22, 2062
US31162DT4
Amgen Inc. 5.65% 02-MAR-2053Yield to maturity
5.74%
Maturity date
Mar 2, 2053
AMGD
Amgen Inc. 4.2% 22-FEB-2052Yield to maturity
5.73%
Maturity date
Feb 22, 2052
US31162DK3
Amgen Inc. 4.875% 01-MAR-2053Yield to maturity
5.71%
Maturity date
Mar 1, 2053
AMGN4437315
Amgen Inc. 4.563% 15-JUN-2048Yield to maturity
5.68%
Maturity date
Jun 15, 2048
AMGN4436563
Amgen Inc. 4.663% 15-JUN-2051Yield to maturity
5.66%
Maturity date
Jun 15, 2051
AMGN5186584
Amgen Inc. 2.77% 01-SEP-2053Yield to maturity
5.63%
Maturity date
Sep 1, 2053
US31162BZ2
Amgen Inc. 4.4% 01-MAY-2045Yield to maturity
5.57%
Maturity date
May 1, 2045
See all AMG bonds
Curated watchlists where AMG is featured.


Frequently Asked Questions
The current price of AMG is 287.60 EUR — it has increased by 0.29% in the past 24 hours. Watch Amgen Inc. stock price performance more closely on the chart.
Depending on the exchange, the stock ticker may vary. For instance, on SWB exchange Amgen Inc. stocks are traded under the ticker AMG.
AMG stock has risen by 1.32% compared to the previous week, the month change is a 15.13% rise, over the last year Amgen Inc. has showed a 9.44% increase.
We've gathered analysts' opinions on Amgen Inc. future price: according to them, AMG price has a max estimate of 346.73 EUR and a min estimate of 156.03 EUR. Watch AMG chart and read a more detailed Amgen Inc. stock forecast: see what analysts think of Amgen Inc. and suggest that you do with its stocks.
AMG stock is 2.94% volatile and has beta coefficient of 0.24. Track Amgen Inc. stock price on the chart and check out the list of the most volatile stocks — is Amgen Inc. there?
Today Amgen Inc. has the market capitalization of 159.82 B, it has increased by 4.34% over the last week.
Yes, you can track Amgen Inc. financials in yearly and quarterly reports right on TradingView.
Amgen Inc. is going to release the next earnings report on Feb 3, 2026. Keep track of upcoming events with our Earnings Calendar.
AMG earnings for the last quarter are 4.81 EUR per share, whereas the estimation was 4.28 EUR resulting in a 12.37% surprise. The estimated earnings for the next quarter are 4.10 EUR per share. See more details about Amgen Inc. earnings.
Amgen Inc. revenue for the last quarter amounts to 8.14 B EUR, despite the estimated figure of 7.64 B EUR. In the next quarter, revenue is expected to reach 8.20 B EUR.
AMG net income for the last quarter is 2.74 B EUR, while the quarter before that showed 1.22 B EUR of net income which accounts for 125.45% change. Track more Amgen Inc. financial stats to get the full picture.
Yes, AMG dividends are paid quarterly. The last dividend per share was 2.03 EUR. As of today, Dividend Yield (TTM)% is 2.74%. Tracking Amgen Inc. dividends might help you take more informed decisions.
Amgen Inc. dividend yield was 3.45% in 2024, and payout ratio reached 119.05%. The year before the numbers were 2.96% and 68.24% correspondingly. See high-dividend stocks and find more opportunities for your portfolio.
As of Nov 20, 2025, the company has 28 K employees. See our rating of the largest employees — is Amgen Inc. on this list?
EBITDA measures a company's operating performance, its growth signifies an improvement in the efficiency of a company. Amgen Inc. EBITDA is 13.36 B EUR, and current EBITDA margin is 41.84%. See more stats in Amgen Inc. financial statements.
Like other stocks, AMG shares are traded on stock exchanges, e.g. Nasdaq, Nyse, Euronext, and the easiest way to buy them is through an online stock broker. To do this, you need to open an account and follow a broker's procedures, then start trading. You can trade Amgen Inc. stock right from TradingView charts — choose your broker and connect to your account.
Investing in stocks requires a comprehensive research: you should carefully study all the available data, e.g. company's financials, related news, and its technical analysis. So Amgen Inc. technincal analysis shows the buy rating today, and its 1 week rating is buy. Since market conditions are prone to changes, it's worth looking a bit further into the future — according to the 1 month rating Amgen Inc. stock shows the strong buy signal. See more of Amgen Inc. technicals for a more comprehensive analysis.
If you're still not sure, try looking for inspiration in our curated watchlists.
If you're still not sure, try looking for inspiration in our curated watchlists.