DFS Approaching Resistance, Potential Reversal!DFS is approaching its resistance at 63.98 (38.2% & 50%Fibonacci retracement, horizontal pullback resistance) where it is expected to reverse down to its support at 59.41 (50% Fibonacci retracement).
Ichimoku cloud shows signs of bearish pressure.
DC7 trade ideas

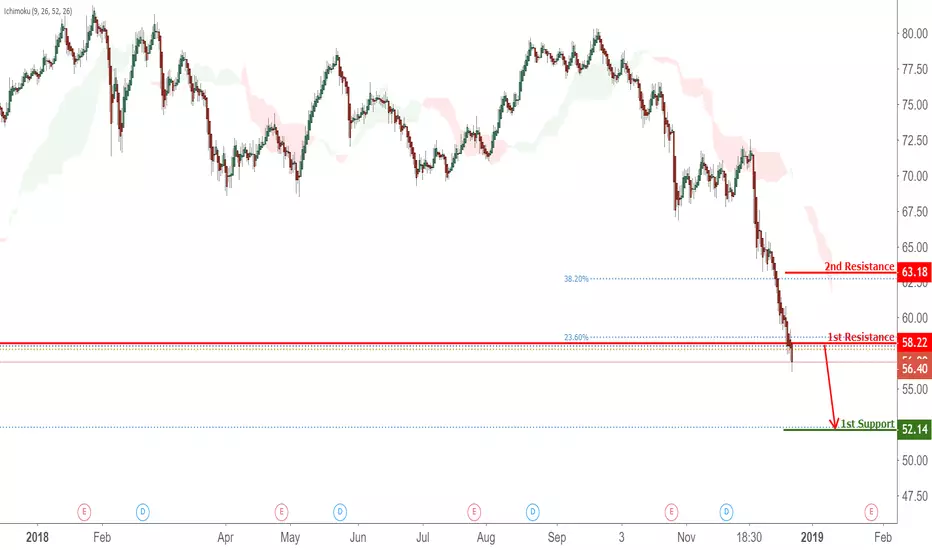
DFS Broke Out Of Its Major Support, Potential Drop!DFS broke out of its major support-turned-resistance at 58.22 where price could further drop its support at 52.14 (76.4% Fibonacci retracement).
Ichimoku cloud shows signs of bearish pressure which contributes to our bearish bias.
DFS Approaching Support, Potential Bounce!DFS is approaching support at 58.2 (100% Fibonacci extension, 61.8% Fibonacci retracement, horizontal swing low support) where it could potentially rise to its resistance at 67.03 (61.8% Fibonacci retracement, horizontal pullback resistance).
Stochastic (55, 5, 3) is approaching support at 0.62% where a corresponding bounce could occur.

DFS Testing Support, Potential Bounce!DFS is testing its support at 63.91 (61.8% Fibonacci extension, 76.4% Fibonacci retracement, horizontal overlap support) where it could potentially rise to its resistance at 71.92 (50% Fibonacci retracement, horizontal swing high resistance).
Stochastic (89, 5, 3) is approaching its support at 1.2% where a corresponding bounce could occur.

DFS Approaching Support, Potential Bounce! DFS is approaching our first support at 63.61 (horizontal overlap support, 61.8% Fibonacci extension, 76.4% Fibonacci retracement) where a strong bounce might occur above this level pushing price up to our major resistance at 72.27 (horizontal swing high resistance, 50% Fibonacci retracement).
Stochastics (89,5,3) is also approaching support and we might see a corresponding bounce in price.


DFS-Discover Financial ServicesThis is the highly probability broadcasting that might happen, Base on Elliott Wave Strategy.
In God We Trust.

Bank vs. Cryptocurrency #16 (DFS)Chart pattern recognition in real time is something that do not need too much minutes for analyze,
In a past post I commented about no expend more than 3 minutes rethinking, reformulating, reanalyzing
But it sounds contradictory If I use a discretionary method for picking stocks and I have thoughts and opinions about the stock chart that I watching
For example If I select 5 names of 100. What is my argument for select these 5
I have a criteria for picking stocks, is technical but It is not scientifically proven, is discretionary/qualitative based in experience
If I recognize a pattern when I selecting charts is because I saw some similar in the past and in then in the present
I immediately recognize that here there are an opportunity for making profits
I recognize patterns, but no because I readed a lot of books
I recognize because I learned in real time, that the development of a chart pattern take in some cases years to take shape,
I not propose an Idea simply because I wanna post and get likes.
I spend hours looking charts but when I recognize and opportunity in a specific stock, I do not spend more than 2 or 3 minutes.
Then I make a Top Down analysis From Weekly to daily to 4-Hrs and draw the main resistance and support lines. I search gaps in the daily chart
I search for some candlestick patterns and what tell me those candles in set with the methodology that I use (Support Resistance) Plus moving averages.
For example this idea is based in a continuation pattern in a trend and the concept that resistance becomes support.


Discovery Financial Services DFS buy setup at weekly demand zoneAmerican Stock DFS Discovery Financial Services has a clear long bias. Price fell short of retracing to this weekly demand zone around 57 area. Brand new weekly demand level, that imbalance around 59.55 has a very strong and explosive bullish impulse. New demand levels are being created, supply levels are being eliminated. Longs at weekly demand zones for a long term investment.

8ema ON THE WAY TO CROSS BELOW 48ema, BEARISHENTER: 62.38 STOP: 62.80 TARGET: 61.54 (Risk:Reward=1:2)


DFS - long term viewDFS was on a long bull run from 2009 to 2014
price created a correction channel in 2015 bouncing off 38.2 fib evel
2016 price broke above the channel, retested and reached resistence at 58$
looking to go long here on a high vol break above 58.5$
note that price action created also inv H&S which make a big upside potencial
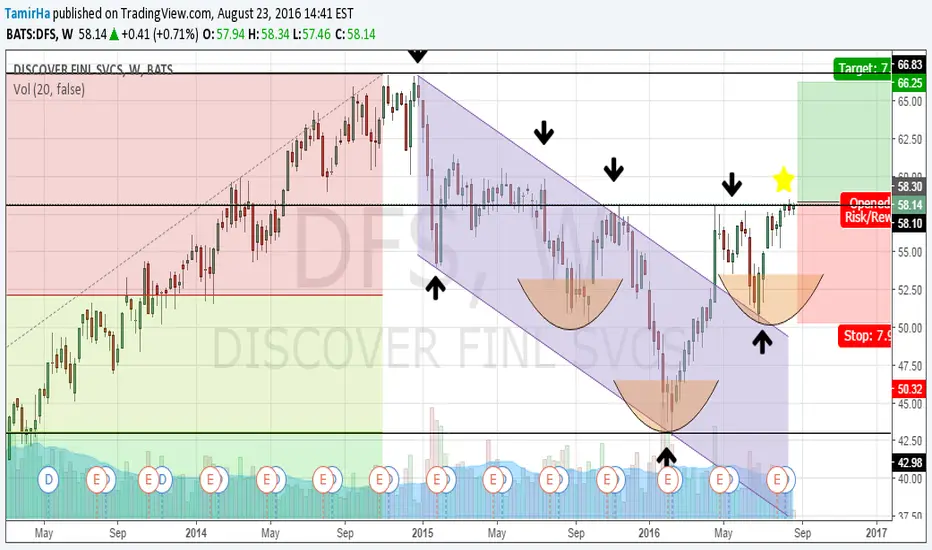
DFS: Post-FOMC longDFS is offering an interesting setup in the monthly, daily and 65 min charts. We can clearly see the reaction to the news has been positive and can expect continuation into the highs. Target on chart is derived from monthly price action, the stop from the daily, and we use the 65 min timeframe to get a clear picture of the price action around the news. All 3 timeframes support the idea that going long at market open is wise.
Risk is a drop to 53.74, but upside is as high as 58.10 within 3 months or less.
If interested in my trading signals, or in personal tuition, contact me privately. I'm offering a considerable discount on a packaged course which includes access to my private trading signals list for a year.
Cheers,
Link to Tim West's chatroom: www.tradingview.com
We discuss setups like this often there. Feel free to stop by and subscribe to his indicator pack. If you have any questions ask.

DFS-160413-SMA/FIB-G1D-SHORTNYSE:DFS is involved in a large downtrend, now is at the end of a correction bull trend, but is close to turndown. The price is close to test the 52 zone or 23.6 of her fibo and the 200 sma. i think the price can return over test the 200 SMA.
Setup: short
TP1: 43
SL: 53.2
entry: 52.5

Long DFSThis is intended to be a short term, because on the longer term time frames it is in correction mode.
Series of HH and HL on intraday chart
Rising 5d VWMA held support
Overal market - bullish

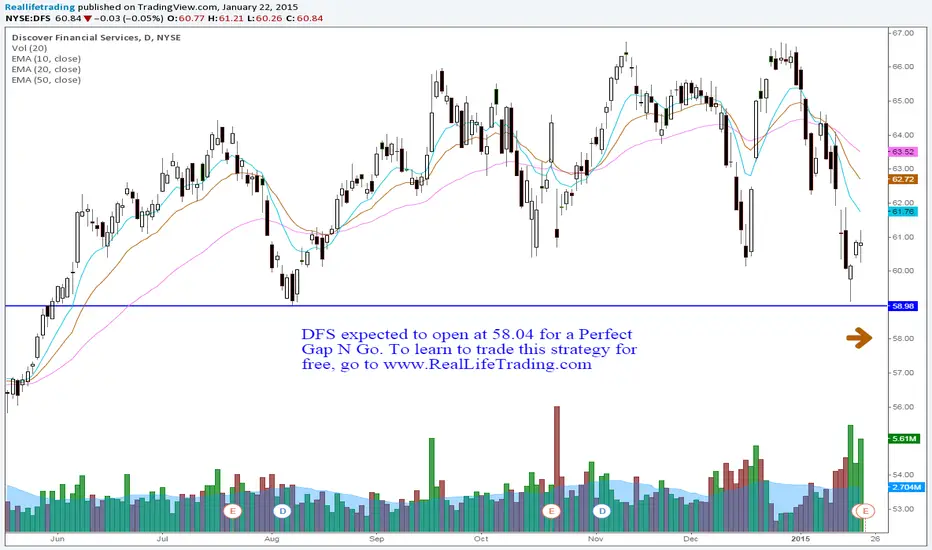
DFS Day Trade Perfect Gap N Go (Brad Reed Jan22,2015) DFS expected to open at 58.04 for a Perfect Gap N Go. To learn to trade this strategy for free, go to www.RealLifeTrading.com
DFS due for a pullback?My Dad asked me to look at, and analyze the charts for $DFS today so, here's my take on DiscoverFS: Looking at the bigger picture, DFS has been on a great run with healthy pullbacks to keep it climbing. But as we all know it can't go up forever. So when does DFS pullback? Well, DFS has hit the 49.0 marker twice, but hasn't stayed long above which shows some solid resistance at that point. This most recent climb has followed the Hagopian Line, and as you can see DFS is abou to tough the line again. I believe if DFS breaks the Line we could see a -3.0 pullback to the 45.14 - 45.35 mark. Seeing as DFS has touched 49 two times without breaking long above it looks like DFS is going to pull back before making new highs. If I were holding a position I'd probably sell half my shares, put a limit just under the trend line and buy back in when it stays long above 49. DFS offers great plays and is a healthy stock. I don't think we see a fall here unless the double top is true; then we could see 41 again while DFS builds a bottom. I'm saying to wait until near-end trading day Wed. Thur. Fri. to see if DFS has a major breach or Bearish indicators, before exiting the position.
