Anthropic Retail News False InformationAI technology is vast and will impact almost every one of the 130+ industries in the US.
The news of Anthropic threatening software companies and big tech companies, such as AMZN and GOOG, was false news.
Anthropic's new technology is specifically designed for regulated industries such as the Finan
Salesforce, Inc.
No trades
Key facts today
Next report date
—
Report period
—
EPS estimate
—
Revenue estimate
—
6.56 EUR
5.98 B EUR
36.59 B EUR
912.14 M
About Salesforce, Inc.
Sector
Industry
CEO
Marc Russell Benioff
Website
Headquarters
San Francisco
Founded
1999
IPO date
Jun 23, 2004
Identifiers
3
ISIN US79466L3024
Salesforce, Inc. engages in the design and development of cloud-based enterprise software for customer relationship management. Its solutions include sales force automation, customer service and support, marketing automation, digital commerce, community management, collaboration, industry-specific solutions, and salesforce platform. The firm also provides guidance, support, training, and advisory services. The company was founded by Marc Russell Benioff and Parker Harris in 1999 and is headquartered in San Francisco, CA.
Related stocks

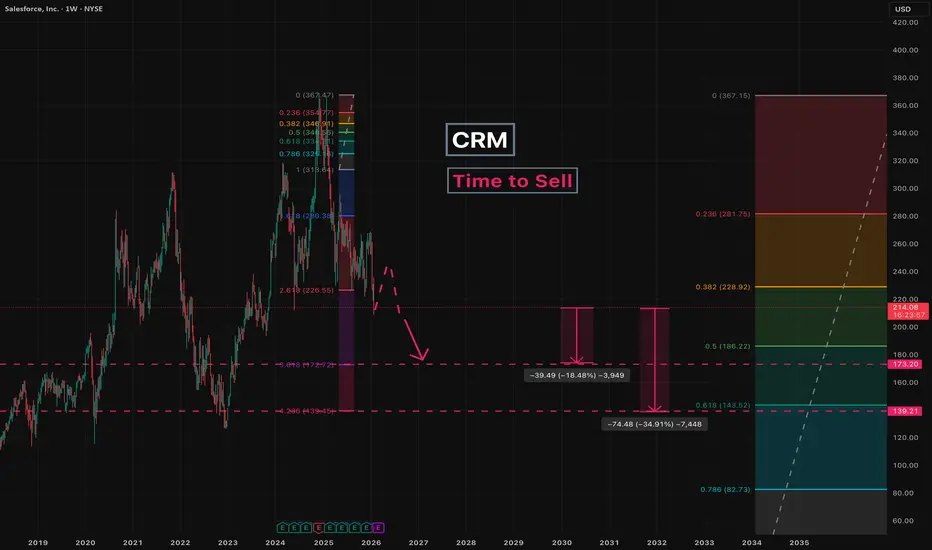
CRM - Time to SellSince December 2024, a five -wave impulsive decline has been developing.
We are now entering the fifth wave.
At the moment, a minor pullback is possible before the decline continues, so caution is advised.
A return to the 367 level from current prices appears unlikely.
Key targets:
173
13
Is Salesforce Now a Defense Contractor?Salesforce has reached a defining inflection point that fundamentally transforms its corporate identity. The company, historically known as a commercial software provider, has secured a massive $5.64 billion contract with the U.S. Army extending through 2035. For the first time, the tech giant is po

Salesforce Wins $5.6B Army Deal: AI & Strategic AnalysisAn in-depth analysis of Salesforce’s $5.6B U.S. Army contract and its multi-domain impact on CRM stock.
Geostrategy and Geopolitics: The Defense Pivot
Salesforce effectively entered the hard-power arena with its $5.6 billion U.S. Army contract. This move transcends typical software procurement.

Wait for Salesforce to bottom before buyingCRM has been under heavy selling pressre, just like the larger software group. We still have 1 major leg down pending and I see bottom somewhere at 158 USD, for long term investors, shut down your screen for a while and breathe. For new entrants in CRM, wait before going long. Opportunity should com

CRM: Long-Term Breakout Path to $400–$475+ on AI Dominance & FibCRM (Salesforce) is sitting right at a major multi-year support zone (~$227–$195) after a healthy consolidation/pullback from 2024/2025 highs.
We've got:
Strong horizontal support band at $227 (orange) holding as the base.
Lower green support at ~$166–$195 acting as the ultimate floor.
Broken desce

Why SaaS Are Still Not Growing?Why SaaS Heavily Depend on Fed Rates
SaaS companies generally heavily depend on low interest rates because this is a growth-oriented sector: high rates increase borrowing costs, reduce valuations by multipliers, and force a focus on profitability instead of growth. Tailwinds usually arise when the

SAlesforce - TGT 291The stock has broken out from the consolidation.
The stock is expected to hit the levels of 291 (90% chance) and he next move can hit the levels of 301.

CRM LONGDescending channel resolution in progress.
Price has pushed back to the top of the range and is pressing into a well-defined value area after a strong reaction from the channel low. Higher lows are intact and pullbacks continue to hold short-term moving average support. Acceptance above this level

New Setup : $CRMBullish LongWave, Bullish Crossover and price that shows some strenght on lower timeframes.
Ready to catch it !!!

See all ideas
Summarizing what the indicators are suggesting.
Neutral
SellBuy
Strong sellStrong buy
Strong sellSellNeutralBuyStrong buy
Neutral
SellBuy
Strong sellStrong buy
Strong sellSellNeutralBuyStrong buy
Neutral
SellBuy
Strong sellStrong buy
Strong sellSellNeutralBuyStrong buy
An aggregate view of professional's ratings.
Neutral
SellBuy
Strong sellStrong buy
Strong sellSellNeutralBuyStrong buy
Neutral
SellBuy
Strong sellStrong buy
Strong sellSellNeutralBuyStrong buy
Neutral
SellBuy
Strong sellStrong buy
Strong sellSellNeutralBuyStrong buy
Displays a symbol's price movements over previous years to identify recurring trends.
US79466LAM6
Salesforce, Inc. 3.05% 15-JUL-2061Yield to maturity
5.83%
Maturity date
Jul 15, 2061
US79466LAL80
Salesforce, Inc. 2.9% 15-JUL-2051Yield to maturity
5.74%
Maturity date
Jul 15, 2051
US79466LAK0
Salesforce, Inc. 2.7% 15-JUL-2041Yield to maturity
5.51%
Maturity date
Jul 15, 2041
US79466LAJ3
Salesforce, Inc. 1.95% 15-JUL-2031Yield to maturity
4.35%
Maturity date
Jul 15, 2031
US79466LAH7
Salesforce, Inc. 1.5% 15-JUL-2028Yield to maturity
3.79%
Maturity date
Jul 15, 2028
US79466LAF13
Salesforce, Inc. 3.7% 11-APR-2028Yield to maturity
3.74%
Maturity date
Apr 11, 2028
See all FOO bonds
Frequently Asked Questions
The current price of FOO is 161.18 EUR — it has increased by 1.35% in the past 24 hours. Watch Salesforce, Inc. stock price performance more closely on the chart.
Depending on the exchange, the stock ticker may vary. For instance, on SWB exchange Salesforce, Inc. stocks are traded under the ticker FOO.
FOO stock has fallen by −8.38% compared to the previous week, the month change is a −27.11% fall, over the last year Salesforce, Inc. has showed a −51.44% decrease.
We've gathered analysts' opinions on Salesforce, Inc. future price: according to them, FOO price has a max estimate of 403.29 EUR and a min estimate of 189.33 EUR. Watch FOO chart and read a more detailed Salesforce, Inc. stock forecast: see what analysts think of Salesforce, Inc. and suggest that you do with its stocks.
FOO stock is 3.09% volatile and has beta coefficient of 1.30. Track Salesforce, Inc. stock price on the chart and check out the list of the most volatile stocks — is Salesforce, Inc. there?
Today Salesforce, Inc. has the market capitalization of 151.13 B, it has decreased by −7.24% over the last week.
Yes, you can track Salesforce, Inc. financials in yearly and quarterly reports right on TradingView.
Salesforce, Inc. is going to release the next earnings report on Feb 26, 2026. Keep track of upcoming events with our Earnings Calendar.
FOO earnings for the last quarter are 2.82 EUR per share, whereas the estimation was 2.48 EUR resulting in a 13.59% surprise. The estimated earnings for the next quarter are 2.57 EUR per share. See more details about Salesforce, Inc. earnings.
Salesforce, Inc. revenue for the last quarter amounts to 8.89 B EUR, despite the estimated figure of 8.91 B EUR. In the next quarter, revenue is expected to reach 9.44 B EUR.
FOO net income for the last quarter is 1.81 B EUR, while the quarter before that showed 1.65 B EUR of net income which accounts for 9.39% change. Track more Salesforce, Inc. financial stats to get the full picture.
Yes, FOO dividends are paid quarterly. The last dividend per share was 0.35 EUR. As of today, Dividend Yield (TTM)% is 0.88%. Tracking Salesforce, Inc. dividends might help you take more informed decisions.
Salesforce, Inc. dividend yield was 0.47% in 2024, and payout ratio reached 25.15%. The year before the numbers were 0.00% and 0.00% correspondingly. See high-dividend stocks and find more opportunities for your portfolio.
As of Feb 7, 2026, the company has 76.45 K employees. See our rating of the largest employees — is Salesforce, Inc. on this list?
EBITDA measures a company's operating performance, its growth signifies an improvement in the efficiency of a company. Salesforce, Inc. EBITDA is 12.51 B EUR, and current EBITDA margin is 34.93%. See more stats in Salesforce, Inc. financial statements.
Like other stocks, FOO shares are traded on stock exchanges, e.g. Nasdaq, Nyse, Euronext, and the easiest way to buy them is through an online stock broker. To do this, you need to open an account and follow a broker's procedures, then start trading. You can trade Salesforce, Inc. stock right from TradingView charts — choose your broker and connect to your account.
Investing in stocks requires a comprehensive research: you should carefully study all the available data, e.g. company's financials, related news, and its technical analysis. So Salesforce, Inc. technincal analysis shows the sell today, and its 1 week rating is strong sell. Since market conditions are prone to changes, it's worth looking a bit further into the future — according to the 1 month rating Salesforce, Inc. stock shows the sell signal. See more of Salesforce, Inc. technicals for a more comprehensive analysis.
If you're still not sure, try looking for inspiration in our curated watchlists.
If you're still not sure, try looking for inspiration in our curated watchlists.