Position should be closed soon.One of our most recent open positions is $Hum #Humana
The entry signal was at $348.14.
Best performance at 7.12%
The trend is near to brake both trend lines. We would apply the stop loss at about $360, that is almost half of the big green-candle of the 16 Dec.
HUM trade ideas


HUMSystem T Performances: Annual Compound Profit 40%, Win Rate 55%, Risk/Reward Ratio 1:2, 20 Years of Backtesting Data, Over 100 Markets.
* Click Like and Follow to Support My Work!
---
Hi Traders,
I'd like to introduce the System T, a computerized trading system that analyzed and backtested the 20 years history data of over 100 markets.
This post is my sharing of how I think about systematic trading and the signals generated by the System T.
(This is my opinion only, NOT the financial advice.)
I think that for the system to open a trade and manage risk, it only needs a buy signal & a stop-loss signal clearly on the chart.
Once the system finds a good trend, it will ride it as long as possible. The stop-loss will be adjusted accordingly to the new price movement.
(Remember to follow this trade idea and follow my profile to get updates about the stop-loss adjustment and sell signal based on the latest price and market conditions daily.)
System T performances above will give you an idea of how it performs in the last 20 years.
Notice that this result was achieved only if I strictly followed the rule: "Only and Always Buy & Sell based on the System Signals".
Don't sell when there is no sell signal as we all want to follow the good trends til the end like everything in life does. \(^-^)/
Also, my system is extremely diversified through over 100 markets so that it only risks less than -1% of the total capital per trade.
Thank you and good luck!
---
DISCLAIMER:
I am NOT a financial advisor, and nothing I say is meant to be a recommendation to buy or sell any financial instrument.
My views are general in nature and I am not giving financial advice. You should not take my opinion as financial advice. This is my opinion only.
Do your own due diligence, and take 100% responsibility for your financial decisions.
Trading and investing are risky! Don't invest money you can't afford to lose, because many traders and investors lose money. There are no guarantees or certainties in trading.
- Content is for education purposes only, not investment advice.
- Trading involves a high degree of risk.
- We’re not investment or trading advisers.
- Nothing we say is a recommendation to buy or sell anything.
- There are no guarantees or certainties in trading.
- Many traders lose money. Don’t trade with money you can’t afford to lose.

HUM Fundamentally, it is a good stock to own. It is in line with the rest of the insurance industry in terms of pricing, with healthy debt levels and profit margins. But you also have to consider that the debate regarding M4A, or even a public option, is going to heat up once 2020 hits, really escalating if the Dems take it all. But I believe that those fears are overblown, because there are way too many people on both sides of the aisle that would be kind of squeamish on the idea.
Technically, there are signs of a potential cup and handle pattern. There is a possibility of a drop from the 290-291 Fibonacci resistance point, but it could more than break that point with a great earnings report. Plus, there has been some significant activity in calls expiring 11/8, 2 days after they release their earnings.

Long until MFI hit's about 30-40 range - Looking for input.Disclaimer: This is not investing advice. Please use your own due diligence before investing.
I am still pretty new to the technical analysis and am looking for input. It appears there is an interesting wedge here as the short-term position appears to be trading at the lower end of the Range with the MFI on a very low side. The overall trend looking back appears for a negative position. However, there might be a couple days of positive increase as the MFI rises. Exit Position is if MFI gets to around 30-45 range.
I am curious people's thoughts on this position.


Humana, nice spot Humana looking like a flag and were right at the top of it, if we can break above i'd play long for a shot str8 to the 200 day quick, if it not wait for the break down and then strong short


HUMANA HUM 10% OpptyHumana has been selling off since late 2018. Based on the daily timeframe we are now well over-extended below the moving averages and exiting oversold RSI. A recent bounce can allow for us to return to the previous structure levels, the nearest being ~270 area (9-10%).

Humana incMMHVW - Humana Inc., together with its subsidiaries, operates as a health and well-being company in the United States. Share price is $248.45 vs Future cash flow value of $527.61 Is considerably undervalued. It’s level of debt (61.4%) compared to net worth is considered high, however, Its debt is well covered by operating cash flow (34.8%, greater than 20% of total debt) which is reassuring.


$HUM Breakout to New ATH$HUM Humana broke previous ATH / resistance of $300 earlier today. After what appears to be a successful retest of support, the stock looks ready to continue higher in the near term. Assuming a close >$300 today, price target of $320 by July is possible.


HUM serious resistance here top????HUM tagging resistance on monthly, weekly, and daily time frames. Also, this is perfect point to revert lower based on fib fans.

HUM: Sort OpportunityAn intraday high potential, Back Tested Sort Analysis.
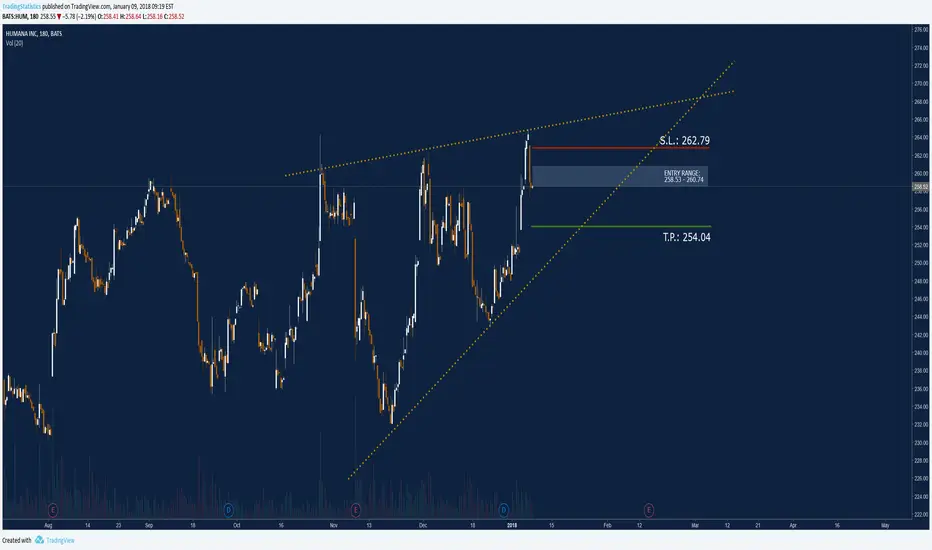
We ll try to enter into the correction of the uptrend movement as below:
Price is likely to move within the triangle having the potential to breaking it down.
Market is currently closed. No market activity presented so far. We ll try to find an entry price between 258.53 - 260.74 just after the opening bell.
DETAILS ON THE CHART
NOTE: Entry range area above the entry point, is calculated upon 80% of the recorded pullback back tested past performances
DISCLAIMER: This is a technical analysis study, not an advice or recommendation to invest money on.


Time For Humana To Naturally Cycle DownHumana Inc has been in a clearly defined bullish trend since July 2016. As of the close on May 15, this stock is at the top of the cycle which is near a strongly established resistance line. The projected future movements are highlighted below.
When we take a look at other technical indicators, the relative strength index (RSI) is at 73.8915. RSI tends to determine trends, overbought and oversold levels as well as likelihood of price swings. I personally use anything above 75 as overbought and anything under 25 as oversold. Currently the RSI is just beginning to exit overbought territory and should encourage the stock to move bearishly down.
The true strength index (TSI) is currently 34.8840. The TSI determines overbought/oversold levels and/or current trend. I solely use this as an indicator of trend as overbought and oversold levels vary. The TSI is double smoothed in its calculation and is a great indicator of upward and downward movement. The current reading declares the stock has been moving up.
The positive vortex indicator (VI) is at 1.2844 and the negative is at 0.7283. When the positive level is higher than 1 and higher than the negative indicator, the overall price action is moving upward. When the negative level is higher than 1 and higher than the positive indicator, the overall price action is moving downward. Currently the positive indicator had been moving up, but the upward action is slowing. The stock should begin to move down and the positive and negative indicators will begin to move closer together.
The stochastic oscillator K value is 85.7857 and D value is 88.5560. This is a cyclical oscillator that is highly accurate and can be used to identify overbought/oversold levels as well as pending reversals and short-term activity. I personally use anything above 80 as overbought and below 20 as oversold. When the K value is higher than the D value, the stock is trending up. When the D value is higher that the K value the stock is trending down. The stochastic is currently in overbought territory and the D is above the K value meaning the stock should begin to fall.
A similar pattern with volume occurred in December 2016. The stock moved up on greater than average volume for 4 days in a row before the stock began to sell off on greater than average volume. The same thing occurred on May 15. During this sell off in December, the stock sold off around 10% over the next 20 trading days. Even though something like this is possible right now, I conservatively believe the stock will hold to its white-dotted trendline which is a drop of at least 4%.
Considering the RSI, TSI, VI and stochastic levels, the overall direction favors a move to the downside, although definitive downward movement may take a few more days to develop. Based on historical movement compared to current levels and the current position, the stock could drop at least 4% over the next 33 trading days if not sooner.
More at LimitLessLifeSkills!

Dark Clouds on Humana's HorizonIt looks like the bull party is approaching to its end and in the stock market, latecomers always suffer the most.
