TRV Pre-Earnings Play: Katy AI Signals Bullish Surge—Don’t Miss TRV Earnings Signal | 2026-01-20
📊 Instrument: TRV
📅 Earnings Date: 2026-01-21
🎯 Trade Type: CALL (LONG)
💵 Entry Price: $7.80–$8.50 (Mid ~$8.15)
🎯 Target 1: $16.30 (≈100% gain)
🎯 Target 2: $20.38 (≈150% gain)
🛑 Stop Loss: $4.08 (≈50% loss)
📏 Position Size: 2% of portfolio
📈 Confidence: 50%
📅 Expiry
Travelers Companies, Inc.
No trades
Next report date
—
Report period
—
EPS estimate
—
Revenue estimate
—
23.80 EUR
5.35 B EUR
41.57 B EUR
222.13 M
About The Travelers Companies, Inc.
Sector
Industry
CEO
Alan D. Schnitzer
Website
Headquarters
New York
Founded
1853
IPO date
Mar 17, 1980
Identifiers
3
ISIN US89417E1091
The Travelers Cos., Inc. is a holding company, which engages in the provision of commercial and personal property and casualty insurance products and services. It operates through the following business segments: Business Insurance, Bond and Specialty Insurance, and Personal Insurance. The Business Insurance segment offers an array of property and casualty insurance, and insurance related services to its customers primarily in the U.S., as well as in Canada, the United Kingdom, the Republic of Ireland and throughout other parts of the world as a corporate member of Lloyd's. The Bond and Specialty Insurance segment includes surety, fidelity, management liability, professional liability, and other property and casualty coverage and related risk management services. The Personal Insurance segment is involved in a range of property and casualty insurance products and services covering individuals' personal risks, primarily in the U.S. and Canada. The company was founded in 1853 and is headquartered in New York, NY.
Related stocks

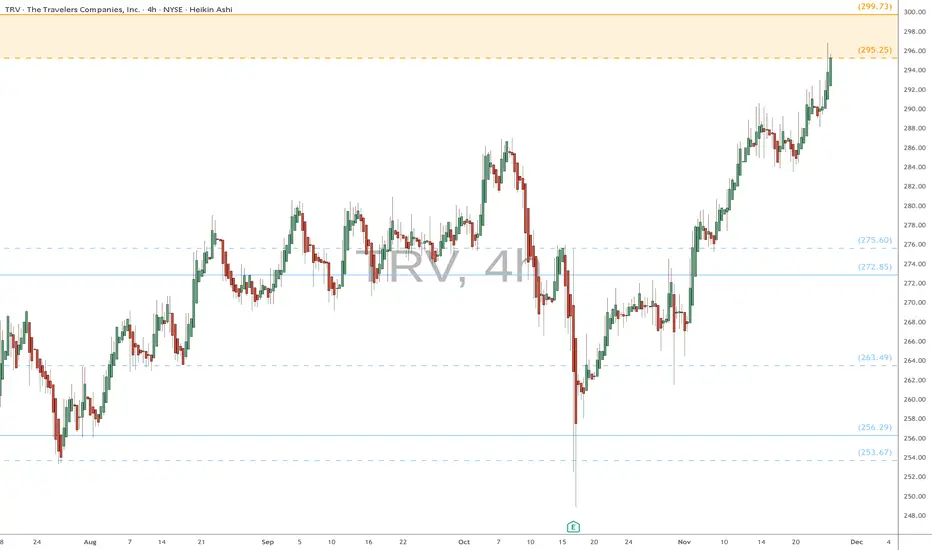
TRV watch $295-299: Double Golden zone likely to CAPTURE priceTRV grinding upward along with entire insurance sector.
It has just hit a Double Golden fib zone at $295.25-299.73
Ultra High Gravity zone should capture price for some time.
.
See "Related Publications" for more examples of Golden Fibs at work ------>>>>>>>
TRV eyes on $265.51: Golden Fib break should run to new ATHTRV has been struggling with a Golden Covid fib at $265.51.
This is a MAJOR landmark. proven by the many rejections.
This break may be the ONE, the one to hit All Time Highs.

Uptrend is still steadyNYSE:TRV Travellers is looking at a continued upside after a mild correction at 27 Nov 24. The double top fails to conclude a 1:1 move and rebounded heavily. Currently, the stock rose above all ichimoku indicators and the stochastic plus the ROC is showing signs of rising bullish momentum.
Hence,

$TRV with a bullish outlook following its earnings #StocksThe PEAD projected a bullish outlook for NYSE:TRV after a positive under reaction following its earnings release placing the stock in drift A with an expected accuracy of 70%.


Travelers: One last climbWe expect Travelers to continue its corrective rise in the form of the magenta wave (B) to just below resistance at $232.75 before a significant sell-off sets in. If, on the other hand, the price were to decline earlier and slip below the support at $200.40, our alternative scenario will come into p

Travelers: On an excursion 🗺️ 🚎The Travelers stock could once again honor its name and undertake a volatile journey. We now locate the stock in the magenta wave (y), which should undercut the support at $157.33 and then bring the superior wave (4) in green to its end. It should be noted that it is also 39% likely that the stock h

📈📊 #ChartPattern Alert! 📈📊 📈 Falling Wedge 📈📈 What is a Falling Wedge? The Falling Wedge is a bullish chart pattern characterized by two converging trendlines, with the lower trendline sloping upward more than the upper trendline. It typically signals a potential bullish reversal, with the price likely to break upward after the wedge pattern.

April Gainers (TRV, account up 1.06%)11th trade in April is NYSE:TRV .
Holding period is 37 days (3/13/23-4/19/23).
Account is up 1.06%.
Total return in April is 3.05%.

See all ideas
Summarizing what the indicators are suggesting.
Neutral
SellBuy
Strong sellStrong buy
Strong sellSellNeutralBuyStrong buy
Neutral
SellBuy
Strong sellStrong buy
Strong sellSellNeutralBuyStrong buy
Neutral
SellBuy
Strong sellStrong buy
Strong sellSellNeutralBuyStrong buy
An aggregate view of professional's ratings.
Neutral
SellBuy
Strong sellStrong buy
Strong sellSellNeutralBuyStrong buy
Neutral
SellBuy
Strong sellStrong buy
Strong sellSellNeutralBuyStrong buy
Neutral
SellBuy
Strong sellStrong buy
Strong sellSellNeutralBuyStrong buy
Displays a symbol's price movements over previous years to identify recurring trends.
TRV3703965
Travelers Insurance Group Holdings, Inc. 7.75% 15-APR-2026Yield to maturity
6.05%
Maturity date
Apr 15, 2026
TRV5197286
Travelers Companies, Inc. 3.05% 08-JUN-2051Yield to maturity
5.58%
Maturity date
Jun 8, 2051
TRV5591548
Travelers Companies, Inc. 5.45% 25-MAY-2053Yield to maturity
5.58%
Maturity date
May 25, 2053
TRV6129558
Travelers Companies, Inc. 5.7% 24-JUL-2055Yield to maturity
5.58%
Maturity date
Jul 24, 2055
PA9B
Travelers Companies, Inc. 4.0% 30-MAY-2047Yield to maturity
5.57%
Maturity date
May 30, 2047
TRV4361013
Travelers Companies, Inc. 3.75% 15-MAY-2046Yield to maturity
5.57%
Maturity date
May 15, 2046
TRV4606502
Travelers Companies, Inc. 4.05% 07-MAR-2048Yield to maturity
5.55%
Maturity date
Mar 7, 2048
TRV4280126
Travelers Companies, Inc. 4.3% 25-AUG-2045Yield to maturity
5.53%
Maturity date
Aug 25, 2045
TRV4979721
Travelers Companies, Inc. 2.55% 27-APR-2050Yield to maturity
5.53%
Maturity date
Apr 27, 2050
TRV4804151
Travelers Companies, Inc. 4.1% 04-MAR-2049Yield to maturity
5.50%
Maturity date
Mar 4, 2049
TRV4034143
Travelers Companies, Inc. 4.6% 01-AUG-2043Yield to maturity
5.41%
Maturity date
Aug 1, 2043
See all PA9 bonds
Frequently Asked Questions
The current price of PA9 is 255.00 EUR — it has increased by 1.88% in the past 24 hours. Watch Travelers Companies, Inc. stock price performance more closely on the chart.
Depending on the exchange, the stock ticker may vary. For instance, on SWB exchange Travelers Companies, Inc. stocks are traded under the ticker PA9.
PA9 stock has risen by 8.67% compared to the previous week, the month change is a 4.26% rise, over the last year Travelers Companies, Inc. has showed a 7.73% increase.
We've gathered analysts' opinions on Travelers Companies, Inc. future price: according to them, PA9 price has a max estimate of 278.50 EUR and a min estimate of 218.58 EUR. Watch PA9 chart and read a more detailed Travelers Companies, Inc. stock forecast: see what analysts think of Travelers Companies, Inc. and suggest that you do with its stocks.
PA9 stock is 0.20% volatile and has beta coefficient of 0.33. Track Travelers Companies, Inc. stock price on the chart and check out the list of the most volatile stocks — is Travelers Companies, Inc. there?
Today Travelers Companies, Inc. has the market capitalization of 55.91 B, it has increased by 1.15% over the last week.
Yes, you can track Travelers Companies, Inc. financials in yearly and quarterly reports right on TradingView.
Travelers Companies, Inc. is going to release the next earnings report on Apr 22, 2026. Keep track of upcoming events with our Earnings Calendar.
PA9 earnings for the last quarter are 9.48 EUR per share, whereas the estimation was 7.49 EUR resulting in a 26.50% surprise. The estimated earnings for the next quarter are 5.80 EUR per share. See more details about Travelers Companies, Inc. earnings.
Travelers Companies, Inc. revenue for the last quarter amounts to 9.24 B EUR, despite the estimated figure of 9.47 B EUR. In the next quarter, revenue is expected to reach 9.38 B EUR.
PA9 net income for the last quarter is 2.13 B EUR, while the quarter before that showed 1.61 B EUR of net income which accounts for 32.08% change. Track more Travelers Companies, Inc. financial stats to get the full picture.
Yes, PA9 dividends are paid quarterly. The last dividend per share was 0.94 EUR. As of today, Dividend Yield (TTM)% is 1.47%. Tracking Travelers Companies, Inc. dividends might help you take more informed decisions.
Travelers Companies, Inc. dividend yield was 1.50% in 2025, and payout ratio reached 15.86%. The year before the numbers were 1.72% and 19.33% correspondingly. See high-dividend stocks and find more opportunities for your portfolio.
As of Feb 6, 2026, the company has 30 K employees. See our rating of the largest employees — is Travelers Companies, Inc. on this list?
Like other stocks, PA9 shares are traded on stock exchanges, e.g. Nasdaq, Nyse, Euronext, and the easiest way to buy them is through an online stock broker. To do this, you need to open an account and follow a broker's procedures, then start trading. You can trade Travelers Companies, Inc. stock right from TradingView charts — choose your broker and connect to your account.
Investing in stocks requires a comprehensive research: you should carefully study all the available data, e.g. company's financials, related news, and its technical analysis. So Travelers Companies, Inc. technincal analysis shows the strong buy rating today, and its 1 week rating is strong buy. Since market conditions are prone to changes, it's worth looking a bit further into the future — according to the 1 month rating Travelers Companies, Inc. stock shows the strong buy signal. See more of Travelers Companies, Inc. technicals for a more comprehensive analysis.
If you're still not sure, try looking for inspiration in our curated watchlists.
If you're still not sure, try looking for inspiration in our curated watchlists.