$PETS - bull pennantsupportive ATR and stochastic and if the price can keep within the pennant, could be a blast out of the bull pennant
PQM trade ideas

Pets buy and sell analisisThis is my analisis for the stock pets on how the stock will move ( for long stock red line is when you want to buy and green line is when you want to sell)
(for short stock green line is when you want to sell and red line is when you want to buy)

A massive short squeeze on PETSShares of PETS were jumping again as a massive short squeeze on consumer stocks continued into its third day.
The squeeze instigated by a group of traders on Gamestop has now spread to other heavily shorted stocks,
There was no news out on any of these three stocks today, and certainly nothing of the kind that would generate this kind of movement for fundamental reasons.
Instead, traders on platforms like Reddit have figured out that they can take advantage of heavily shorted small-cap stocks if enough of them start buying them, and that's what's happened with all three of these stocks. When a stock is shorted and starts to go up, short-sellers eventually have to buy back the shares or risk further losses, including a margin call forcing the repurchase.
Though only about 15% of the float is sold short, traders were aggressive to pump up the stock as daily trading volume rose as high as 358 million shares on Monday, up from around 3 million normally. As of midday today, volume had already topped 200 million.
PetMed Express, an online pet pharmacy, entered the new year with 41% of it stock sold short.
www.fool.com


PETS D1 TF, WILL PRICE BREAK BELOW, WILL PRICE BREAK BELOW 27.72I am looking for a rejection with this pair. price has been ranging for sometime now, as the daily chart shows, price is currently at demand zone with few sellers. it can barely form swing lows. I will wait to see if price would be rejected with some form of candlestick patterns.

$PETS Charting Patterns$PETS
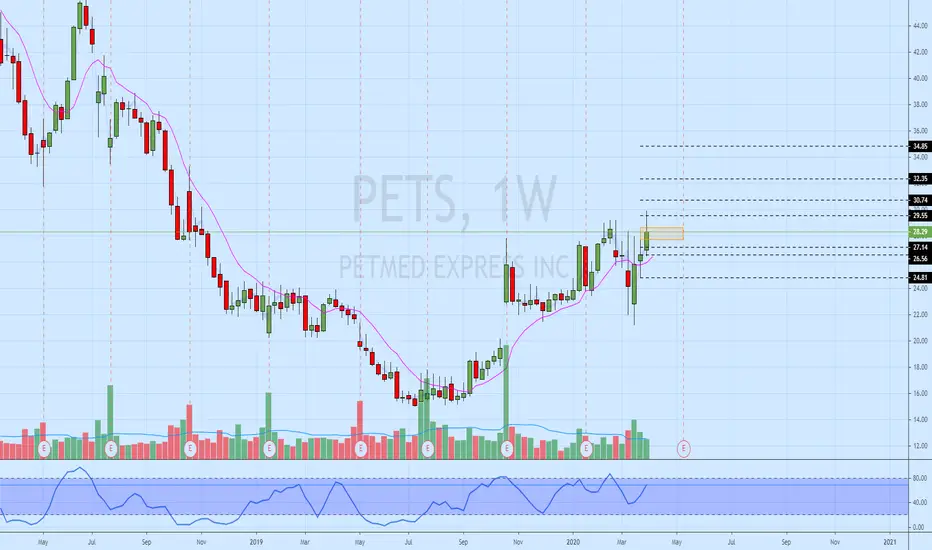
Testing out this theory (2.0). $PETS fib retracement on the weekly chart work with a wave 1 following an ABC chart. Testing the fib timeline tool for wave 2 entry point. Chart seems to show resistance level from the pennant trend and the 200 MA and the fib retracement at $30.92 and a pull back to the zone btw $29.75-$30.20 – seems to be a support level here too for an entry point into wave 3.
“I’m not an expert but I have watched a lot of youtube videos.”
NASDAQ:PETS

PETS downtrend continues, no catalyst for it to break outMACD about to exhaust and CCI pointing down
Two selloffs and each time recovered to 50% fib and get rejected from there.
Volume not good above $30
Near term bearish

$PETS In the groovePetMed Express, an online seller of pet medicine (prescription and non-prescription) is in a hot category with attractive sales and possibly improving earnings. The have a history of disappointing financial reports. But chart-wise, one might consider that good risk/reward as price action attempts to carve a right side of a base. My opinions only. You decide.


$PETS Trendline BreakoutSimple breakout trade. I like $PETS and pets :)
BTO 11/20 $PETS $35c avg $1.70

PETS 1D ASCENDING TRIANGLEAscending Triangles are repeatable trading chart patterns.
Ascending chart patterns will have a directional bias depending on the previous incoming trend.
Each chart pattern will have defining trendlines of the support/resistance levels creating the pattern.
Whatever time frame you are trading this chart pattern, wait for a candle close outside of the trendline in the direction of the breakout candle. (Our time frame preference is the Daily chart).
Add volume indicator - Volume is the amount of $ that went into a particular candle or in Forex the # of trades that took place.
Add ATR indicator - Volatility is the amount of price movement that occurred. Use the ATR to measure the price movement.
When you see descending Volume bars and descending ATR line (which indicates volatility) this shows
a dis-interest in traders to invest in this pair creating consolidation which creates the chart pattern.
Trade Management after there is a breakout candle close.
1 - Position size (compare volume bar to volume ma line).
a - Breakout candle must be 100% of average volume for a full position size.
b - If 75% of average volume then ½ position size. (To find 75% of Volume
look at the charts volume settings – divide smaller # into larger # = 75%+)
2 - Enter two trades.
3 - SL for both trades will be 1.5 x ATR.
4 - 1st trade TP will be 1 x ATR.
5 - No TP on 2nd trade – letting profit run and adjusting SL to follow price.
6 - When 1st TP hit – move 2nd trade SL to breakeven.
7 - Adjust the 2nd trade SL to follow price.
*8 – After Breakout candle – if price closes back into chart pattern close trade
*9 - When breakout candle is more than 1 ATR from breakout candle open.
a - Enter 1st trade at candle close with ½ position size.
b - Enter 2nd trade with a pending limit order that is 1 ATR of breakout candle open.
c – Price should pullback to that pending limit order for 2nd trade.
d – If Price returns back into chart pattern close trade before SL is hit.

PETS Slow and Steady Pullback to BasePETS bouncing off of major support.
PETS may not be as well known as CHWY and CVET, but has been around longer and has pretty stable 3.5% dividend, that the other hot animal care stocks don't have.
The recent sell-off after earnings could be worrisome, but that is because it missed Q1 high expectations by just .01. PETS did pick up over 186000 new customers, which was almost 50000 more than analyst were expecting. Also keep in mind that PETS has a very strong tendency to run up into earnings and sell off for a week after the print no matter how good it was.
Technically, PETS has formed a very nice base / consolidation between $30-$32. This base also corresponds to the rising trend line and channel midpoint.
My plan:
long $31-32
stop 29
first price target $38

SWING PETSPETS at a good price right now. Should bounce off its bottom channel support line. Will look to sell at the indicated sell zone.

PETS BUY , TARGET UP TO $50PETS has completed the asymmetrical Triangle confirmation, aiming to go up to $50.
Price above MA200 supports growth momentum.
PETS buy : $41-41.5
PETS target : $50 +-1
Stop loss : 10%
Wish you good deals!


PETS bullish, test new highsEarnings will be good, more puppies being sold than ever before.
Expect to test new highs.

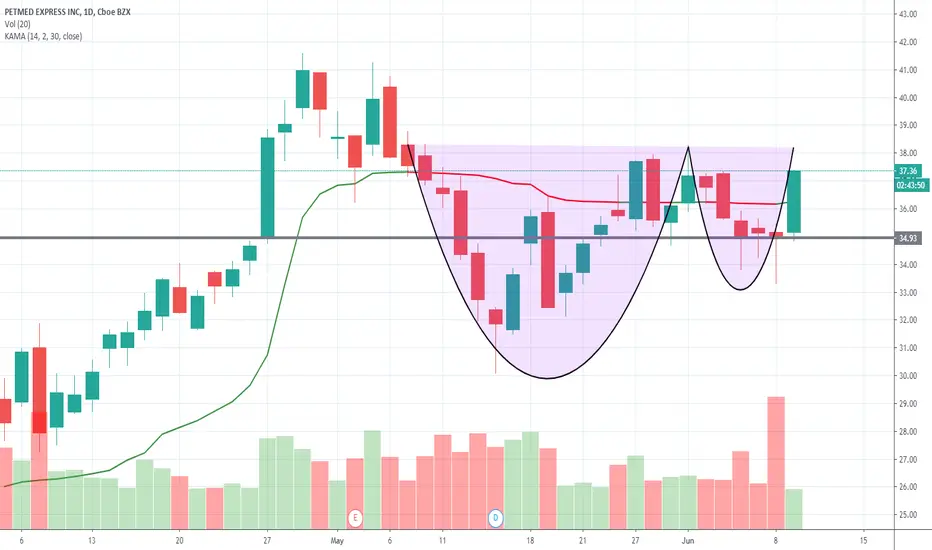
PETS looking better than good!Nice looking chart with the bounce off of support, the crossing of the Kaufman's Adaptive Moving Average (KAMA), and a cup-n-handle breakout in the likely near future.

PETMED EXPRESS $PETS is bouncingAfter it found its support at 50SMA, today there is a bullish signal with high volume.
If you find my charts useful, please leave me "like"
thx


P'ETS Strong yesterdayPETS might get a pop going into earnings. Entry above box. Would take quick profits on this one.
Would not hold through earnings. Lower targets could be shorted to or used as pull back entries.

PETS Like it long above the box and short below.I am long biased on this one but happy to take it long above the box or short below. Targets are the black dotted lines.
Trade Journal - Long $PETS - First Flag - 2/20/20Trying going long PETS again since stopping out last week. PETS has been within a beautiful consolidation pattern right above the Cup & Handle breakout pattern on the daily chart. PETS is holding the 20DMA and is coiling tightly at highs. I entered within the consolidation as PETS sprung from the support this morning and back near the breakout zone.
Entry - 28.41
Stop Loss - 27.40
Target - 33.00
