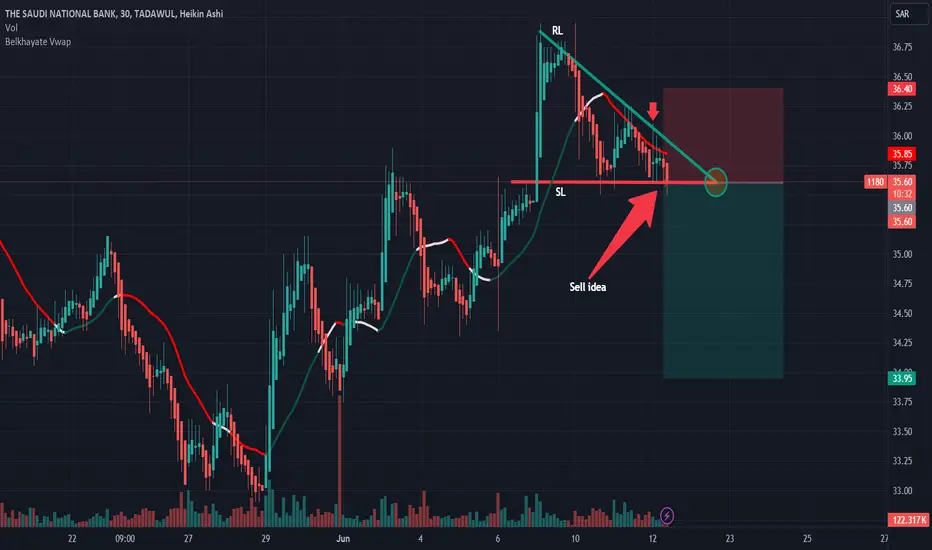
1180: Sell ideaWe would have a high probability of having a downtrend however if the support line is broken forcefully by a large red candle accompanied by large red volume.
Next report date
—
Report period
—
EPS estimate
—
Revenue estimate
—
3.35SAR
20.01 BSAR
59.72 BSAR
3.74 B
About THE SAUDI NATIONAL BANK
Sector
Industry
CEO
Talal Ahmed Al-Khereiji
Website
Headquarters
Riyadh
Employees (FY)
16.08 K
Founded
1953
ISIN
SA13L050IE10
FIGI
BBG0069P8N84
Saudi National Bank engages in the provision of banking and investment management services. It operates through the following segments: Retail, Wholesale, Capital Market, and International. The Retail segment offers banking services, including lending and current accounts. The Wholesale segment provides conventional credit-related products, financing products, and treasury and correspondent banking products and services, including money market and foreign exchange. The Capital Market segment provides wealth management, asset management, investment banking, and shares brokerage services. The International segment includes banking services provided outside Saudi Arabia. The company was founded on December 26, 1953 and is headquartered in Jeddah, Saudi Arabia.
Alahli Bank to all time high as you see in the chart everything is clear
i hoop to activate the SL NO jokes with STOP LOSE
we will change the SL soon when we get some confirmation in the chart.
GOOD LUCK & TRADE SAFELY

1180: Buy ideaOn 1180 as you see on the chart we will have a big probability to have an uptrend if only if we have the breakout with force the vwap and the resistance line by a big green candle follow by a large green volume.Thanks!
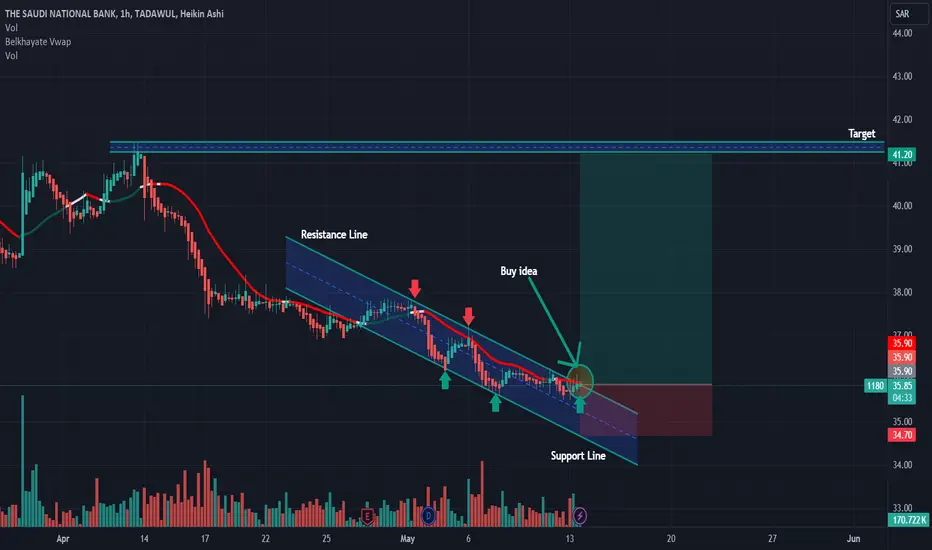
1180 | Flag Pattern & Bullish DivergenceSaudi National Bank displays a promising bullish reversal pattern characterized by the formation of bullish flag pattern and divergence with RSI. Our plan entails accumulating the stock within the designated buy zone (37.50-37.70 range), while setting stop loss orders below the bottom of support aro
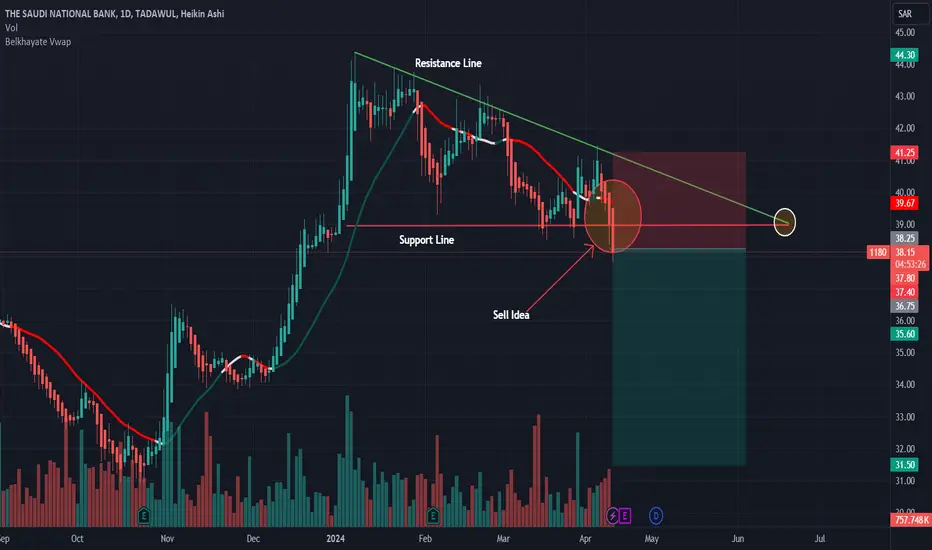
1180: Sell ideaSell idea on 1180 as you see on the chart because we have the breakout with force the vwap indicator and also the breakout with force the support line.Thanks!
#NSB_1180I expect, and God knows best, that it will be a model of the Wolfe wave as shown in the drawing, and I do not bear responsibility for anyone’s purchase.

The Saudi national bank The stock price now stands at important resistance level. What I can see is the tread is upward and the money still in. For me 48 is a just a matter of time.
Dr SAUD

1180, Saudi National BankSaudi National Bank, 1180
Symmetrical triangle
Levels to watch for:
R: 42.80
S:39.05
Next target 44.25 then 45.40
Good luck!

analysis of 1180analysis of 1180 in saudia market
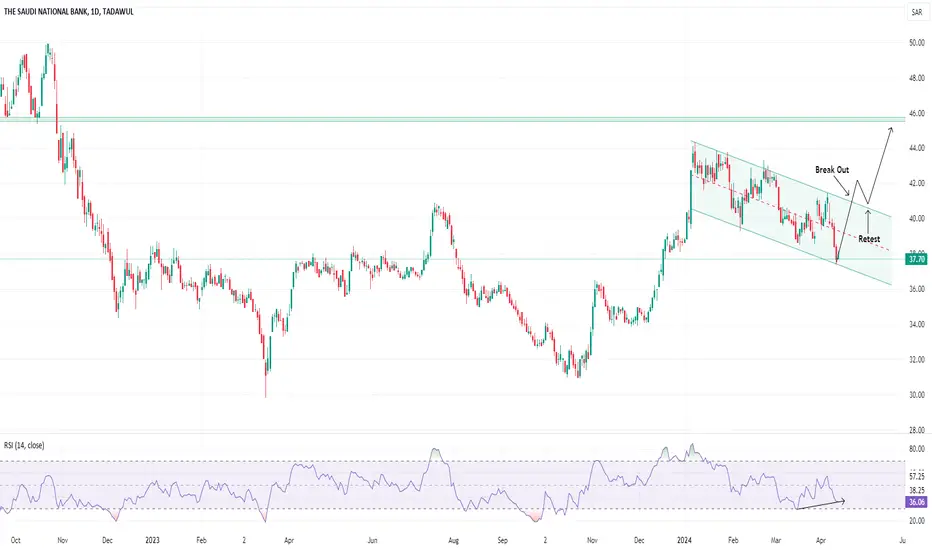
the major trend is uptrend
watch the video and comment us if there is any thing missing


See all ideas
An aggregate view of professional's ratings.
Trade directly on the supercharts through our supported, fully-verified and user-reviewed brokers.


Curated watchlists where 1180 is featured.

Frequently Asked Questions
The current price of 1180 is 37.10 SAR — it has decreased by 1.07% in the past 24 hours. Watch THE SAUDI NATIONAL BANK stock price performance more closely on the chart.
Depending on the exchange, the stock ticker may vary. For instance, on TADAWUL exchange THE SAUDI NATIONAL BANK stocks are traded under the ticker 1180.
1180 stock has fallen by 1.85% compared to the previous week, the month change is a 2.20% rise, over the last year THE SAUDI NATIONAL BANK has showed a 7.94% decrease.
We've gathered analysts' opinions on THE SAUDI NATIONAL BANK future price: according to them, 1180 price has a max estimate of 55.00 SAR and a min estimate of 40.40 SAR. Watch 1180 chart and read a more detailed THE SAUDI NATIONAL BANK stock forecast: see what analysts think of THE SAUDI NATIONAL BANK and suggest that you do with its stocks.
1180 reached its all-time high on May 8, 2022 with the price of 61.50 SAR, and its all-time low was 16.00 SAR and was reached on Sep 29, 2016. View more price dynamics on 1180 chart.
See other stocks reaching their highest and lowest prices.
See other stocks reaching their highest and lowest prices.
1180 stock is 1.63% volatile and has beta coefficient of 1.34. Track THE SAUDI NATIONAL BANK stock price on the chart and check out the list of the most volatile stocks — is THE SAUDI NATIONAL BANK there?
Today THE SAUDI NATIONAL BANK has the market capitalization of 220.56 B, it has decreased by 0.53% over the last week.
Yes, you can track THE SAUDI NATIONAL BANK financials in yearly and quarterly reports right on TradingView.
THE SAUDI NATIONAL BANK is going to release the next earnings report on Jul 26, 2024. Keep track of upcoming events with our Earnings Calendar.
1180 earnings for the last quarter are 0.82 SAR per share, whereas the estimation was 0.81 SAR resulting in a 0.42% surprise. The estimated earnings for the next quarter are 0.80 SAR per share. See more details about THE SAUDI NATIONAL BANK earnings.
THE SAUDI NATIONAL BANK revenue for the last quarter amounts to 8.94 B SAR, despite the estimated figure of 8.96 B SAR. In the next quarter, revenue is expected to reach 9.13 B SAR.
1180 net income for the last quarter is 5.04 B SAR, while the quarter before that showed 4.96 B SAR of net income which accounts for 1.54% change. Track more THE SAUDI NATIONAL BANK financial stats to get the full picture.
THE SAUDI NATIONAL BANK dividend yield was 4.52% in 2023, and payout ratio reached 52.02%. The year before the numbers were 3.37% and 54.41% correspondingly. See high-dividend stocks and find more opportunities for your portfolio.
As of Jul 27, 2024, the company has 16.08 K employees. See our rating of the largest employees — is THE SAUDI NATIONAL BANK on this list?
Like other stocks, 1180 shares are traded on stock exchanges, e.g. Nasdaq, Nyse, Euronext, and the easiest way to buy them is through an online stock broker. To do this, you need to open an account and follow a broker's procedures, then start trading. You can trade THE SAUDI NATIONAL BANK stock right from TradingView charts — choose your broker and connect to your account.
Investing in stocks requires a comprehensive research: you should carefully study all the available data, e.g. company's financials, related news, and its technical analysis. So THE SAUDI NATIONAL BANK technincal analysis shows the neutral today, and its 1 week rating is sell. Since market conditions are prone to changes, it's worth looking a bit further into the future — according to the 1 month rating THE SAUDI NATIONAL BANK stock shows the neutral signal. See more of THE SAUDI NATIONAL BANK technicals for a more comprehensive analysis.
If you're still not sure, try looking for inspiration in our curated watchlists.
If you're still not sure, try looking for inspiration in our curated watchlists.