Skittish marketThe structure in the daily chart of the S&P 500 implies a skittish market that is moving on concerns that fundamental reality. Therefore I am not looking for a big move down on Friday but rather a rest day and inside day as we go into the weekend.
Trade ideas

ES Supply-Demand Long TradeTook a small position on buying the ES 15-minute level of demand.
Technicals = bullish/ mixed depending on outlook
Fundamentals = bullish
Sentiment = mixed
FED/News will impact this event.

ES - November 20th - Daily Trade PlanNovember 20th- Daily Trade Plan - 9:05am
*Before reading this trade plan, IF, you did not read yesterdays, or the Weekly Trade Plan take the time to read it first! (You can see both posts in the related publication section) *
If my posts provide quality information that has helped you with your trading journey. Feel free to boost it for others to find and learn, also!
My daily trade plan and real-time notes that I post are intended for myself to easily be able to go back and review my plan and how I did from an execution perspective.
--------------------------------------------------------------------------------------------------------
Quick Recap of Yesterday -
6635 has been the Bull/Bear Line this week and Institutions were accumulating below this level, and price broke out of the 6684-6595 range that has been building all week. This was a very structured Institutional accumulation event this week. You can see the 15 min chart had lower lows, lower highs until Tuesday when we put in the weekly low at 6595 and this was a lot of daily and weekly lows that were the confluence needed for Institutions to accumulate. We started to make higher highs, higher lows Wednesday and 6635 was that key level all week to take us higher. Since we have broken higher and above 6708, price should not lose 6684 on any back test this week.
--------------------------------------------------------------------------------------------------------
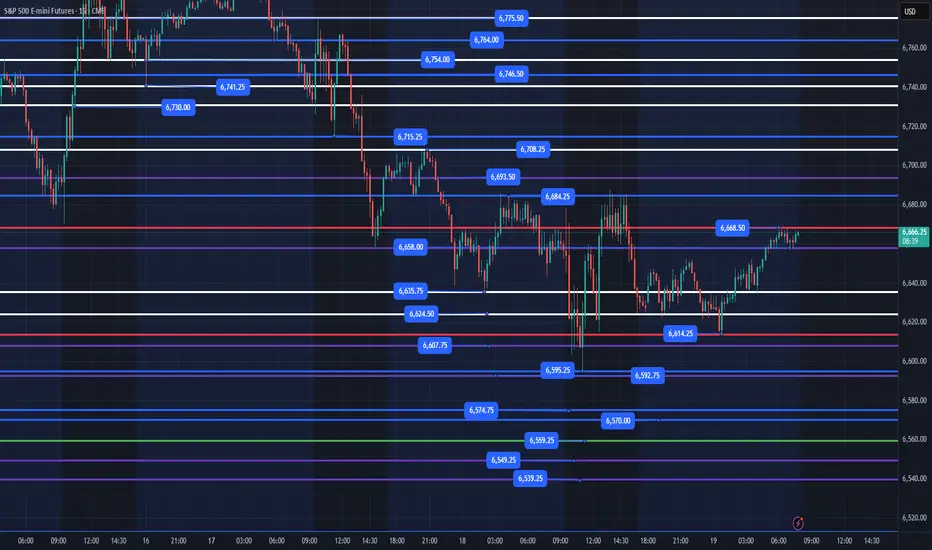
Overnight Low is 6694 and Overnight High is 6764 (As I am typing this). We built a nice flag between 6725 - 6757 range and then popped above that range and are looking for higher prices.
We are in a bit of a tough range at the moment, and we need a pullback for me to find a place to enter. The very microstructure is the back test of 6757 (Which we already had but is good reference) IF I had posted this earlier, we would have been looking for loss of 6725 and recovery to go higher. The other option IF missed is the clearance of 6757 (Overnight high) and back test, which we cleared to 6766 and then built a nice flag around 6752-55 and then continued higher. I write this so that you can review and see how price acts when you get a quick pop like we did and what it should do to continue higher. IF we had popped and then could not hold 6755 area, it would have sold off further.
Key Levels Today
1. 6757 - Flush and reclaim of the overnight high that broke out at 8:30am
2. 6725 - This would be a micro shelf that if we lose and recover could give us some points.
2. 6708 - Flush and reclaim
3. 6694 - Flush and reclaim
4. 6658 - Flush and reclaim
The highest quality is going to be 6614, 6624, 6635 flush and reclaims.
Price can reach 6775-85 area that will be a good resistance level. As I have said many times, when price rallies like it has before the NYSE Open, it could be a trap, and Institutions could start selling around the 6775-85 area. We will need to see what price does in the first hour. Unfortunately, I need a pullback to find an entry as I have missed them this am. Any flush and reclaim of 6757 should be a good spot, even if it flushes down to 6737 area and recovers.
I will post an update around 10am EST
----------------------------------------------------------------------------------------------------------------
Couple of things about how I color code my levels.
1. Purple shows the weekly Low
2. Red shows the current overnight session High/Low (time of post)
3. Blue shows the previous day's session Low (also other previous day's lows)
4. Yellow Levels are levels that show support and resistance levels of interest.
5. White Levels are previous day's session High/Low

ES - November 19th - Daily Trade PlanNovember 19th- Daily Trade Plan - 7:50am
*Before reading this trade plan, IF, you did not read yesterdays, or the Weekly Trade Plan take the time to read it first! (You can see both posts in the related publication section) *
If my posts provide quality information that has helped you with your trading journey. Feel free to boost it for others to find and learn, also!
My daily trade plan and real-time notes that I post are intended for myself to easily be able to go back and review my plan and how I did from an execution perspective.
--------------------------------------------------------------------------------------------------------
Quick recap of yesterday - Loss of 6635 and reclaim
We lost 6635 at the open and it was a pretty big solid red candle. We then had buyers' step in around 6603 and we had a battle between 6603-6635. We never reclaimed the 6635 level until 11:30am (15 min) candle and that was a great flush below 6603 and reclaim and that was the entry as we can see that price lost a key level (In this case it was weekly and session low) that when reclaimed rallied and you could have entered at any of the key levels above to rally into the 6684 resistance.
---------------------------------------------------------------------------------------------------------
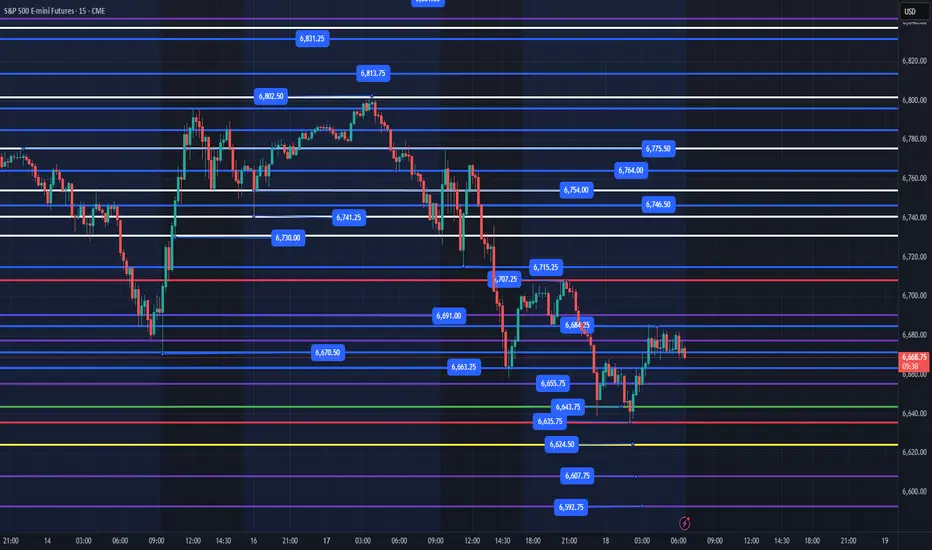
Overnight low is 6614 and overnight high is 6668. As I type this trade plan, price is coming into the 6668 level and is trying to stay above 6658. This should be pretty straightforward today.
Key Levels Today
1. 6614 - We should get one more flush and reclaim of this level before we have to retest yesterday's low at 6595.
2. 6635 - This is the Bull/Bear line in this choppy range between 6684 - 6595. IF we can lose this level and reclaim it should be good for a bounce.
3. 6607 - Any loss and recovery of this level should give us some points.
4. 6595 - Highest Quality level that a loss down to 6581 and recovery should be a good level for points.
Below there and we do not have much of interest until 6570 with 6550 & 6539 the highest quality levels to engage in.
NVIDIA earnings are out after the bell, and my general lean is that price will not do too much today and should continue to chop in this range and overnight could have a sell off down to the 6540 level and then rally and put in the weekly low tomorrow. (This is not information I am trading on, just an observation of how price could react). I will be trading only the flush and reclaim of the levels I have outlined. Remember, we have Thanksgiving next week and I would not be surprised if price tests the 6540 level by Friday and we rally end of the week as retail and sentiment becomes more bearish.
I will post an update around 10am EST
----------------------------------------------------------------------------------------------------------------
Couple of things about how I color code my levels.
1. Purple shows the weekly Low
2. Red shows the current overnight session High/Low (time of post)
3. Blue shows the previous day's session Low (also other previous day's lows)
4. Yellow Levels are levels that show support and resistance levels of interest.
5. White Levels are previous day's session High/Low
S&P 500 E-mini Futures: Short Target Achieved, Long Setup 21.Nov
S&P 500 E-mini Futures: Short Target Achieved, Long Setup in Play
Today’s session on the S&P 500 E-mini Futures (ES) presented a textbook example of how patience and planning pay off in intraday trading. Let’s break down the trade idea, execution, and the next steps.
Market Context
Instrument: S&P 500 E-mini Futures (ESZ2025)
Current Price: 6,547.25 (-0.16%)
Timeframe: 15-minute chart
Session Behavior: After an initial push higher, the market showed signs of exhaustion near the previous high, creating an opportunity for a short scalp before considering a long re-entry.
Trade Recap: Short Position
Earlier today, a short position was initiated near the supply zone (highlighted in red on the chart) around 6,594.50, targeting a retracement toward the mid-range.
Entry: Around 6,594.50
Target: 6,532.25 (achieved successfully)
Reasoning: Price rejected the upper liquidity zone, forming lower highs and signaling a short-term bearish move. Volume spikes confirmed selling pressure.
This short trade hit its target cleanly, validating the setup and risk management.
Current Setup: Long Bias
With the short target achieved, the focus now shifts to a long re-entry. Here’s why:
Demand Zone: Price reacted strongly near 6,532.25, sweeping liquidity and bouncing back.
Volume Profile: Notice the spike in buying volume at the lows, suggesting accumulation.
Structure: The market is forming a higher low on the 15-minute chart, indicating potential bullish continuation.
Long Plan
Entry Zone: Between 6,532.25 and 6,528.25 (green zone)
Stop Loss: Below 6,523.25 (to protect against deeper liquidity sweep)
Target: Sweep of the day’s high near 6,604.75 or equal highs at 6,594.50 for partials.
Key Observations
Liquidity Sweep: The wick below 6,532.25 suggests stop hunts before reversal.
Risk-to-Reward: Favorable setup with tight stop and clear upside targets.
Market Sentiment: Despite intraday volatility, the broader trend remains bullish, supporting the long bias.
Conclusion
The short scalp was a success, and now the market offers a compelling long opportunity. Traders should monitor price action closely around the demand zone and manage risk diligently. If the bullish momentum holds, a sweep of the day’s high is likely.
✅ Pro Tip: Always wait for confirmation before entering a reversal trade. Volume and price structure are your best friends in identifying genuine shifts in momentum.
Do your own analysis before taking any decisions these are only my way of looking at the market today and valid for today only

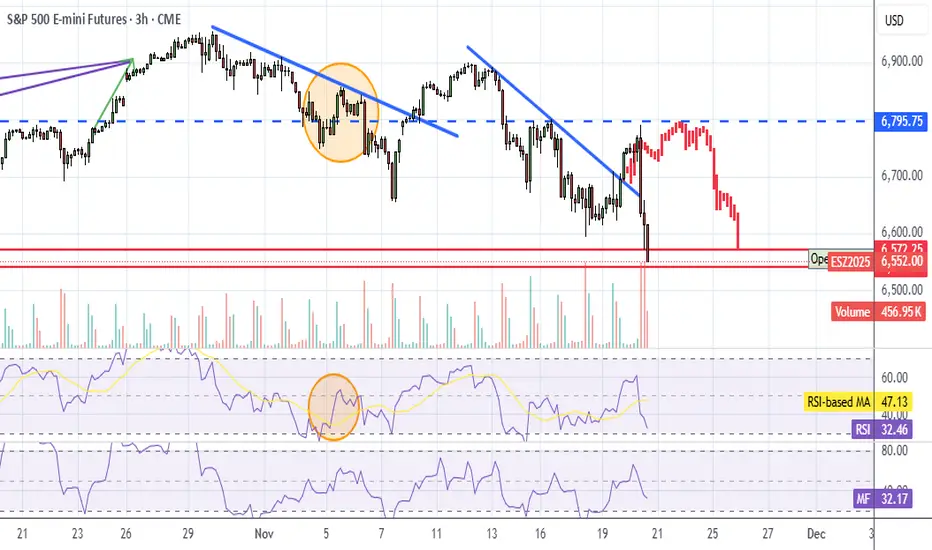
S&P 500: At a Technical CrossroadsThe S&P 500 index (the S&P 500 futures contract in this analysis) is currently at a decisive technical inflection point. After several months of sustained progress since the March/April decline, prices are now retesting a key area where several dynamic supports converge: the daily Ichimoku cloud, the 50-day moving average (SMA 50) and, lower down, the 200-day moving average (SMA 200), which meets the former all-time high of 6,150 points. This confluence of indicators makes the current period a true moment of technical truth for the U.S. equity market and the GAFAM stocks.
The first element to monitor is the holding of the Ichimoku cloud on the daily timeframe, which has so far acted as a support zone during consolidations. A clear break below this structure would be significant: it would indicate the loss of medium-term bullish momentum and open the door to a deeper correction, similar to the technical scenario that occurred at the end of last February.
In the event of a breakdown, a pullback toward 6,200 points appears plausible. This corresponds to the area of the former all-time high of the S&P 500 — now a major support — and represents the most coherent technical pivot for a correction lasting several sessions. At this stage, this support has not been broken, so its breach should not be anticipated; only the daily close matters.
The current configuration is also accompanied by weakening momentum indicators: the Relative Strength Index (RSI) has been declining for several weeks, confirming a classic bearish divergence at the end of a trend.
All this occurs in a context of very high valuations for the S&P 500, with multiples leaving little room for error and making the index more vulnerable to technical adjustments. When fundamentals are stretched, chart levels play a pivotal role: a bearish technical signal can trigger a rapid realignment of prices toward more fundamentally sustainable levels.
For now, buyers remain in control as long as the price stays above the cloud and the SMA 50. But the zone being tested right now potentially represents the last line of defense before a more pronounced correction.
The market is therefore truly at a crossroads: either a valid rebound resumes the bullish trend, or a breakdown opens the way for a return toward 6,200 points, a major level for the underlying long-term uptrend.
DISCLAIMER:
This content is intended for individuals who are familiar with financial markets and instruments and is for information purposes only. The presented idea (including market commentary, market data and observations) is not a work product of any research department of Swissquote or its affiliates. This material is intended to highlight market action and does not constitute investment, legal or tax advice. If you are a retail investor or lack experience in trading complex financial products, it is advisable to seek professional advice from licensed advisor before making any financial decisions.
This content is not intended to manipulate the market or encourage any specific financial behavior.
Swissquote makes no representation or warranty as to the quality, completeness, accuracy, comprehensiveness or non-infringement of such content. The views expressed are those of the consultant and are provided for educational purposes only. Any information provided relating to a product or market should not be construed as recommending an investment strategy or transaction. Past performance is not a guarantee of future results.
Swissquote and its employees and representatives shall in no event be held liable for any damages or losses arising directly or indirectly from decisions made on the basis of this content.
The use of any third-party brands or trademarks is for information only and does not imply endorsement by Swissquote, or that the trademark owner has authorised Swissquote to promote its products or services.
Swissquote is the marketing brand for the activities of Swissquote Bank Ltd (Switzerland) regulated by FINMA, Swissquote Capital Markets Limited regulated by CySEC (Cyprus), Swissquote Bank Europe SA (Luxembourg) regulated by the CSSF, Swissquote Ltd (UK) regulated by the FCA, Swissquote Financial Services (Malta) Ltd regulated by the Malta Financial Services Authority, Swissquote MEA Ltd. (UAE) regulated by the Dubai Financial Services Authority, Swissquote Pte Ltd (Singapore) regulated by the Monetary Authority of Singapore, Swissquote Asia Limited (Hong Kong) licensed by the Hong Kong Securities and Futures Commission (SFC) and Swissquote South Africa (Pty) Ltd supervised by the FSCA.
Products and services of Swissquote are only intended for those permitted to receive them under local law.
All investments carry a degree of risk. The risk of loss in trading or holding financial instruments can be substantial. The value of financial instruments, including but not limited to stocks, bonds, cryptocurrencies, and other assets, can fluctuate both upwards and downwards. There is a significant risk of financial loss when buying, selling, holding, staking, or investing in these instruments. SQBE makes no recommendations regarding any specific investment, transaction, or the use of any particular investment strategy.
CFDs are complex instruments and come with a high risk of losing money rapidly due to leverage. The vast majority of retail client accounts suffer capital losses when trading in CFDs. You should consider whether you understand how CFDs work and whether you can afford to take the high risk of losing your money.
Digital Assets are unregulated in most countries and consumer protection rules may not apply. As highly volatile speculative investments, Digital Assets are not suitable for investors without a high-risk tolerance. Make sure you understand each Digital Asset before you trade.
Cryptocurrencies are not considered legal tender in some jurisdictions and are subject to regulatory uncertainties.
The use of Internet-based systems can involve high risks, including, but not limited to, fraud, cyber-attacks, network and communication failures, as well as identity theft and phishing attacks related to crypto-assets.

ES UpdateQuite the pump on NVDA earnings especially considering the stock is up only 5% AH.
Appears the algos are on and pumping, so I expect to go overbought, but that depends on jobs report (Sept data) and Fed meeting minutes tomorrow.
I'm guessing we get a 3 day rally like the last pump (overlay is the early Nov pump), then the selloff resumes next Tuesday. There is a potential of a Thanksgiving holiday melt up though.
I think I'll wait until the Fed meeting minutes before deciding what to do. No positions, I dumped my GM calls this morning. Did not enter into any trades, because of NVDA, jobs report, and Fed minutes.

ES UpdateWow. Just Wow.
I left my overlay on there so you can see that it was correct other than the fact that the market did an entire week's worth of movement in just 24 hours, both up, whipsaw, and down.
I made some money shorting stuff today, but not as much as I should have because I didn't expect the full movement in one day. Closed out my puts way too early.
Holding next week's XLF puts because of a H&S pattern. No other positions, tomorrow will probably look a lot like last Friday because the market will be oversold. Be careful what you go long on, and I'm not sure about Monday direction.
Day 74 — Surviving a 242-Point Crash MoveEnded the day +$450.40 trading S&P Futures, but I’m walking away feeling tilted despite the profit. We sniped the 48-minute MOB resistance right out of the gate—just as planned in last night’s video—but I never expected the market to flush 242 points from top to bottom. That is a "market crash" level move. My P/L was a complete rollercoaster, swinging from +$400 to negative and back again. I’m grateful to end green, but after a session this volatile, I’m likely locking my account and taking a mental break tomorrow.
🔑 Key Levels for Tomorrow
Above 6725 = Bullish Below 6710 = Bearish
📰 News Highlights
BITCOIN FALLS 3% TO $87,000, LOWEST SINCE APRIL

S&P 500 Sell Decent zone on lower timeframe to sell. Current Month VPOC, Failure to go higher with Intraday range. Good zone to take short.

Sellers profit-taking or new buyers entering the marketThe shadow at the low of the daily price structure for Tuesday in the S&P 500 implies two possibilities sellers may have pushed the market low enough that some people are taking profits a second possibility is the market's gotten cheap enough that new buyers are establishing positions. The price action on Wednesday may give us answers depending on follow through from buyers in the market.

ES – Testing Major Resistance? Nov. 20 Trade Plan1-Hour Outlook (Main Bias)
ES just broke out of a multi-day downtrend and is now pushing directly into the key 6745–6760 resistance shelf — the same zone that rejected twice earlier in the week.
1H Structure
* Clean breakout above the descending trendline.
* A confirmed BOS shifted the 1-hour structure bullish.
* Price is now consolidating right under the 6760 zone.
* Momentum is strong, but candles are slowing near resistance.
* MACD on 1H is bullish and rising.
* Stochastic is elevated and starting to flatten, but not rolling over yet.
1H Key Levels
Breakout trigger: above 6760–6770
Upside targets:
* 6801 (GEX resistance + prior supply)
* 6820 (2nd call wall / gamma magnet)
Support zone: 6680–6700
Bears take control only below: 6625
1H Trading Idea
Bullish scenario:
If ES holds 6700–6710 and reclaims 6745 with strength, a breakout through 6760 is very possible, opening a move toward 6800–6820.
Bearish scenario:
Only valid if ES rejects 6760 with a strong reversal candle. Downside magnets sit at:
6705 → 6680 → 6625
15-Minute Outlook (Execution Timeframe)
The 15M chart shows a strong impulsive rally followed by sideways absorption under resistance — not distribution yet.
15M Structure
* CHoCH → BOS → continuation move.
* Price retested the FVG zone and bounced cleanly.
* EMAs on 15M remain stacked bullish.
* Consolidation range is tight, signaling compression before expansion.
15M Trading Setups
Bullish entry:
6730–6740 ideal retrace zone.
Look for bullish engulfing or long-wick rejection.
Targets:
6760 → 6800
Stop: below 6715
Breakout entry:
If ES breaks 6760 cleanly with volume:
Stop: below last 15M swing low
Targets: 6801 → 6820
Bearish scalp:
Only if ES rejects 6760 multiple times.
First target: 6705
Second target: 6680
GEX Confirmation
Based on your GEX chart:
Bullish Signals
* Highest positive NETGEX sits near 6801, a natural gamma magnet.
* Significant call walls at 6760, 6800, 6820 — supporting upward drift.
* Positive GEX zones (GEX8/9) favor upside continuation.
* Minimal put defense above current price.
Bearish GEX Levels
* Strong PUT walls at 6680–6625, acting as downside magnets only if price breaks under support.
Interpretation
GEX favors a slow grind upward.
A clean break above 6760 likely accelerates hedging flows toward 6800–6820.
Options Trading Plan (GEX-Based)
Bullish Plan
If ES breaks above 6760 with momentum:
Contracts to consider:
* ES 6750C
* ES 6800C
Targets:
6801 → 6820
Reason:
Crossing 6760 forces dealers to hedge upward, creating a gamma push.
Bearish Plan
Only if ES rejects 6760:
Contracts:
* ES 6700P
* ES 6650P
Targets:
6705 → 6680 → 6625
Reason:
Below 6700, GEX turns neutral and the path opens toward put-heavy zones.
Final Bias for Nov. 20
ES has a bullish market structure and sits right under resistance.
A breakout through 6760 opens the door toward 6800–6820.
Bearish scenarios only gain momentum if price falls back below 6700 and especially under 6680.
Disclaimer
This analysis is for educational purposes only and not financial advice. Always do independent research and manage risk properly.

Day 73 — Perfect Rejection at the 2-Hour MOB | S&P Futures TradiEnded the day +$529.40 trading S&P Futures. Today was a solid bounce back, with the morning analysis playing out almost perfectly. I managed to catch the top of the day and ride the momentum down right as we rejected the 2-hour MOB. It felt good to be in sync with the market structure, especially with the volatility leading up to the Nvidia earnings release. The signals were clean, the execution was sharp, and it was just one of those days where the plan came together.
🔑 Key Levels for Tomorrow
Above 6725 = Bullish Below 6710 = Bearish
📰 News Highlights
NVIDIA SHARES JUMP 5% AFTER 4Q REVENUE OUTLOOK TOPS ESTIMATE

ES week 47 (1hr chart)T.A explained -
BackSide (BS)
FrontSide (FS)
Inverse BS (Inv.BS)
Inverse FS (Inv.FS)
BS & FS levels are expected support when dashed lines, tested when dotted and resistance when solid lines.
The inverse is true for the Inv. BS Inv. FS levels, they are resistance as dashed lines, tested as dotted and support as solid lines.
Monthly timeframe is color pink
weekly grey
daily is red
4hr is orange
1hr is yellow
15min is blue
5min is green if they are shown.
strength favors the higher timeframe.
2x dotted levels are origin levels where trends have or will originate. When trends break, price will target the origin of the trend. its math, when the trend breaks, the vertex breaks too so the higher timeframe level/trend that breaks, the more volatility there could be as strength in the orders flow in to fuel the move.

ES - November 18th - Daily Trade PlanNovember 18th- Daily Trade Plan - 6:30am
*Before reading this trade plan, IF, you did not read yesterdays, or the Weekly Trade Plan take the time to read it first! (You can see both posts in the related publication section) *
If my posts provide quality information that has helped you with your trading journey. Feel free to boost it for others to find and learn, also!
My daily trade plan and real-time notes that I post are intended for myself to easily be able to go back and review my plan and how I did from an execution perspective.
--------------------------------------------------------------------------------------------------------
Yesterday, we had good reactions at our key levels. Price ultimately went lower into the last hour of trading, and we got a nice, failed breakdown of 6670 that rallied into the close to finish of the day. You can review yesterday's plan and price action by viewing the post in the related publication section.
Today we have a pretty straightforward plan that I will go over below!
Our overnight high was 6707 (Right below our 6713 level from yesterday). Our overnight low was 6635 which we put in a nice, failed breakdown of 6643. This pattern of price losing a low, then quickly reclaiming that low is a pattern we will continue to see in a volatile and downward trending market. Price is building a really nice base between 6667 and 6684. I anticipate this will continue higher and retest the overnight high of 6707. Any reclaim of 6684 on a back test should give us a good entry or a flush of 6663 and reclaim would take us higher, also. Until price can clear 6715, price is still in a lower high, lower low trend!
Key Levels Today -
1. Loss of 6663 and reclaim
2. Loss of 6635 and reclaim
3. Reclaim of 6684 with a back test of this level for possible entry.
Below we have 6624 and some past weekly levels of 6607, 6592. These levels will be key and the flush of one of them and reclaim should keep us moving higher. The safer place to enter is to wait for it to clear the level from above, back test that level and then enter.
We have Thanksgiving next week and I would not be surprised if price tests the 6540 level by Friday and we rally end of the week as retail and sentiment becomes more bearish.
I will post an update around 10am EST
----------------------------------------------------------------------------------------------------------------
Couple of things about how I color code my levels.
1. Purple shows the weekly Low
2. Red shows the current overnight session High/Low (time of post)
3. Blue shows the previous day's session Low (also other previous day's lows)
4. Yellow Levels are levels that show support and resistance levels of interest.
5. White Levels are previous day's session High/Low
Day 72 — AI Bubble Fears Hit the Market | S&P Futures RecapStarting to get a bit worried about the stock market. Everything feels tied to NVDA earnings this week, and we’re starting to lose major support levels across multiple timeframes. I took a few losses overnight, so I went into the morning a bit more hesitant and wanted to wait until the market slowed down before committing.
I made some small profits trading off Bia's order and took a few scalp trades off the 1-minute MOB, which helped stabilize the day. This wasn’t a high-conviction environment for me, so I stayed defensive and focused on execution.
📈 Key Levels for Tomorrow
🔼 Bullish Above: 6725
🔽 Bearish Below: 6710
These are the two main pivot levels I’m watching.
Above 6725 we may see buyers regain control.
Below 6710 the bearish wave accelerates.

Catch its breathThe expectation for the S&P 500 daily chart on Tuesday is a market that will catch his breath. This implies an Tuesday trading inside Monday's range.

Survived a Market Selloff | +$241 Trading S&P Futures (Day 71)Ended the day +$241 trading S&P Futures, but it didn’t come easy.
The market started off range-bound, and I traded the highs and lows cleanly — up $300 by 1PM.
Then the bottom fell out, and I got caught in a false range break, watching my account swing from +300 to -500.
Thankfully, I bought at BIA’s key support zone during the late-session recovery and clawed my way back.
Today was all about staying composed when everything flips fast.
Two takeaways today:
Walk away when you say you will — extra orders can cost you.
Range days can break suddenly; keep wider stops when volatility increases.
Above 6820 is bullish, below 6782 turns bearish.
We’re seeing signs of momentum fading, so tomorrow might bring continuation or deeper retracement.

ES (SPX, SPY) Analysis, Key Zones, Setups for Tue (Nov 18th)ES experienced a notable decline, concluding the day with a sharp downturn but managed a late-session rebound off a significant demand zone. At this juncture, it appears to be a robust corrective phase within an overarching uptrend, with a reasonable probability of a bounce or a range-bound trading day ahead, barring any unexpected developments from data releases or commentary from Federal Reserve speakers.
Looking ahead to tomorrow, November 18, 2025, the economic calendar is unusually packed for a Tuesday, as various U.S. data are set to be released following delays caused by a government shutdown. Key indicators to watch that could influence ES during the New York session include the import and export price indexes for October at 8:30 AM ET, industrial production and capacity utilization figures also for October at 9:15 AM ET, and the NAHB housing market index for November at 10:00 AM ET.
Additionally, several Federal Reserve officials, including Barr, Waller, Williams, and Kashkari, are scheduled to speak throughout the day. The market is particularly attuned to their insights regarding the likelihood of another rate cut, especially in light of the recently released October FOMC minutes and this week’s jobs report.
Given the abundance of potential market-moving information, I would consider the period from 9:15 to 10:15 AM ET as a critical window for "headline risk" tomorrow.
The recent market decline can largely be attributed to macroeconomic factors:
The S&P 500 cash index ended the day down approximately 0.9%, with the Dow falling around 1.2% and the Nasdaq declining by about 0.8%. This pullback has moved the indices further away from their all-time highs established last month.
The selling pressure was particularly acute among mega-cap technology stocks and the AI sector. Major players such as Nvidia, Apple, Palantir, and AMD faced heavy trading as investors began to question whether the recent surge in tech stocks, driven by AI enthusiasm, had outpaced underlying fundamentals ahead of Nvidia’s earnings release on Wednesday.
Market sentiment was further dampened by a noteworthy prediction from Stifel's chief strategist, who suggested a potential 5% drop in the S&P 500, targeting a level around 6,350 in the coming months. This outlook was based on concerns regarding high valuations and uncertainties surrounding the Fed’s future policy as delayed economic data begins to materialize.
Interestingly, the yield on 10-year Treasuries dipped slightly towards ~4.13% , indicating that today’s selloff was more of a de-risking/profit-taking maneuver specific to equities rather than a reflection of widespread risk aversion typically signaled by bond market movements.
From a technical perspective on the ES futures:
Intraday trading patterns reflected a continuation of last week’s trend of lower highs and lower lows. Prices faltered near the 6,800–6,805 mark during the overnight session before entering a clear downtrend through the morning. The volume accelerated during the late-morning selloff, ultimately reaching a low around the 6,658–6,660 band, which coincides with established daily demand zones.
Following this drop, we observed a pronounced shift in behavior: significant buying volume surged at the lows, leading to a rejected price at that demand zone and a controlled short-covering rally back above 6,690, approaching the 6,700–6,705 range as the day closed. The Nasdaq exhibited a similar trajectory, with a heavy selloff subsequently followed by a recovery.
Structurally, today’s activity reflects:
A strong continuation of downside movement, stemming from last week’s lower-high structure and macro-driven de-risking, culminating in a liquidity flush into a previously identified demand pocket followed by short-covering toward the close.
From a broader perspective, is this the beginning of a genuine downtrend?
On the daily chart, ES remains within a larger uptrend originating from the summer lows. A higher peak above 6,900 was established in late October, with the current pullback representing a decline of approximately 3–4% from that peak. Today's trading reached the 6,650–6,670 support region, which previously served as a vital higher low space, before closing back above it. Daily momentum indicators have rolled over but are beginning to flatten, indicating they are not yet deeply oversold.
In contrast, the shorter-term 4-hour and 1-hour views present a more bearish outlook: a sequence of lower highs has formed, and the retest of prior higher low levels appears to be underway. Short-term moving averages have shifted downward, and 4-hour momentum remains negative, albeit with initial signs of a slight positive divergence compared to new price lows.
In summary:
I interpret this phase as a significant corrective downswing within a larger uptrend rather than the onset of a new bear market. The potential for a more substantial correction exists, particularly if Nvidia’s earnings disappoint or if the run of delayed economic data proves weak. However, the day's trading indicates more of a necessary adjustment rather than the onset of a catastrophic decline, aligning with institutional views that this pullback signifies a "healthy reset" following a robust advance, rather than an indication of a market bubble bursting.
Should ES close below the 6,650 mark on a daily basis and subsequently begin to print lower highs under that level, I would increase my assessment of the risk of a transition into a more enduring downtrend, with targets around the 6,350–6,400 range over the coming weeks, echoing Stifel's projections. For the time being, however, buyers continue to defend this crucial daily support zone.
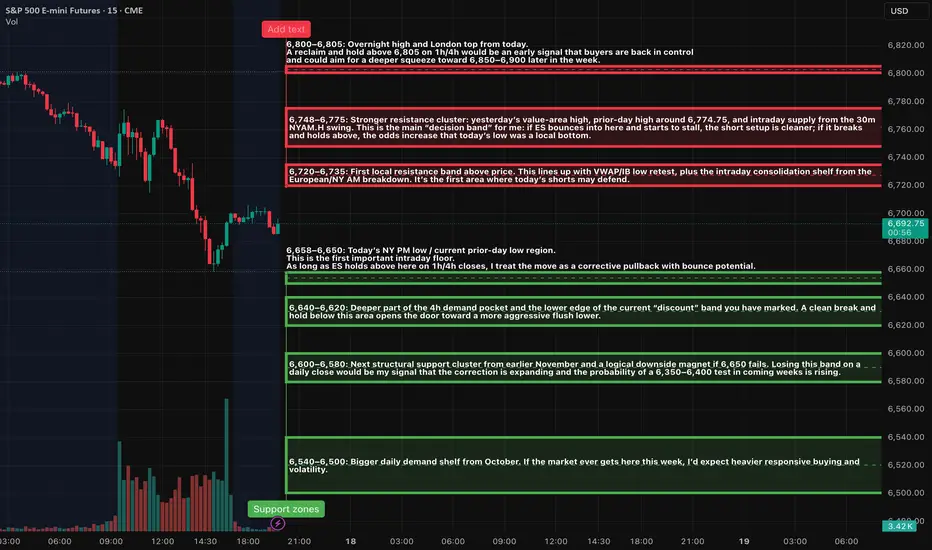
Key zones to monitor for tomorrow, in the futures market:
I identify the following support zones:
6,658–6,650: This region marks today’s New York PM low and aligns with the prior day’s low. It serves as the first critical intraday support level. As long as ES maintains closes above this area on 1-hour and 4-hour charts, I consider the movement to be a corrective phase rather than a broader downtrend.
ES Supply-Demand Long IdeaSee chart for analysis.
Technicals = mixed but long-term bulllish
Fundamentlas = bullish
Sentiment = mixed

ES1 - Correction Coming To An End ?ES1
Quite a bearish day across stocks and crypto with S&P Futures continuing on down from last week to make a slightly lower low.
From there it has bounced again from the 1:1 Golden Window - leaving a bullish wick.
Its very difficult to tell where an index correction ends, but this now ticks all the boxes for ratio and liqudity.
Its nicely balanced and has been ongoing for a while.
I think it moves on up soon or very soon.
If it does then this current area is the dip buy zone as reactive stocks and perhaps even crypto may begin to push up 🧐.
This analysis is shared for educational purposes only and does not constitute financial advice. Please conduct your own research before making any trading decisions.

ES LONGES long trade.
target 6900
SL close below 6790.
we have support loss at 4h and 1h but its fake as all Higher TF are bullish.
go long

Stair stepping up for the past 5 years now...1. Valuations are stretched and market is heavily concentrated
2. Economic growth is slowing, inflation remains sticky, and interest-rate risks persist
3. Macroeconomic & structural risks: debt burdens, global uncertainty, trade & policy
5. Rising probability of volatility, corrections, or a bear-market “reset”
I’m sensing a major shift happening and social media is amplifying every bit of the frustration.
Today people are more informed, more vocal, and more aware of corruption, pollution, and broken promises. What used to stay hidden now spreads instantly, creating pressure for immediate change or conflict.
Overdevelopment + environmental strain are pushing communities to the edge.
People everywhere are watching their forests disappear, farmland paved over, water quality decline, toxins and PFAS rise, and massive data centers suck up land and energy.
These aren’t distant, political issues anymore and people are waking up...
What I see coming:
Massive grassroots movements, legal upheavals, community organizing, rapid political realignment, disruptive protests, environmental activism, and a shift toward local, sustainable, practical solutions
People want control of their communities again, not top-down decisions that ignore sustainability.
What are your thoughts?
