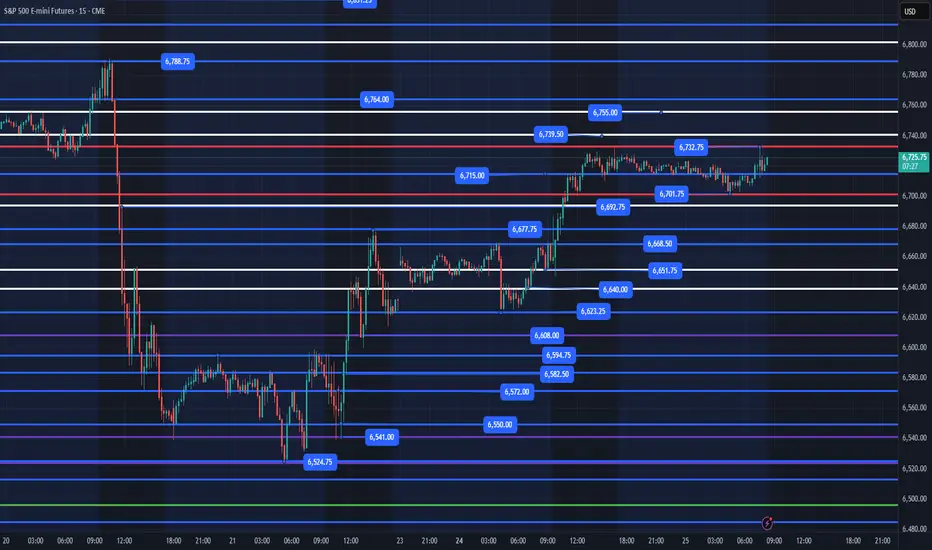
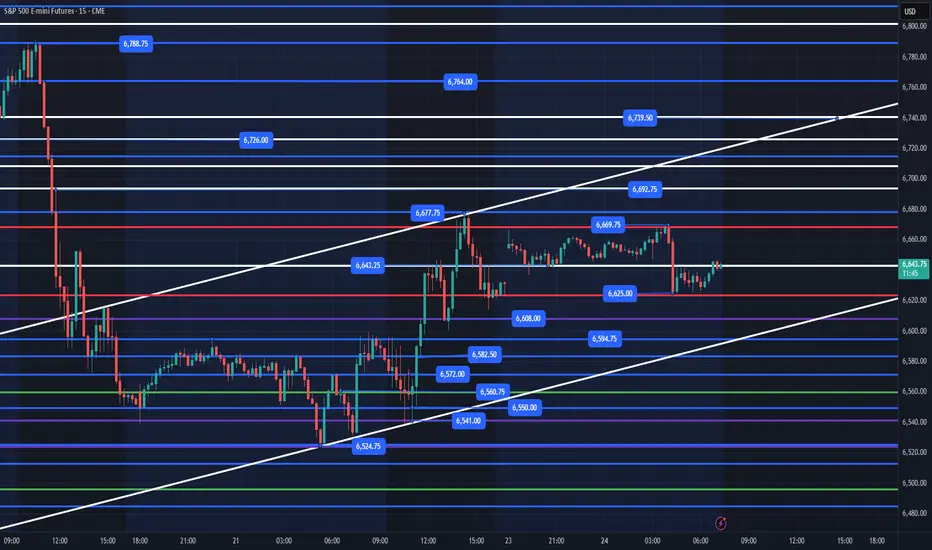
Bearish Scenario – ES Futures (BurakTheScalper)The chart shows a clear 3-tap rejection off the descending upper channel (orange arrows). Each touch has produced a lower high, confirming seller control at the channel top.
Price has now completed another full ABC corrective leg and is repeating the pattern of:
Lower High → Sharp Selloff → Channel Bottom Test
We are currently at the third rejection, which historically has been the strongest in a descending channel because:
✔️ Sellers defend the trendline aggressively
✔️ Liquidity builds above the 3rd touch → fuel for downside
✔️ Momentum typically shifts down sharply after the 3rd tap
If the pattern continues, ES is lined up for a full bearish leg toward the lower boundary of the channel.
Trade ideas

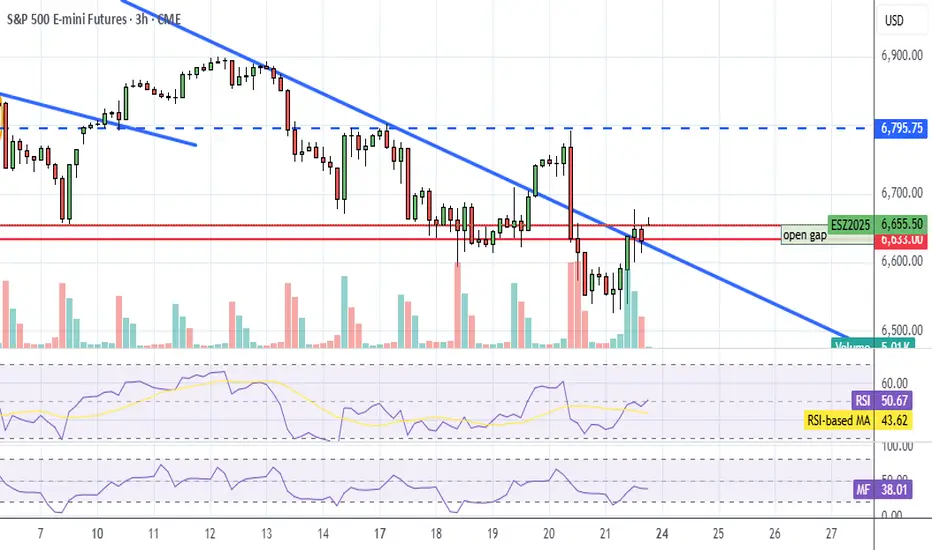
Sideways move is expectedSellers returned to the daily chart in the S&P 500 but a dramatic drop from these levels is not expected. The current expectation is an inside and only slightly lower movement in this market.

AI Stocks Weakness Could Spoil this Year’s Santa RallyAs December begins, traders worldwide are dusting off the same old question: Will we get a Santa Claus rally this year?
But 2025’s setup looks a little different. The market’s cheer seems to depend heavily on whether AI-related stocks can keep delivering miracles—and lately, the charts are suggesting they may be running out of steam.
When Tech Sneezes, the Market Catches a Cold
A quick look across U.S. equity futures shows a revealing pattern.
The E-mini NASDAQ 100 Futures (NQ), home to most AI and semiconductor giants, has posted a significantly lower monthly low compared to the prior month.
Meanwhile, the E-mini S&P 500 Futures (ES) declined much less, hinting at relative resilience, but also possible lagging weakness.
This divergence—NQ leading down while ES holds up—is a subtle warning. When the market’s growth engine (tech) loses traction, broader indices often follow with a delay. That’s the tension December traders are staring at: are we seeing the early signs of exhaustion before the holidays, or just a healthy pause?
Bearish Divergences Whisper “Caution”
The technicals are backing that cautious tone.
On the ES chart, the Commodity Channel Index (CCI) has been carving lower highs even as prices printed higher highs. This is a textbook bearish divergence, often an early sign that bullish momentum is fading.
The MACD histogram echoes the same message: momentum has been contracting through November despite new price highs, suggesting that underlying strength is eroding. Such divergences don’t predict direction on their own, but they do raise the probability of a short-term correction—or at least a choppy path into year-end.
The Price Map: Three Levels that Could Define December
Let’s outline the key technical zones traders are watching:
6,525.00: the prior monthly low—this is the first line of defense for the Santa Rally narrative. A break below this level would likely shift sentiment fast, especially if NQ continues under pressure.
6,239.50: the floor of a relevant UFO (UnFilled Orders) support zone. If ES dips below the prior low, this zone may become a “bear trap.” Many traders might short aggressively once 6,525.00 gives way, but those unfilled buy orders could absorb supply and trigger a sharp bounce. If the rally emerges from here, Santa might still make his visit.
4,430.50: a deeper UFO support cluster roughly 35% below current prices. If price were to cut through 6,239.50 and stay below it, the market would be entering a different regime altogether—likely accompanied by broken trendlines, volatility spikes, and a more defensive tone.
Reading Between the Lines: What the Divergence Means
Historically, the Santa Rally is powered by optimism, lighter volumes, and portfolio rebalancing. But this time, AI and semiconductor names—the champions of the current bull leg—are leading weakness.
That doesn’t mean doom; it means fragility.
The ES market may still rebound, but it’s doing so under reduced participation from the very sectors that drove prior gains.
Sizing the Trade Without Crossing the Line
For traders eyeing this setup through ES (E-mini S&P 500 futures) or MES (Micro E-mini S&P 500) futures, here’s a compliant, educational way to think about risk and position sizing:
Identify the Setup Zone: e.g., around 6,525.00 as potential demand, or below 6,239.50 as short-term breakdown.
Define Your Stop: the level where the technical picture is invalidated.
Set a Dollar Risk Limit: for instance, risking 1% of total account equity.
Derive Position Size: Divide your dollar risk by the price distance between entry and stop (converted into points). Then choose between the standard E-mini (ES) or Micro E-mini (MES) to match your risk tolerance and account size.
This framework lets traders adapt leverage responsibly—without needing the specific contract specs or margin figures, which vary by broker and time.
Risk Management: December Can Be a Trap
December is famous for emotional trading. The combination of holiday expectations, thinner liquidity, and year-end positioning can turn routine pullbacks into exaggerated moves.
That’s why focusing on risk before reward is critical.
The UFO support levels serve as reference zones where institutional activity might reappear, but they’re not guarantees. Managing stops, scaling out partial profits, and staying flexible matters more than trying to guess the market’s next headline.
ES and MES: Same Story, Different Scale
The Micro E-mini (MES) contract is a smaller version of the E-mini (ES), designed for traders who want the same price exposure but with lower notional size.
Both track the same index, tick for tick.
For traders exploring this December setup, the MES allows participation while controlling exposure more granularly—especially useful if volatility picks up and margin requirements shift.
Key Contracts Specs and Margins:
E-mini S&P 500 Futures (ES) with a point value = $50 per point.
Micro E-mini S&P 500 Futures (MES) with a point value = $5 per point.
As of the current date, the margin requirements for E-mini S&P 500 Futures and for the Micro E-mini S&P 500 Futures are approximately $22,400 and $2,240 per contract respectively.
Always verify the latest margin schedules and specifications directly with your broker or the exchange before entering trades, as those details update regularly and depend on market conditions.
Santa’s Setup: Scenarios to Watch
Scenario A — Santa Delivers: Price tests or slightly breaks the 6,525.00 low, finds support near 6,239.5, and rebounds into late December. Bearish divergences resolve sideways, and risk assets stabilize.
Scenario B — The Grinch Arrives: The 6,239.50 zone fails to hold, breaking trendline supports. The market slides toward 4,430.50, shaking off complacent longs and erasing part of the 2024-5 rally.
Both paths are technically valid. The difference will come from whether AI-heavy sectors regain strength—or confirm that this bull leg has indeed lost its engine.
Educational Takeaway
Divergences (CCI and MACD) highlight when momentum and price disagree—a sign of fatigue.
Intermarket analysis (ES vs. NQ) reveals where weakness may originate.
UFO levels identify potential institutional footprints—where traps or reversals often occur.
Discipline and risk control matter more than predicting whether Santa shows up.
Final Thought
Whether December brings gifts or grief may depend less on seasonal hope and more on how traders interpret these divergences.
If AI stocks can find footing again, the rally could revive. But if they keep sliding, this might be the year Santa takes a break.
When charting futures, the data provided could be delayed. Traders working with the ticker symbols discussed in this idea may prefer to use CME Group real-time data plan on TradingView: www.tradingview.com - This consideration is particularly important for shorter-term traders, whereas it may be less critical for those focused on longer-term trading strategies.
General Disclaimer:
The trade ideas presented herein are solely for illustrative purposes forming a part of a case study intended to demonstrate key principles in risk management within the context of the specific market scenarios discussed. These ideas are not to be interpreted as investment recommendations or financial advice. They do not endorse or promote any specific trading strategies, financial products, or services. The information provided is based on data believed to be reliable; however, its accuracy or completeness cannot be guaranteed. Trading in financial markets involves risks, including the potential loss of principal. Each individual should conduct their own research and consult with professional financial advisors before making any investment decisions. The author or publisher of this content bears no responsibility for any actions taken based on the information provided or for any resultant financial or other losses.

what is gonna happend. need 30K till mid december... I believe the price will continue going up because of the momentum and the rate cut tomorrow… But you know how market works rarely in your favor. Is this gonna be another sell the news event if anybody got a clue, please help me out… Need to buy the house otherwise it's going on the auction.

ES (SPX, SPY) Analysis, Levels, Setups for Wed (Nov 26)Market Overview
The equity markets are currently facing a pivotal moment. The E-mini S&P 500 (ES) has made a significant rebound from the daily low around 6,520, approaching robust resistance levels formed by the highs of the previous week and yesterday. Both daily and 4-hour charts reveal a consistent pattern of higher lows emerging from a recent trough. However, the price now finds itself just beneath a key distribution cap and Fibonacci extension zone, estimated between 6,810 and 6,888. The daily momentum oscillator has shifted upward from an oversold position and remains at a mid-range level, indicating that while it is not yet overbought, the general trend still favors buying the dips, provided that crucial support levels are maintained.
Meanwhile, the Nasdaq 100 (NQ) mirrors this momentum, hovering near its New York Pre-Market (NYPM) peak. Recent gains have been bolstered by impressive earnings from Nvidia, highlighting the ongoing AI narrative, even as concerns about a potential market bubble begin to emerge, with NVDA's stock showing signs of volatility.
Events & News for Wednesday 26 Nov (Pre-Thanksgiving)
Wednesday is a data-heavy session in the U.S., and it’s also the last “normal” day before the Thanksgiving holiday liquidity vacuum. Expect volatility spikes and potential regime shifts around:
• 08:30 ET – Weekly jobless claims plus a cluster of delayed October releases: durable goods orders, trade balance/wholesale data, personal income & core PCE inflation, and related indicators.
• 10:00 ET – New home sales and other housing-related data.
• 10:30 ET – EIA crude oil inventories (can move risk sentiment via energy/curve).
• 14:00 ET – Fed Beige Book, giving an updated regional read on growth and inflation ahead of December’s FOMC meeting.
In addition, the BEA has postponed the Q3 GDP second estimate that had been scheduled for this week, so markets are leaning more heavily on the data above for macro guidance.
Net takeaway: 8:30 ET is the main volatility window, with a second impulse risk at 10:00–10:30 and potential trend extension or reversal into the NY morning kill-zone.
Key Zones (ES Z-25, based on current structure)
Immediate Resistance
• R1: 6,790–6,795
NYPM High / Prior Day High cluster (NYPM.H 6,792.5, PDH & Y-VAH 6,792.5). Sellers have defended this intraday band so far; it’s the lid of today’s range.
• R2: 6,805–6,815
1H fib extension 1.272 (≈ 6,810.25) plus likely PWH vicinity. First HTF extension above today’s range; a clean “stop run & decision zone” if 6,795 breaks.
• R3: 6,840–6,850
1H fib extension 1.618 (≈ 6,847.25). If buyers punch through R2, this is the next logical magnet and a strong candidate for an exhaustion spike on good data.
• R4: 6,880–6,900
1H fib 2.000 (≈ 6,888) and prior daily swing-high area. That whole 6,888–6,900 pocket is a big-picture objective and, for now, a likely “weak high” that could attract a stop run but also host the first serious counter-trend attempts.
Support / Demand
• S1: 6,765–6,775
Yesterday’s POC (~6,769.5), NY lunch high/NYL.H (6,774.25), and top of the 1H consolidation shelf. As long as the market keeps closing above this band on 15–60m, the short-term uptrend remains intact.
• S2: 6,720–6,735
Y-VAL 6,720.5, LO.H 6,721.5, ONH 6,732.5. This is the top of the prior value area and a natural “buy-the-dip” location if 6,770 gives way on data noise.
• S3: 6,670–6,705
NYAM.L 6,674.5, IB Low 6,674.5, ONL 6,701.75, plus current LOL 6,701.75. If we get a deeper flush, this is the primary intraday demand band where bulls must step back in to preserve the recent trend from the daily low.
• S4: 6,560–6,580
PDL 6,574.5 and top of the larger daily discount block. A break and sustained acceptance below here would open the door for a much larger retrace back toward the 6,520–6,420 HTF discount zone (daily 1.272/1.618 fibs).
Market Outlook: Bias & Forecast (Overnight → NY Session)
Structural Bias:
The prevailing market sentiment remains bullish as long as the E-mini S&P 500 (ES) sustains its position above the support range of 6,720–6,735 on a closing basis. The likely trajectory indicates a probing towards the 6,810–6,850 extension band. While the recent rally shows signs of being extended, it has not yet reached a point of definitive exhaustion, pointing towards a “late-stage impulse” rather than a confirmed top.
Overnight → London Session:
The base case anticipates a sideways-to-moderately downward movement from the 6,790s back toward the support levels of S1/S2 (6,765 → 6,730). This move aims to address intraday imbalances without disturbing the overall market structure. Should liquidity be limited, there may be an attempt during the London session to trigger stops through today's highs, directing attention towards resistance levels R2 (6,805–6,815) ahead of the New York session's developments.
New York AM Session (8:30–11:00 ET):
Should robust data emerge—indicating a favorable economic climate with subdued core Personal Consumption Expenditures (PCE) and steady labor claims—this is likely to spark a rally through R1 towards R2/R3, targeting 6,810 and subsequently 6,847 as key upside magnets. Conversely, a negative surprise featuring weak growth, a troubling inflation mix, or a risk-off sentiment evident in the Beige Book later in the day could dramatically alter the market landscape, potentially driving a liquidation toward support levels S2/S3, or in case of an unexpected shock, even probing S4 over the coming 24 to 48 hours.
In the near term, the expectation leans towards a gradual upward movement with shallow pullbacks, aiming for the 6,810–6,847 range. However, traders should remain vigilant for an increased risk of an exhaustion spike and a possible intraday reversal as this target zone is approached.
A++ Setups for Tomorrow
A++ Setup 1 – Trend Long from Retest of 6,730–6,770
Trigger:
Price trades down into 6,730–6,770 (S1/S2 overlap) either overnight or on the 8:30 data flush.
15m prints a higher low and closes back above ~6,755, reclaiming the mid-range.
5m confirms with a clear reclaim and hold of 6,760–6,770, then a higher low on 1m.
Entry Zone: 6,760–6,775 on a clean pullback after reclaim (not the first knife-catch wick).
Initial Stop: Below 6,720, tucked beyond Y-VAL/LO.H and the pullback low (≈ 35–45 pts risk depending on your exact fill).
Targets:
• TP1: 6,810–6,815 (R2 / 1.272 fib).
• TP2: 6,840–6,850 (R3 / 1.618 fib).
• Stretch: 6,880–6,900 (R4 / 2.0 fib) if data and risk sentiment stay supportive.
A++ Setup 2 – Exhaustion Short from 6,847–6,888
Trigger:
Impulsive move into 6,847–6,888 during NY AM or early PM, ideally on or shortly after 8:30 data.
15m candle shows rejection (long upper wick) and closes back below ~6,847.
5m prints a lower high under that rejection high, and 1m fails to make new highs on retests.
Entry Zone: 6,845–6,865 on the first proper lower-high after the rejection (avoid shorting the exact wick; let the LH print).
Initial Stop: Above 6,900, beyond the 2.0 fib and psychological round number (≈ 35–45 pts risk).
Targets:
• TP1: 6,790–6,795 (R1 / NYPMH/PDH cluster).
• TP2: 6,760–6,770 (S1 pivot band).
• Stretch: 6,720–6,735 (S2 / top of value) if selling pressure persists.

ES the big fall day ?Looking to short ES today to 6720 area.
based on yesterday movement that weren't able to make new local HOD => assuming today we will go lower .
SL close above 6855
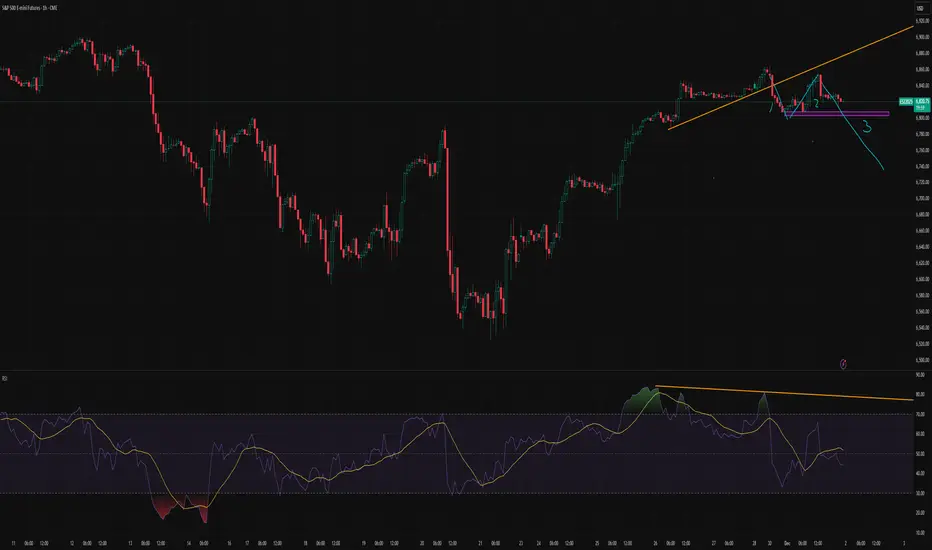
123 Pattern, The decline will find support.Divergence occurred before the broader market declined. Currently, it has broken below the trendline and is likely to resume the downtrend after a pullback. The medium-term top has not yet formed—following the decline, the market is highly probable to find support and may continue to hit new highs this month.
ES LONGES long trade.
target 6900
SL close below 6790.
we have support loss at 4h and 1h but its fake as all Higher TF are bullish.
go long

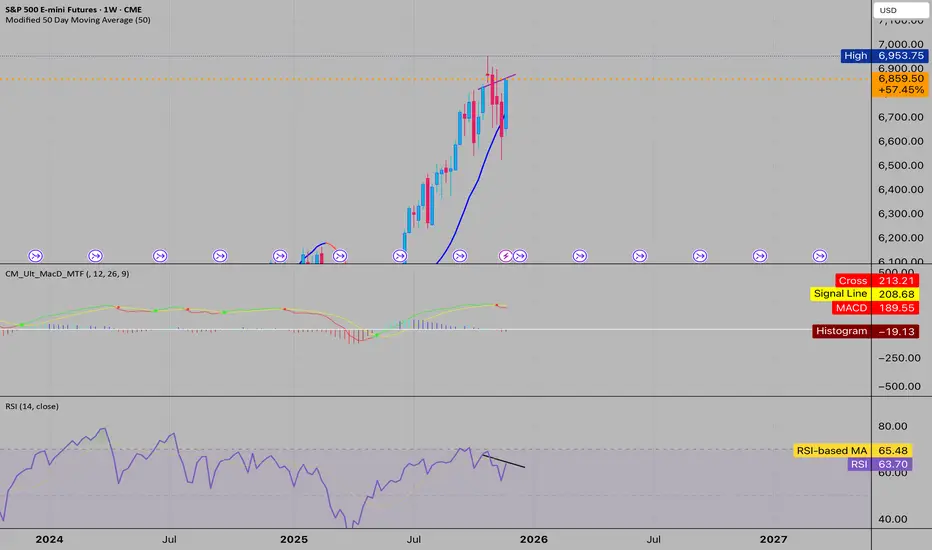
Weekly and Daily Bearish DivergenceSPX is starting to show the bearish divergence everyone has been anticipating. Let’s see how this plays out with Treasury tight liquidity, over night funding rates going up. I think we are going to see a Red 12/01 though the week.
Holding its ownIn the shortened trading session the daily chart for the S&P 500 indicates a market that's holding its own with very little volatility in creating the expectation of a sideways move on Friday.

ES - November 25th - Daily Trade PlanNovember 25th- Daily Trade Plan - 8:25am
*Before reading this trade plan, if you did not read yesterday's take the time to read it first! (You can view the posts in the related publication section) *
If my posts provide quality information that has helped you with your trading journey. Feel free to boost it for others to find and learn, also!
My daily trade plan and real-time notes that I post are intended for myself to easily be able to go back and review my plan and how I did from an execution perspective.
--------------------------------------------------------------------------------------------------------
As many of you know that when we have a big sell off like we did last week, we squeeze higher and usually will back test the area we broke down from. When this happens, we will have 2-3 days where price will not flush the previous day's low and you have to find opportunities in other levels to grab some points.
When we are in a tight range, we can usually find a flush and reclaim of the 9:30-9:45am low can be another good place to look to enter. This could be something like flush below 6715 to 6706-11 and then reclaim the session opening low. (This is not how I typically look for points, but it is a good way when we are in a tight range and have limited setups.)
The overnight high is 6732 and Overnight low is 6701.
Key Levels Today
1. 6732 reclaim (Back test of this level should give us a move to 6755)
2. 6701 flush and reclaim
3. 6669 - flush and reclaim
4. 6623 - flush and reclaim
Below there and I would be patient and wait to see what price does at the levels below.
I will post an update around 10am EST
----------------------------------------------------------------------------------------------------------------
Couple of things about how I color code my levels.
1. Purple shows the weekly Low
2. Red shows the current overnight session High/Low (time of post)
3. Blue shows the previous day's session Low (also other previous day's lows)
5. White Levels are previous day's session High/Low
Buyers made an attemptBuyers in the daily chart of the S&P 500 made an attempt to push the market to new lies but it failed to hold onto those highs and backed off to lower prices by the close. The expectation is buyers will make another attempt towards the upside with an objective of 6881.

S&P500: Poised for Further Pullback The S&P 500 futures are currently trading just above support at 6,540 points, but are expected to see a temporary pullback within magenta wave (4). In our primary scenario, we anticipate the sell-off will extend into the green Long Target Zone between 6,163 and 5,912 points. From this area, we expect the start of wave (5), which would complete the magenta five-wave sequence and push the index higher—ideally above resistance at 6,952 points. This move would also mark the final high of the broader blue wave (III). However, if selling pressure intensifies and the Long Target Zone is breached, our alternative scenario will come into play (probability: 31%). In this case, blue wave alt.(III) would already be complete, and the index would enter a significantly deeper correction phase.

/ES1! Analysis towards openingJust purchased Trading View Premium today and I've been playing around some of the features they offered, when I realized looking at the cummulative delta that there is a divergence and passive sellers have been absorving throughout the friday session. I guess when they are done accumulating their short positions there will be another imbalances to a lower floor. Let's see what the gamma says at opening.

ID: 2025 - 0136.12.2025
Trade #13 of 2025 executed.
Trade entry at 162 DTE (days to expiration).
Excellent fills this morning, well under mid. Created a GTC working order two days ago and let price come to me. No chasing. There are TONS of external liquidity voids resting below.
Target profit is 5% ROI
Happy Trading!
-kevin

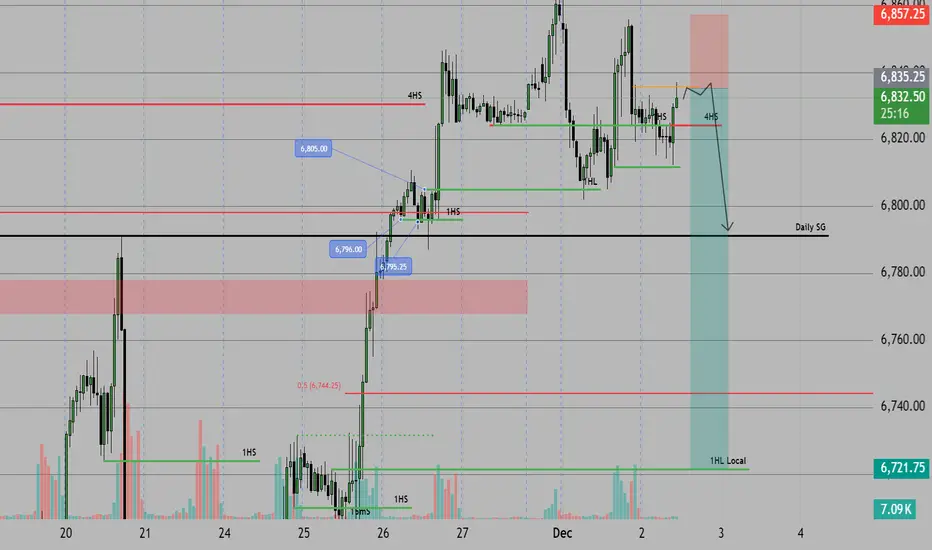
Next week ES BearishNext week’s price outlook appears bearish.
Market structure shows a clear downtrend following the confirmed break of the previous swing low.
Price is expected to retrace into the iFVG before continuing lower toward the downside order block.
The iFVG aligns precisely with the lowest tick of the highest candle of the prior move and sits in the correct position relative to the previous supply zone.
The order block below is a high-probability area, as five liquidity lows are positioned directly above it.

ES - November 24th - Daily Trade PlanNovember 24th- Daily Trade Plan - 7:20am
*Before reading this trade plan, if you did not read yesterday's take the time to read it first! (You can view the posts in the related publication section) *
If my posts provide quality information that has helped you with your trading journey. Feel free to boost it for others to find and learn, also!
My daily trade plan and real-time notes that I post are intended for myself to easily be able to go back and review my plan and how I did from an execution perspective.
--------------------------------------------------------------------------------------------------------
Friday's trade plan had 2 excellent setups with the flush of 6540 and reclaim around 10:45am and the back test of the 6594 breakout around 11:45am. That is all that was needed to have a nice day to end the week.
Overnight we gapped at the open and the overnight high was 6669 and overnight low is 6625. We should have a pretty straightforward day with the following key levels.
Key Levels Today
1. 6625 flush and reclaim
2. 6608 flush and reclaim (could go down to 6594 and then recovery)
3. 6540 flush and reclaim
4. 6524 flush and reclaim
5. 6669 reclaim level and back test to move higher
I will post an update around 10am EST
----------------------------------------------------------------------------------------------------------------
Couple of things about how I color code my levels.
1. Purple shows the weekly Low
2. Red shows the current overnight session High/Low (time of post)
3. Blue shows the previous day's session Low (also other previous day's lows)
4. Yellow Levels are levels that show support and resistance levels of interest.
5. White Levels are previous day's session High/Low
The end - 2026 Financial panicSince 2300, I’ve marked a zone and made a personal commitment: no matter what happens in the market, when this zone is approached, I will begin reducing my exposure and carefully exit all financial markets—with extreme caution and tight stop losses.
Yesterday, I received an alert I never expected to see. It signaled the approach of the zone I identified back in 2021 as the escape point—where major crashes are likely imminent and the urge to invest must be resisted.
This zone aligns with the 0.786 trend-based Fibonacci level from the 2009 bottom to the 2020 peak, as well as the April 2020 bottom. It also coincides with the 2.618 and 3.618 Fibonacci extensions from the 2007–2010 cycle, and the 3.618 trend Fibonacci from the 2002–2009 cycle. But that’s not all.
According to Gann’s Square of 9, if you examine closely, you’ll notice that whenever the trend reaches one of its primary or secondary angles since the 2009 bottom, it consistently triggers a significant drop. The end cycle at the 360° angle corresponds to 7926—perfectly aligning with all the previously mentioned Fibonacci zones.
And for those skeptical of technical analysis, consider this: the upcoming year, 2026, is a pivotal year in the Samuel Benner chart developed in 1875 to identify periods of financial disorder. Benner’s chart indicated when to buy, when to sell, and when to expect chaos. Remarkably, it has accurately forecasted major financial crashes over the past 150 years—including the Great Depression, the Dot-Com bust, and the 2020 COVID crash. According to this chart, selling during the crash year and re-entering post-crash has historically led to profitable outcomes with a +-2 Years at a 87.5% accuracy.
When you combine all these signals, it feels reckless not to take them seriously—especially since this marks the end of a cycle measured from 2009. That’s how significant it is.
To those who dismiss technical analysis, this may sound like smoke and mirrors. But for those who’ve seen its power firsthand, the sheer number of confluences here is too substantial to ignore. If I know such big crash may happen - I would be happy to wait 1-2 years on cash and take opportunity of big red markets to buy.
Curious to hear your thoughts on this.

The Truth About Timeframe Analysis (No One Wants to Tell You)*You’re not confused because the market is chaotic.
You’re confused because your framework is garbage.*
🔥 Timeframes Don’t Lie — But Traders Do
Let’s be real:
You jump between timeframes looking for “confirmation,”
but all you’re really doing is collecting excuses.
1H looks bullish
15M looks like a breakout
4H is pulling back
5M is breaking structure in the opposite direction
Now you have five different opinions in your head
and exactly zero conviction.
You hesitate.
You enter late.
You get trapped.
You flip bias like a rookie.
This isn’t “market randomness.”
It’s simply a lack of hierarchy.
⚡ The Market Isn’t Messy. YOUR PROCESS Is Messy.
Every timeframe gives you a “mini truth.”
Without structure, you mix them together into something that feels like analysis…
but is actually noise dressed as logic.
That’s why you keep:
❌ trading micro signals against macro structure
❌ believing every candle is a reversal
❌ ignoring invalidations because you “like the setup”
❌ frying your brain before you’ve even risked a dollar
You don’t need another indicator.
You need a logic system that crushes noise and exposes REAL probabilities.
🔥 The 3 Variables (The Part Traders Think They Understand… But Don’t)
Most traders “kind of” know what trend, zones, and candles are.
And “kind of” is exactly why they lose.
In this model, each variable has a precise definition, variations, and probability weights that change depending on the context.
You’re not reacting emotionally — you’re measuring.
That’s what makes the system mechanical.
1️⃣ Trend — The Market’s Actual Intent (Not Your Guess)
Definition:
The structural direction defined by higher timeframes — not the last 3 candles on 5M.
Variations:
Strong trend
Weak/aging trend
Neutral compression
Context impact:
A strong trend entering a strong zone with a confirming candle = high probability.
A tired trend hitting a counter zone = danger.
👉 Trend isn’t “up or down.”
It’s how mature and healthy that direction is.
2️⃣ Zone — Where the Real Decisions Are Made
Definition:
Price areas that actually matter: supply, demand, break/retests, major SR.
Variations:
Fresh zone (strongest)
Retested zone (usable)
Overused zone (dead)
Context impact:
Zones inside dominant trend → continuation setups
Zones against dominant trend → only valid with strong multi-timeframe alignment
Zones broken on mid-timeframes → bias must be re-evaluated
👉 Zones aren’t lines.
They’re probability clusters.
3️⃣ Candle — The Signal That Confirms… or Invalidates Everything
Definition:
The micro-expression of intent: rejection, displacement, absorption, continuation.
Variations:
Rejection wick
Displacement/imbalance
Compression
Fake strength traps
Context impact:
A “strong candle” in a weak zone means NOTHING.
A clean rejection + structure shift inside a strong zone + aligned trend = top-tier entry.
👉 Candles are not signals by themselves.
They’re filters.
💥 The Edge Isn’t the Variables — It’s Their Alignment
Anyone can draw zones and identify candles.
Losing traders do it every day.
The real edge comes from understanding:
how each variable shifts with context
how its probability weight changes
how alignment creates high-probability setups
how misalignment warns you to STOP IMMEDIATELY
Once each variable has a precise meaning
and precise behavior inside each context…
The system becomes mechanical.
No more emotional gambling.
No more “I think this is a reversal.”
No more overthinking.
Just one rule:
If the variables align → execute.
If they don’t → wait.
📶 The Only Timeframe Hierarchy That Makes Sense
📌 High Timeframes (4H / 1H)
→ Define true market bias
→ Only overridden by strong opposite confluence
📌 Mid Timeframes (30M / 15M)
→ Confirm or challenge the bias
→ Can create valid setups if rules align
📌 Entry Timeframes (10M / 5M / 2M)
→ Execution only
→ No bias allowed here
This structure kills FOMO, kills hesitation, and kills the “I changed my mind” syndrome.
🚀 The Two Setups That Actually Pay
1️⃣ Precision Setups (Low-Risk / High-Accuracy)
1:1 to 1:2
Clean, frequent, reliable.
2️⃣ Momentum Setups (When Everything Aligns)
1:3+
Rare — but violent and highly profitable.
If you’ve ever seen the market move exactly as you forecasted…
That was confluence.
You just didn’t know how to replicate it.
💀 Stop Trading Noise. Start Trading Probability.
This model does NOT eliminate all losses.
It eliminates the avoidable, stupid ones caused by emotional reactions and inconsistent bias.
Give me 10 trades executed under true confluence,
and the results explain everything.
📣 Want Chapter 2?
I’ll break down the full confluence model and the exact rules that make it repeatable.
Follow me here on TradingView,
save this idea,
and comment “CH2” if you want the next release.
More coming soon —
but only for the people actually paying attention.
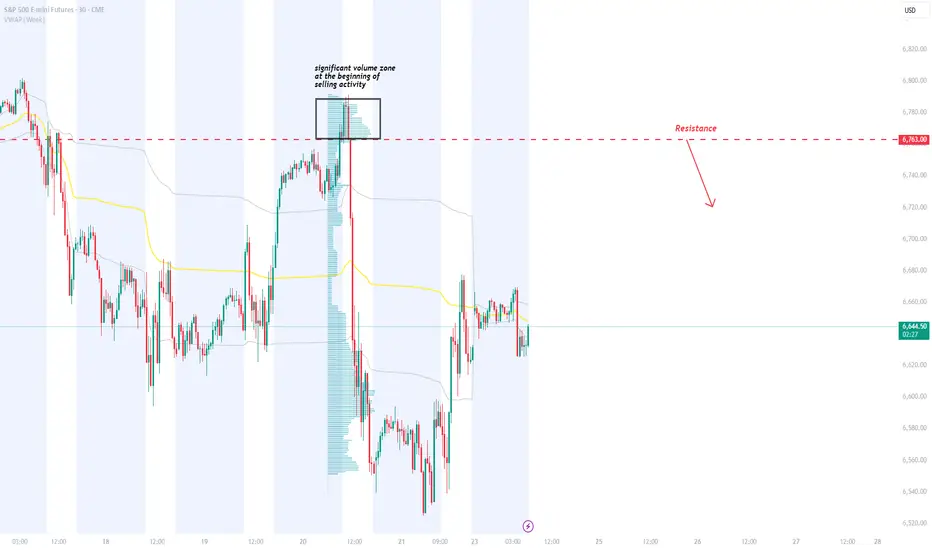
ES 6763: Heavy-Volume Resistance + FVG Confluence Short SetupPrice is approaching a strong resistance on ES at 6763. This level sits at the start of a heavy-volume zone created during a major selloff, where sellers built short positions and are likely to defend again. A bearish Fair Value Gap aligns with the same level, adding strong confluence. If price pulls back into 6763, the short setup becomes highly attractive.
ES 4h TF, LongAlright, here’s the call. I’m expecting a retracement sooner or later.
On the 1-hour timeframe, the ideal day-trading entry has already passed, so for now, I’m anticipating the price to tap or slightly extend beyond the blue line before pulling back toward one of the yellow zones.
Now, this is where it gets interesting. Both yellow zones offer potential long setups:
The first zone aligns with the VWAP, which often acts as strong dynamic support.
The second zone sits just below a price gap, meaning the market might fill that imbalance before continuing higher.
As long as the fundamentals remain stable, I’ll be watching for confirmation to go long from either of those two areas.
If I decide to take this trade, I’ll update and specify the exact entry point — but for now, patience is key. Let’s wait for that retracement first.

Bullish Hidden Divergence Signals Rally Toward 6,950 ResistanceThe S&P 500 E-mini is showing a bullish hidden divergence on the MACD indicator, suggesting strong underlying momentum despite recent pullbacks. Price has bounced from key support near 6,538 and is targeting the major resistance level at 6,953. Watch for confirmation of this move as it could mark the continuation of the uptrend and a potential breakout to new highs.

ES Gap AlertFutures are up but they all gapped up which means that has to fill, but you guys know that by now, lol. It is headed down right now.
Not sure what the pattern will be because market will be closed Thu and half day on Fri, and day after Thanksgiving is usually low volume trading.
We'll see what futures look like before open tomorrow.