S&P500: Slightly higherS&P 500 futures edged slightly higher in yesterday’s session. The index appears to remain within the upward trajectory of magenta wave (5), which is expected to continue pushing higher. Once this wave reaches its peak, the larger blue wave (III) should also complete. Afterward, we anticipate a corrective phase in the form of magenta wave (A), which could put renewed pressure on the index. However, if prices reverse course and fall below the support level at 6,371, our alternative scenario will come into play. In that case, alternative wave alt.(4) would likely extend further downward, targeting a low within the corresponding alternative zone between 6,055 and 5,822 points (probability: 30%).
Trade ideas

Understanding Money Flow Index In TradingMoney Flow Index (MFI) is a volume-weighted oscillator (0–100) that blends price and volume to show where real buying or selling pressure is building. By comparing positive vs. negative money flow from the Typical Price ((H+L+C)/3) and volume, MFI acts like a volume-aware RSI .
Traders use it to spot overbought/oversold zones (commonly >80/<20), confirm trend regimes around the 50 line, and catch divergences that often precede reversals. It’s simple, fast, and works across stocks, crypto, and FX—best used with a clear market structure and disciplined risk management.
1) Why is MFI important in trading?
MFI blends price and volume into a single oscillator, helping you spot exhaustion, confirm trends, and catch divergences earlier than price-only tools. Think of it as a volume-weighted RSI that validates whether a move is backed by real participation.
Captures “true” buying/selling pressure via volume.
Flags overbought/oversold zones more selectively than RSI.
Great for divergences, regime reads, and pullback timing.
2) MFI Components
Typical Price (TP): (High + Low + Close) / 3
Raw Money Flow (RMF): TP × Volume
Positive/Negative MF: Sum RMF on up-TP vs down-TP bars
Money Flow Ratio (MFR): PMF / NMF
MFI Line (0–100): RSI-style transform of MFR
Default length: 14 (common, tweakable)
3) MFI Formula
//@version=5
// Formula sketch (not an executable script)
TP_t = (high + low + close) / 3
RMF_t = TP_t * volume
// Over N bars:
PMF = sum( RMF_t where TP_t > TP_{t-1} )
NMF = sum( RMF_t where TP_t < TP_{t-1} )
// If TP_t == TP_{t-1}, ignore bar
MFR = PMF / NMF
MFI = 100 - (100 / (1 + MFR))
4) Interpreting MFI signals
Here’s how to read the line like a pro.
Zones: Overbought > 80 (extreme > 90), Oversold < 20 (extreme < 10)
Divergences: Bearish = price HH while MFI LH; Bullish = price LL while MFI HL
Midline/Regimes: Above 50 favors bulls; below 50 favors bears
Failure swings: Overbought → pullback → lower MFI high while price retests = caution
5) Trend & Momentum Analysis
Use MFI to confirm trend strength and quality.
Bullish ranges: MFI oscillates ~40–90 in uptrends; 50 often holds on dips
Bearish ranges: MFI oscillates ~10–60; rallies stall near 50–60
Momentum bursts: Fast pushes into 80–90 after consolidation often precede breakouts
Multi-timeframe: Align higher-TF MFI regime (e.g., 1D) with lower-TF entries (e.g., 1H)
6) MFI-Based Trading Strategies
Practical, testable rules you can refine.
A) Mean Reversion (Counter-Trend)
Entry: MFI < 20 → bullish reversal candle or break of minor swing high
Invalidation: Below the setup candle’s low or last swing low
Exits: MFI back to 50–60, or retest of VWAP/mid-channel
B) Breakout Confirmation
Precondition: Sideways range, contracting volatility
Trigger: Close outside the range and MFI > 55–60 (or spike > 80)
Exits: Trail behind structure/ATR; partials at measured move of the range
C) Trend Pullback Buy
Context: Uptrend with MFI mostly > 50
Entry: Pullback drives MFI into 40–50 then curls up; enter on HH/HOC close
Exits: Prior high, Fib extensions, or when MFI loses 50 again
D) Divergence Reversal
Trigger: Clear price/MFI divergence + break of a micro trendline or last swing
Risk: Tight stop past divergence origin
Targets: Midline 50 first, then opposing extreme 80/20
Confluence ideas: Pair with RSI, OBV, Bollinger Bands, or Volume Profile; require session/time filters for intraday assets.
7) Limitations of MFI
Know where it can mislead you.
Strong trends can pin MFI at extremes (overbought can stay overbought).
Volume quality matters (tick volume ≠ , centralized exchange volume).
Parameter sensitivity: too short = noise; too long = lag.
Data irregularities (thin books, outages, rollovers) can skew readings.
8) Optimization
Smart tweaks that actually help in live markets.
Dynamic Zones: Replace fixed 80/20 with rolling percentiles (e.g., 90th/10th of last 252 bars).
Adaptive Length: Tie MFI length to ATR/realized vol to reduce whipsaws.
Session Filters: Act only during liquid sessions; avoid lunch hours/illiquid opens.
Walk-Forward Testing: Validate across regimes; don’t overfit one market.
Risk First: Size by ATR; plan partials; use time-based exits to avoid stagnation.
9) Key Takeaways
Wrapping it up with what matters most.
MFI is a volume-aware oscillator that improves on RSI in participation-heavy moves.
Use 50 as a regime filter; use 80/20 (or dynamic zones) for edges.
Best signals: divergences, trend-pullback resets, and breakouts with MFI thrust.
Respect limitations: trends can pin MFI; validate with structure and clear risk controls.
Optimize with percentile zones, adaptive lengths, and session filters—then forward-test.
Analysis of the ES for the week of November 10 to 14, 2025Analysis based on a deep mathematical and scientific understanding of price action, particularly for my two markets NQ & ES. Looking forward to reading your comments.
S&P500 ON IT'S WAY TO TEST ALL TIME HIGH!Hey Traders so we are back in action checking out the Stock Indexes again.
From now on my main focus will only be the indexes I feel they are the best markets to trade for trend followers like me. Although I may occasionally make a post about other markets the indexes are my main area of study so with that being said lets dive in!
So Govt Shutdown? Seasonally Strength? Inflation Fears? Interest Rates Cuts/Hikes?
I say if you read all the headlines you will find your self in a whirlwind of ideas of how you could trade this market. But imo forget the headlines and go to what we can trust in my opinion is the charts!
For me I believe trade what I see not what we think, not what we hear, only focus on what we see the charts always have been and always will be at least for me the best guide on how to sail these uncharted waters so what do we actually see?
Well I se a strong uprtrend in place since April and I also see the market has rejected the 6690 level 3 times that tells me without any indicators needed what so ever that the market does not want to move lower than that level for now.
Support and Resistance is all you need imo to see whats happening every trading day tells a story follow the story and you will hopefully get on the right side of the market.
So therefore scenarios for today are...
Bullish- this is market is a buy imo on a pullback to the trendline around 6813. Try to put a stop somewhere out of harms way but give the market breathing room around 6760 ish looks safe. Also November seasonally is a strong month normally for stocks. If the Shutdown ends the market could celebrate and the move could be epic!
Bearish- stay in hibernation for the winter. 😁
No seriously the odds and the probabilites are really against the bears here. I would wait for January where normally market Seasonally weakens till march. Watch for maybe a top or break below support and a break below the trendline on a daily close to be sure. Then consider selling a rally.
Commitment of Traders- no report at this time due to govnt shutdown.
Good Luck & Always use Risk Management!
(Just in we are wrong in our analysis most experts recommend never to risk more than 2% of your account equity on any given trade.)
Hope This Helps Your Trading 😃
Clifford
RISK DISCLOSURE
TRADING IN THE FUTURES AND FOREX MARKET INVOLVES SIGNIFICANT RISK. ALWAYS CONSULT A FINANCIAL ADVISOR AS HIGH RISK ASSET CLASSES MAY NOT BE SUITABLE FOR ALL INVESTORS. THIS IS NOT A RECOMMENDATION TO BUY OR SELL ANY ASSETS. ALL IDEAS ARE MADE FOR EDUCATIONAL PURPOSES. PAST PERFORMANCE DOES NOT GUARANTEE FUTURE RESULTS.
CFTC RULE 4.41 – HYPOTHETICAL OR SIMULATED PERFORMANCE RESULTS HAVE CERTAIN LIMITATIONS. UNLIKE AN ACTUAL PERFORMANCE RECORD, SIMULATED RESULTS DO NOT REPRESENT ACTUAL TRADING.

ES - November 12th - Daily Trade PlanNovember 12th- Daily Trade Plan - 6:50am
*Before reading this trade plan, IF, you did not read yesterdays, or the Weekly Trade Plan take the time to read it first! (You can see both posts in the related publication section) *
If my posts provide quality information that has helped you with your trading journey. Feel free to boost it for others to find and learn, also!
My daily trade plan and real-time notes that I post are intended for myself to easily be able to go back and review my plan and how I did from an execution perspective.
--------------------------------------------------------------------------------------------------------
Yesterday we lost the overnight low of 6836 down to 6830 level and reclaimed to move us higher in the afternoon and into the overnight session today. Yesterday's price action was very choppy, and a big battle was had at the daily low of 6831. This will become a good level next time we can test it and reclaim.
Overnight Low was 6867 and high is 6900. 6867 was yesterday's overnight high and we cleared it around 1pm, built a strong base and held it overnight. This level should be our first level to grab some points today. The RSI is extended on all time frames, and we have CPI & PPI coming up over the next couple of sessions which should give us some actionable volatility. The big question will be - Can we go to ATH's? I believe the re-opening of the government once it is officially through will create volatility and it could be a sell the event moment. If you remember, this current rally we are in started with a massive sell off on Friday that lost a prior weekly low at 6690 (Which is the level I had talked about being very important for us to hold to keep the uptrend going.) Institutions bought it up around noon on Friday down at 6654 and put in a massive squeeze. Then around 2pm that day news came out that Democrats had put a proposal on the table to open the government (Buy the News event). Moving forward over the coming weeks, the weekly low of 6654 will be critical to the uptrend and needs to hold again for us to continue higher.
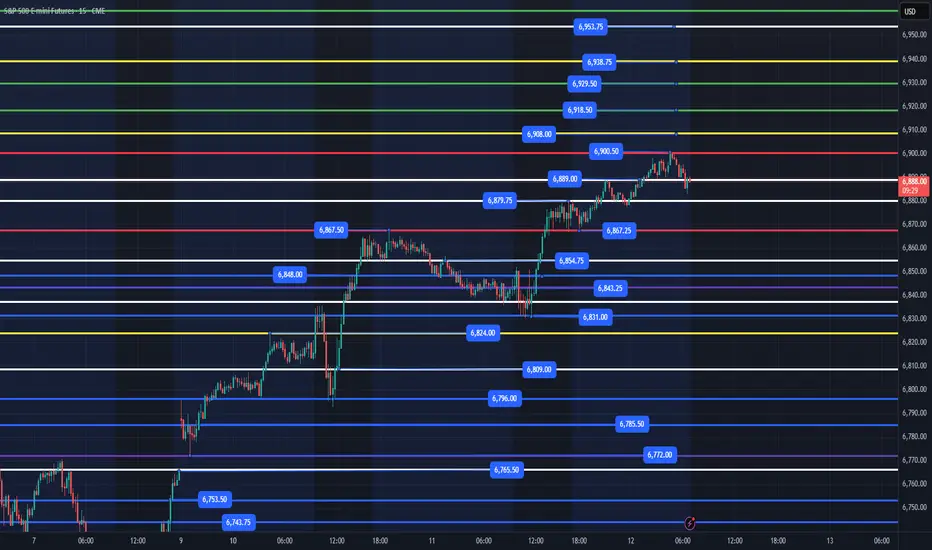
Key Levels Today -
1. Loss of 6867 and reclaim
2. Loss of 6831 and reclaim
3. Loss of 6796 and reclaim
4. Loss of 6772 and reclaim (possibly as low as 6765 to close the gap)
5. Loss of 6743 and reclaim (possibly down to 6731)
Below those areas and we will most likely need to retest 6654. Price needs to clear 6900 to continue higher with 6918, 6929, 6938, 6953+ being the immediate targets higher.
Key Support Levels - 6889, 6879, 6867, 6854, 6848, 6831-36, 6824, 6809, 6796, 6772, 6765
Key Resistance Levels - 6900, 6908, 6918, 6929, 6938, 6953
We are in a tight range overnight and I still think we need to lose 6867 and reclaim for us to move above 6900. We could easily lose 6889 or 6879 and reclaim to move higher, but those are very micro reclaim levels that I do not like to engage as most liquidity (stops) should be below 6867.
I will post an update around 10am EST
----------------------------------------------------------------------------------------------------------------
Couple of things about how I color code my levels.
1. Purple shows the weekly Low
2. Red shows the current overnight session High/Low (time of post)
3. Blue shows the previous day's session Low (also other previous day's lows)
4. Yellow Levels are levels that show support and resistance levels of interest.
5. White Levels are previous day's session High/Low
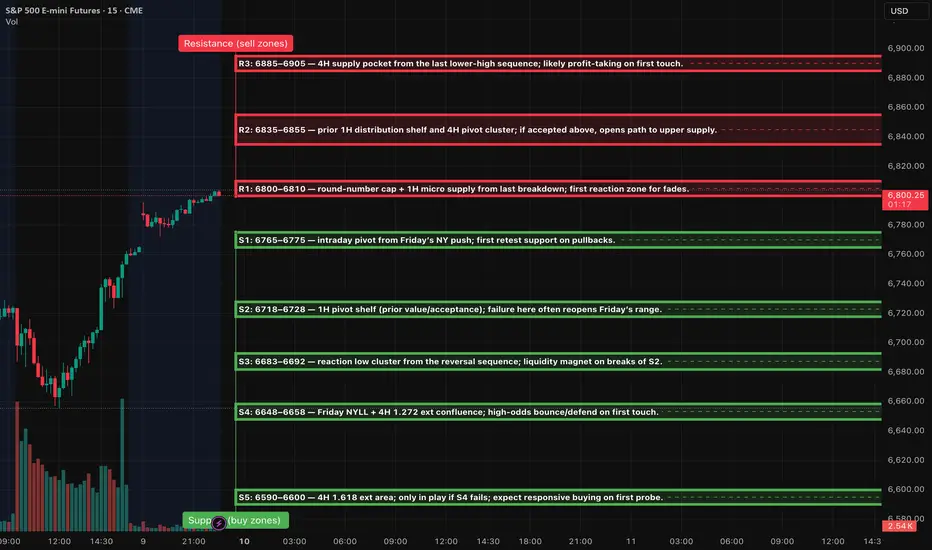
ES (SPX, SPY) Week Ahead Analysis, Levels (Nov 10th - 14th)Context (HTF)
Price action has shown a notable rebound from the 6655 level, currently approaching the 6800 to 6810 range, which is characterized by recent supply identified on the 1-hour and 4-hour charts. Despite the ongoing lower-highs structure observed on the 4-hour timeframe, momentum appears to be shifting positively following Friday’s significant low. Traders should anticipate a period of two-way trading early in the week, likely within the 6650 to 6850 corridor, until mid-week economic data provides clearer direction.
Setups (Level-KZ Protocol 15/5/1)
1) Rejection Fade @ 6800–6810 (Tier-1 if first touch)
15m rejection back inside → 5m re-close below with LH → 1m first pullback fail.
Entry: 6798–6808 on 1m fail. SL: 15m wick-high +0.25–0.50.
TP1: 6768–6775 (S1). TP2: 6723 (S2). Viability gate: TP1 ≥ 2.0R using the 15m-wick stop.
2) Acceptance Continuation > 6810
15m full-body close above → 5m pullback holds 6805–6810 → 1m HL entry.
Entry: 6808–6812. SL: 6794–6798 (15m wick).
TP1: 6838–6848 (R2). TP2: 6885–6905 (R3). No trailing before TP2; at TP1 close ~70%, set runner to BE.
3) Quick-Reclaim Bounce @ 6765–6775 (Tier-2)
Sweep S1 → instant reclaim on 5m → 1m HL.
Entry: 6767–6774. SL: 6756–6759.
TP1: 6798–6810. TP2: 6835–6845.
4) Exhaustion Flush Bounce @ 6648–6658 (Tier-3)
Capitulation wick into S4 → 5m reversal signal → 1m HL.
Entry: 6651–6657. SL: 6639–6642.
TP1: 6686–6692. TP2: 6718–6728.
What can move ES this week (keep risk light around release windows)
• Tue (Nov 11): Veterans Day — equities open, U.S. bond market closed; liquidity can be thinner.
• Thu (Nov 13, 8:30 ET): October CPI.
• Thu (Nov 13, 8:30 ET): Initial jobless claims (weekly).
• Fri (Nov 14, 8:30 ET): October PPI and Advance Retail Sales.
• Fed speakers/boards: See the Fed’s official calendar for any added talks this week.
• Earnings of note: Several large caps report mid-week (e.g., Cisco; Disney). Expect single-name volatility spillover.
Notes for execution: mark the zones on 15m; wait for your 15→5→1 confirmation sequence; enforce the 2.0R viability gate using the 15m wick stop; no partials before TP1; max two tries per level.
ES (SPX, SPY) Analysis, Levels, Setups for Wed (Nov 12)Price closed near the prior week’s highs after a clear four-hour impulsive leg from last Friday’s low. Momentum appears constructive while the 15-minute swing structure holds higher lows above the New York value shelf.
Setups:
Play A — Acceptance Long: Wait for a 15m full-body close ≥6,900 and a 5m pullback that holds ≥6,892–6,895. Enter on a 1m HL reclaim. Hard SL = 15m trigger-wick low minus 0.25–0.50. TP1 6,915. TP2 6,935. TP3 6,955–6,975. Viability gate: TP1 must be ≥2.0R versus the 15m stop.
Play B — Rejection Fade: If 6,900–6,915 rejects with a 15m close back inside ≤6,889, enter on a 5m re-close lower and a 1m LH. Hard SL = 6,905–6,912 (above rejection wick). TP1 6,872. TP2 6,852. TP3 6,839→6,810 if momentum accelerates.
Bias & Invalidation: Bias is mildly bullish while 6,865–6,872 holds on 15m closes. Bias flips neutral-to-bearish on decisive 15m body-through below 6,839.
Kill-Zones (ET): NY AM 09:30–11:00 for entries. Manage through Lunch. NY PM 13:30–16:00 for follow-through or fades into exhaustion.
News & Events (tomorrow): No CPI risk on the docket. Watch the U.S. 10-Year Note auction around 13:00 ET and headline risk from the OPEC and IEA monthly oil reports in the morning; both can sway rates and index tone.

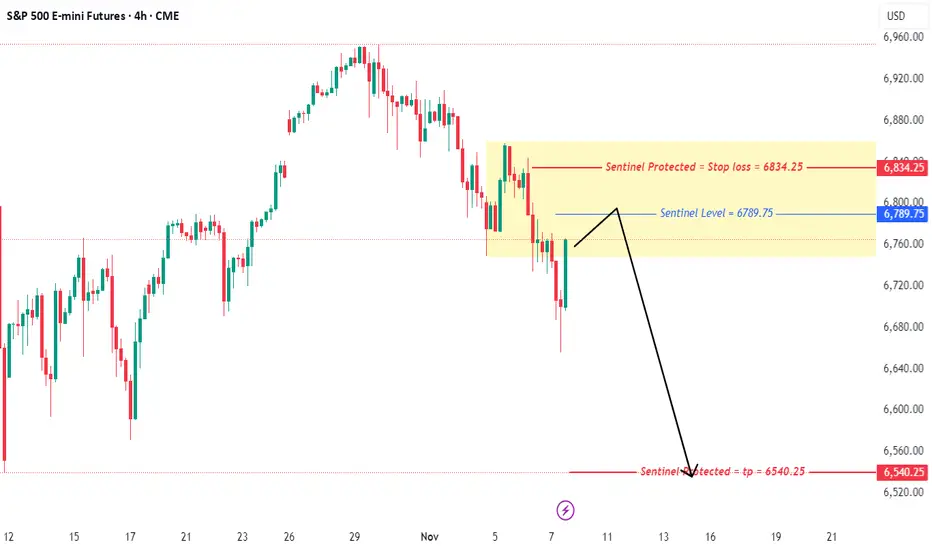
Follow through to the upside is expectedFollow through to the upside is expected for the daily chart of the S&P 500. The next objective to the upside 6885.

S&P500/ES Intraday Trade Idea VideoThoday I see a potential trade setting up in the S&P500 Futures.
My overall thesis is to the upside, so no Shorts today. Unless we come up to the first resistance level, or even beter, the 1/4 line. From there I'll be willing to risk some of my money.
Long option 2:
From the CIB or Centerline, after a pullback to these lower levels.
Happy Monday all §8-)

ES - November 11th - Daily Trade PlanNovember 11th- Daily Trade Plan - 8:45am
*Before reading this trade plan, IF, you did not read yesterdays, or the Weekly Trade Plan take the time to read it first! (You can see both posts in the related publication section) *
If my posts provide quality information that has helped you with your trading journey. Feel free to boost it for others to find and learn, also!
My daily trade plan and real-time notes that I post are intended for myself to easily be able to go back and review my plan and how I did from an execution perspective.
--------------------------------------------------------------------------------------------------------
I was off my desk yesterday and I am now catching up for this week.
Overnight Low is 6836 and the Overnight High is 6867. We have been moving sideways since 1pm yesterday in this range and we must respect the short-term trend that is bullish. We still have the 6765-level gap that needs to be filled at some point. We have CPI & PPI this week, so I do expect some volatility.
Key Levels Today -
1. Loss of 6836 and reclaim
2. Loss of 6796 and reclaim
3. Loss of 6772 and reclaim (possibly as low as 6765 to close the gap)
4. Loss of 6743 and reclaim (possibly down to 6731)
Below those areas and we will most likely need to retest 6654. Price needs to clear 6878 to continue higher and change the macro trend.
Key Support Levels - 6836, 6824, 6809, 6796, 6772, 6765, 6753, 6743, 6731, 6710, 6695
Key Resistance Levels - 6854, 6867, 6885, 6893, 6908
We are in a tricky spot as you have short term resistance at 6847 then 6854 and 6867. Ideally, we can lose 6836 down to 6824, 6809 and then reclaim those levels to move higher.
I will post an update around 10am EST
----------------------------------------------------------------------------------------------------------------
Couple of things about how I color code my levels.
1. Purple shows the weekly Low
2. Red shows the current overnight session High/Low (time of post)
3. Blue shows the previous day's session Low (also other previous day's lows)
4. Yellow Levels are levels that show support and resistance levels of interest.
5. White Levels are previous days session High/Low

Greedy Short Gone Wrong | Day 66 Trading S&P FuturesI started the day strong, shorting the 6830 resistance level for quick profits — but got greedy and went for more at 6852, thinking the market couldn’t push higher.
It did. I got squeezed, gave back all my gains, and ended the day basically flat.
Some days remind you: the market doesn’t owe you anything.
VX Algo had 4 out of 5 clean signals today — structure nailed the direction early.
Tomorrow’s levels: Above 6810 bullish, below 6780 bearish.

Do you get Deja vu?Some say that history is repeating itself according to the dot-com bubble and the nifty fifty crash that led to a dark period in the US market. Why are we scared that the same situation will happen again? For starters, The Mag 7 who is consisted of the seven biggest company of the S&P 500 have a combined market cap of 22 trillion, which mean around 35-37% of the whole index… In fact, the same thing happened before the dot-com crash and the nifty fifty catastrophe. They were traded 40 times their valuations, so the price-to-earning ratio wasn’t considered healthy. Plus the biggest companies in the Nifty fifty composed of around 25% of the entire S&P.
But… The dot-com crash was a lot due to many start up being invested in and not giving the merchandise they should’ve, leading to many bankruptcy. The Nifty fifty was composed of businesses that people thought were untouchable, like McDonald’s, Coca-Cola, Polaroid, Disney and more. A bunch of people invested blindly in those businesses thinking they’ll just never stop growing… but those company could not innovate anymore. So once they showed lower than expected gains months after months they couldn't do anything else than watch people leaving with the pedal to the metal which led to atrocious losses.
Now, do we have the same pattern? It is true that the Mag7 is taking a huge chunk of the S&P, as they should, but can we anticipate a sell off?
If you analyze the facts; Businesses invest billions day after day into AI companies who can boost their platform and propel them in front of the innovation race. We can’t stop being amazed by every giant step they take in AI automatization and in the progress of the LLMs. Months after months those companies innovate and give back to their investor an excellent ROI. They expand and try to see what’s gonna be the next best thing and come out on top. Tech is not the same as those nifty fifty and dot com businesses who were over traded (which is a misconception, cause the Mag7 is also “over traded” but it is just a indicator of high liquidity and investor interest not necessarily an imbalance in their whole market value.) But i still mention it cause it is a an argument many people employ.
So ask yourself: is what’s happening with AI the same as the nifty fifty or the dot-com bubble, or did AI just took the S&P, those Mag7 companies or should i just say the world to an other level?
I guess only time will tell, till then,
Your friendly day trader,
Esteban.

ES (SPX, SPY) Analysis, Key Levels, Setups for (Nov 11th)S (Dec) Plan for Tue, Nov 11 — Level-KZ Protocol (15/5/1).
Bias is constructive while trading above the 6,838–6,845 range; the first test into 6,880–6,900 serves as a decision point. Thinner liquidity is expected around the U.S. holiday, so execute trades only within NY kill zones.
Setups (trade the level → next level; 15m→5m→1m sequence)
Long — Bounce at 6,838–6,845: sweep/quick-reclaim → 5m re-close → 1m HL entry. Hard SL below 6,830 wick. TP1 6,872–6,880, TP2 6,900, TP3 6,930. Viability gate: TP1 ≥ 2.0R.
Long — Acceptance above 6,900: full 15m body close >6,900 → hold the retest → 1m HL. SL below trigger wick. TP1 6,930, TP2 6,955–6,970, runner eyes weak-high cleanup.
Short — Rejection fade 6,900–6,930: wick through → 15m close back below 6,895 → 5m LH. SL above session high. TP1 6,872, TP2 6,845, TP3 6,805; lose 6,805 and momentum can slide toward 6,770 then 6,733.
News & session conditions (ET)
U.S. Veterans Day — equities open; U.S. bond market closed; U.S. macro slate is light. Overnight focus: NZ inflation expectations (evening ET), U.K. Labour Market (pre-London), Germany ZEW (pre-NY). Expect patchy liquidity around the holiday; be strict with the 2R viability gate and trade only inside NY AM/PM kill-zones.

ES UpdateTrying to break through the resistance line, not sure what's gonna happen tonight.
Open gap always makes me bearish, so I did not go long again after I dumped my calls on open. Just waiting for MFI to get overbought so I can buy puts. Guessing that will happen by Wed open.
Not sure why foreign markets gapped up because of the shutdown ending, and the market didn't tank because of the shutdown so there's really no reason for it to rally now that it's ending..... so I'm expecting a pump and dump.
Sorry, no arrows today.

Rest day on Friday.After the volatile move to the downside on the daily chart in the S&P 500 on Thursday, the expected behavior for Friday is a rest day which result in Friday's daily range inside of the range from Thursday.


ES - November 7th - Daily Trade PlanNovember 7th- Daily Trade Plan - 7:50am
*Before reading this trade plan, IF, you did not read yesterdays, or the Weekly Trade Plan take the time to read it first! (You can see both posts in the related publication section) *
If my posts provide quality information that has helped you with your trading journey. Feel free to boost it for others to find and learn, also!
My daily trade plan and real-time notes that I post are intended for myself to easily be able to go back and review my plan and how I did from an execution perspective.
--------------------------------------------------------------------------------------------------------
Overnight low is 6715 and high is 6771. We have continued to create lower lows and as I have mentioned all week, we are getting close to the 6690 bigger trend breakdown. I do think today we have some good levels to grab some points and could produce a nice short squeeze.
Key Levels Today -
1. Loss of 6715 and reclaim
2. Loss of 6703 and reclaim
3. Loss of 6696 and reclaim
4. Loss of 6690 (maybe down to 6683 and reclaim).
Key Support Levels - 6711, 6703, 6696, 6690, 6683, 6675, 6666
Key Resistance Levels - 6726, 6732, 6742, 6749, 6755, 6766, 6771
Until price creates a higher high, I have to defer to the current micro trend which is the probability of price to continue lower. IF we lose 6690 and cannot reclaim 6785, we could melt down next week.
I will post an update around 10am EST.
----------------------------------------------------------------------------------------------------------------
Couple of things about how I color code my levels.
1. Purple shows the weekly Low
2. Red shows the current overnight session High/Low (time of post)
3. Blue shows the previous day's session Low (also other previous day's lows)
4. Yellow Levels are levels that show support and resistance levels of interest.
5. White Levels are previous days session High/Low

S&P500: Rebound S&P 500 futures managed to stage a modest rebound in yesterday’s session and are now showing renewed upward momentum. In our primary scenario, we expect magenta wave (5) to continue climbing and to ultimately mark a final high that completes the larger blue wave (III). Afterward, we anticipate a corrective phase via magenta wave (A), which should pull the index toward support at 6,371 points. However, if prices drop directly below the 6,371 points support, our alternative scenario will come into play. In that case, the alternative wave alt.(4) would likely extend further downward, finding its low within the magenta alternative Target Zone between 6,055 and 5,822 points.

ES (SPX, SPY) Analysis, Key-Zones, Setups for Thu (Nov 20th)Market Bias Analysis
The current short-term bias is constructively bullish, yet it remains contingent on upcoming events. Recent momentum has been bolstered by Nvidia's exceptional earnings report and a significant intraday reversal in the E-mini S&P 500 (ES). As long as the 6,670–6,680 range holds during any pullbacks, the path of least resistance appears to be upward. It is important to note that the broader daily trend is still bullish, unless we see a decisive breach below the key demand zone of 6,520–6,510 in the ES.
Market Overview
In a notable shift following a four-day decline, today's trading session exhibited a renewed bullish sentiment. The E-Mini S&P 500 (ES) printed a robust green daily candle, bouncing off a low of approximately 6,622.00 yesterday to close near 6,740.
From a technical perspective, the daily chart reveals that the recent selloff has established a lower high without breaking the prior significant higher low. The reaction low remains comfortably above the daily 1.272 extension cluster situated around 6,521.25. On the 4-hour chart, the price action has transitioned from a pattern of lower lows to a new higher low, currently pushing into the Price Quotient Median (PQM) and Price Quotient High (PQH) band, just below previous 4-hour supply levels. Observing the 1-hour chart, today's trading reflected a definitive trend day upward, characterized by a consistent series of higher lows and higher highs, culminating the session near the 1-hour 1.272 Fibonacci extension at 6,743.75.
Macroeconomic factors played a crucial role in this market turnaround, particularly after Nvidia reported stunning Q3 earnings that exceeded expectations, generating approximately $57 billion in revenue. The company’s strong AI-driven outlook and positive after-hours performance alleviated concerns that the recent downturn in technology stocks signified the onset of a broader unwinding of the AI bubble. This development contributed to a rally in index futures as the session drew to a close.
Nonetheless, the overarching theme remains one of valuation pressures and interest rate concerns. Despite breaking a four-session losing streak, market participants are poised for tomorrow’s data, which will be pivotal in shaping the Federal Reserve's policy trajectory moving forward.
Scheduled Events (Tomorrow – Thursday, Nov. 20, 2025)
Tomorrow’s docket is heavy and directly relevant for ES:
• 8:30 a.m. ET – September Employment Situation (delayed jobs report)
The September nonfarm payrolls and unemployment rate, postponed by the government shutdown, are finally released. This is the only full jobs report the Fed will have before its December meeting, and markets are treating it as a major verdict on the labour market.
• Other U.S. data (during the morning/early afternoon)
Various calendars flag building permits / housing data, regional manufacturing (e.g., Philadelphia Fed), and existing home sales clustered through the U.S. session – all secondary to the jobs report but able to add fuel if they confirm or contradict the labour story.
• Fed speakers / meetings
• Chicago Fed President Austan Goolsbee has a scheduled fireside chat around midday (12:40 p.m. ET).
• The Fed also has a closed Board meeting at 1:15 p.m. ET and a two-day Cleveland Fed financial-stability conference that can generate headlines.
Net: the jobs report is the main event; Fed comments will colour the move rather than drive it on their own.
Setups (A++ Concepts)
These are two high-conviction, rule-style ideas you can plug into your own framework. Price levels are exact from your charts.
A++ Setup 1 – Continuation Long from Value Pocket
Entry trigger concept:
Look for a sweep into the chosen band (e.g., wick into 6,690–6,695 or down into 6,663–6,668) followed by a strong 15m/5m bullish close back above 6,700. That shows buyers defending value and rejecting a deeper rotation into S3.
Risk / invalidation:
Structural invalidation if ES closes the hour below 6,652.50 (Y-POC) and cannot reclaim 6,668. In practice, a tight stop can sit just under 6,652.00 if entering from 6,690–6,705, or under 6,645.00 if using the deeper S2 pocket.
Targets:
• TP1: 6,743.75 (1H 1.272)
• TP2: 6,777.00 (1H 1.618)
• TP3: 6,813.50 (1H 2.0)
---
A++ Setup 2 – Short Fade from 1H Extension Cluster
Entry zone:
Primary sell pocket: 6,777.00–6,813.50
(1H 1.618 to 2.0 extension cluster.)
Risk / invalidation:
Structural invalidation above 6,825–6,830 (clear 1H/4H acceptance beyond the 2.0 extension).
A practical stop can sit around 6,828.00 if entering inside the band.
Targets:
• TP1: 6,743.75 (1H 1.272 / prior extension)
• TP2: 6,683.50–6,690.00 (NYPM high / S1 top)
• TP3: 6,659.00–6,664.75 (VWAP/value pocket S2)
Narrative:
If Nvidia’s beat triggers a euphoric push straight into the upper fib level but the tape immediately rejects that strength, the market is saying “good news already in the price.” This setup expresses the view that the real gravity is lower, back toward value and potentially into S3 if macro data disappoint.

Momentum on the buy sideThere is by side momentum to the upside in the S&P 500 daily chart. Continuation is expected with the next objective to the upside of 6770.

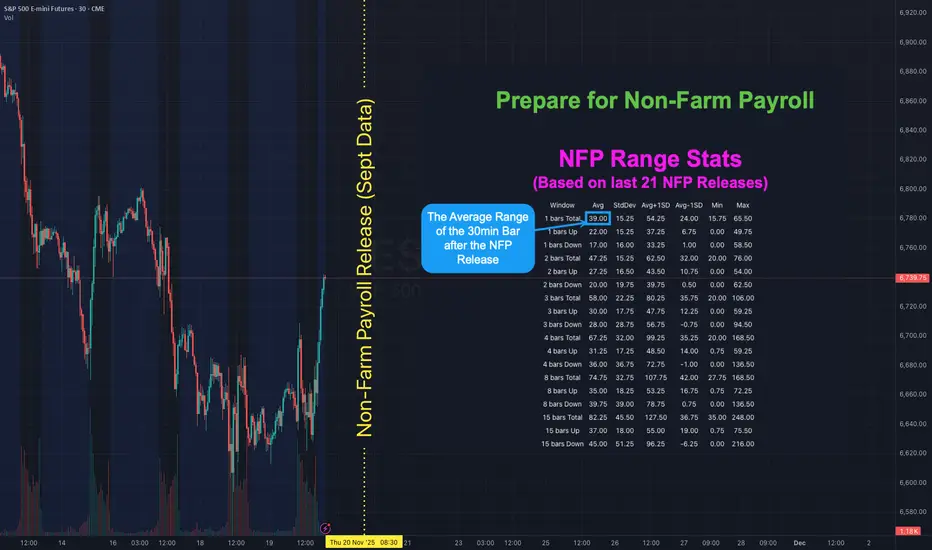
NFP is Back! Here's how to map out your playbook with statsHOW TO USE NFP RANGE STATS TO PREPARE YOUR PLAYBOOK
There has not been a Non-Farm Payroll release since Friday 5 September 2025 . Due to the government shutdown the September report that was originally set for Friday 3 October was postponed. It will finally be released on Thursday 20 November - a 48 day delay. With uncertainty around the labour data higher than usual it helps to know what “normal” looks like for ES S&P Futures. The table shows historical ranges after the 08:30 ET release on a 30-minute chart: 1 bar (30mins), 2 bars (60mins) 3 bars (90mins), 4 bars (2hrs), 8 bars (4hrs) and 15 bars (up to ~16:00 ET). The stats are based on the last 21 NFP releases (approx 2-years).
👉 If you think this would be useful as a script you can run yourself let me know (boost and drop a comment) and if there's enough interest I'll see if I can publish something.
WHAT THE COLUMNS MEAN
Avg - the typical move for that window based on past NFPs
StdDev - the variability around that average
Avg + 1 StdDev and Avg - 1 StdDev - quick upper and lower guardrails for a “normal” day
Min / Max - historical extremes in the sample
WAYS TO USE IT
1) Set guardrails for price discovery
Use Avg + 1 StdDev as a first “stretch” expectation for the window you trade. If price pushes beyond that level early you know we are outside normal and can adapt position size and expectations.
2) Pre-plan targets and emergency exits
Before 08:30 ET map a base scenario. Example for ES: if the 30m Avg post-release is X then a first take-profit can sit near X and a stretch target near Avg + 1 StdDev . Place an emergency stop beyond the Avg - 1 StdDev line if fading the first move.
3) Size positions to volatility
Translate the Avg 30m range into ticks or points and size so that a typical NFP bar does not exceed your defined risk. If your stats say the first 30m averages 9 points on ES do not run a size that cannot survive a 9-12 point swing.
4) Choose a playbook by window
1 bar (30m) - breakout or first-reaction mean-reversion
2-4 bars (60-120m) - continuation or reversal probabilities stabilise around the Avg envelope
8-15 bars - when the full session range is already at or beyond Avg + 1 StdDev be cautious chasing late moves
With the report 48 days late the probability of surprise is elevated. Go into the print with your ranges pre-mapped and your position sizing tied to those Avg and Avg ± StdDev bands. Clarity beats adrenaline.
👉 REMINDER:
If you think this would be useful as a script you can run yourself let me know (boost and drop a comment) and if there's enough interest I'll see if I can publish something.
The Truth About Timeframe Analysis (No One Wants to Tell You)*You’re not confused because the market is chaotic.
You’re confused because your framework is garbage.*
🔥 Timeframes Don’t Lie — But Traders Do
Let’s be real:
You jump between timeframes looking for “confirmation,”
but all you’re really doing is collecting excuses.
1H looks bullish
15M looks like a breakout
4H is pulling back
5M is breaking structure in the opposite direction
Now you have five different opinions in your head
and exactly zero conviction.
You hesitate.
You enter late.
You get trapped.
You flip bias like a rookie.
This isn’t “market randomness.”
It’s simply a lack of hierarchy.
⚡ The Market Isn’t Messy. YOUR PROCESS Is Messy.
Every timeframe gives you a “mini truth.”
Without structure, you mix them together into something that feels like analysis…
but is actually noise dressed as logic.
That’s why you keep:
❌ trading micro signals against macro structure
❌ believing every candle is a reversal
❌ ignoring invalidations because you “like the setup”
❌ frying your brain before you’ve even risked a dollar
You don’t need another indicator.
You need a logic system that crushes noise and exposes REAL probabilities.
🔥 The 3 Variables (The Part Traders Think They Understand… But Don’t)
Most traders “kind of” know what trend, zones, and candles are.
And “kind of” is exactly why they lose.
In this model, each variable has a precise definition, variations, and probability weights that change depending on the context.
You’re not reacting emotionally — you’re measuring.
That’s what makes the system mechanical.
1️⃣ Trend — The Market’s Actual Intent (Not Your Guess)
Definition:
The structural direction defined by higher timeframes — not the last 3 candles on 5M.
Variations:
Strong trend
Weak/aging trend
Neutral compression
Context impact:
A strong trend entering a strong zone with a confirming candle = high probability.
A tired trend hitting a counter zone = danger.
👉 Trend isn’t “up or down.”
It’s how mature and healthy that direction is.
2️⃣ Zone — Where the Real Decisions Are Made
Definition:
Price areas that actually matter: supply, demand, break/retests, major SR.
Variations:
Fresh zone (strongest)
Retested zone (usable)
Overused zone (dead)
Context impact:
Zones inside dominant trend → continuation setups
Zones against dominant trend → only valid with strong multi-timeframe alignment
Zones broken on mid-timeframes → bias must be re-evaluated
👉 Zones aren’t lines.
They’re probability clusters.
3️⃣ Candle — The Signal That Confirms… or Invalidates Everything
Definition:
The micro-expression of intent: rejection, displacement, absorption, continuation.
Variations:
Rejection wick
Displacement/imbalance
Compression
Fake strength traps
Context impact:
A “strong candle” in a weak zone means NOTHING.
A clean rejection + structure shift inside a strong zone + aligned trend = top-tier entry.
👉 Candles are not signals by themselves.
They’re filters.
💥 The Edge Isn’t the Variables — It’s Their Alignment
Anyone can draw zones and identify candles.
Losing traders do it every day.
The real edge comes from understanding:
how each variable shifts with context
how its probability weight changes
how alignment creates high-probability setups
how misalignment warns you to STOP IMMEDIATELY
Once each variable has a precise meaning
and precise behavior inside each context…
The system becomes mechanical.
No more emotional gambling.
No more “I think this is a reversal.”
No more overthinking.
Just one rule:
If the variables align → execute.
If they don’t → wait.
📶 The Only Timeframe Hierarchy That Makes Sense
📌 High Timeframes (4H / 1H)
→ Define true market bias
→ Only overridden by strong opposite confluence
📌 Mid Timeframes (30M / 15M)
→ Confirm or challenge the bias
→ Can create valid setups if rules align
📌 Entry Timeframes (10M / 5M / 2M)
→ Execution only
→ No bias allowed here
This structure kills FOMO, kills hesitation, and kills the “I changed my mind” syndrome.
🚀 The Two Setups That Actually Pay
1️⃣ Precision Setups (Low-Risk / High-Accuracy)
1:1 to 1:2
Clean, frequent, reliable.
2️⃣ Momentum Setups (When Everything Aligns)
1:3+
Rare — but violent and highly profitable.
If you’ve ever seen the market move exactly as you forecasted…
That was confluence.
You just didn’t know how to replicate it.
💀 Stop Trading Noise. Start Trading Probability.
This model does NOT eliminate all losses.
It eliminates the avoidable, stupid ones caused by emotional reactions and inconsistent bias.
Give me 10 trades executed under true confluence,
and the results explain everything.
📣 Want Chapter 2?
I’ll break down the full confluence model and the exact rules that make it repeatable.
Follow me here on TradingView,
save this idea,
and comment “CH2” if you want the next release.
More coming soon —
but only for the people actually paying attention.
Day 73 — Perfect Rejection at the 2-Hour MOB | S&P Futures TradiEnded the day +$529.40 trading S&P Futures. Today was a solid bounce back, with the morning analysis playing out almost perfectly. I managed to catch the top of the day and ride the momentum down right as we rejected the 2-hour MOB. It felt good to be in sync with the market structure, especially with the volatility leading up to the Nvidia earnings release. The signals were clean, the execution was sharp, and it was just one of those days where the plan came together.
🔑 Key Levels for Tomorrow
Above 6725 = Bullish Below 6710 = Bearish
📰 News Highlights
NVIDIA SHARES JUMP 5% AFTER 4Q REVENUE OUTLOOK TOPS ESTIMATE
