ES (SPX, SPY) Analysis, Levels, Setups for Wed (Nov 26)Market Overview
The equity markets are currently facing a pivotal moment. The E-mini S&P 500 (ES) has made a significant rebound from the daily low around 6,520, approaching robust resistance levels formed by the highs of the previous week and yesterday. Both daily and 4-hour charts reveal a consistent pattern of higher lows emerging from a recent trough. However, the price now finds itself just beneath a key distribution cap and Fibonacci extension zone, estimated between 6,810 and 6,888. The daily momentum oscillator has shifted upward from an oversold position and remains at a mid-range level, indicating that while it is not yet overbought, the general trend still favors buying the dips, provided that crucial support levels are maintained.
Meanwhile, the Nasdaq 100 (NQ) mirrors this momentum, hovering near its New York Pre-Market (NYPM) peak. Recent gains have been bolstered by impressive earnings from Nvidia, highlighting the ongoing AI narrative, even as concerns about a potential market bubble begin to emerge, with NVDA's stock showing signs of volatility.
Events & News for Wednesday 26 Nov (Pre-Thanksgiving)
Wednesday is a data-heavy session in the U.S., and it’s also the last “normal” day before the Thanksgiving holiday liquidity vacuum. Expect volatility spikes and potential regime shifts around:
• 08:30 ET – Weekly jobless claims plus a cluster of delayed October releases: durable goods orders, trade balance/wholesale data, personal income & core PCE inflation, and related indicators.
• 10:00 ET – New home sales and other housing-related data.
• 10:30 ET – EIA crude oil inventories (can move risk sentiment via energy/curve).
• 14:00 ET – Fed Beige Book, giving an updated regional read on growth and inflation ahead of December’s FOMC meeting.
In addition, the BEA has postponed the Q3 GDP second estimate that had been scheduled for this week, so markets are leaning more heavily on the data above for macro guidance.
Net takeaway: 8:30 ET is the main volatility window, with a second impulse risk at 10:00–10:30 and potential trend extension or reversal into the NY morning kill-zone.
Key Zones (ES Z-25, based on current structure)
Immediate Resistance
• R1: 6,790–6,795
NYPM High / Prior Day High cluster (NYPM.H 6,792.5, PDH & Y-VAH 6,792.5). Sellers have defended this intraday band so far; it’s the lid of today’s range.
• R2: 6,805–6,815
1H fib extension 1.272 (≈ 6,810.25) plus likely PWH vicinity. First HTF extension above today’s range; a clean “stop run & decision zone” if 6,795 breaks.
• R3: 6,840–6,850
1H fib extension 1.618 (≈ 6,847.25). If buyers punch through R2, this is the next logical magnet and a strong candidate for an exhaustion spike on good data.
• R4: 6,880–6,900
1H fib 2.000 (≈ 6,888) and prior daily swing-high area. That whole 6,888–6,900 pocket is a big-picture objective and, for now, a likely “weak high” that could attract a stop run but also host the first serious counter-trend attempts.
Support / Demand
• S1: 6,765–6,775
Yesterday’s POC (~6,769.5), NY lunch high/NYL.H (6,774.25), and top of the 1H consolidation shelf. As long as the market keeps closing above this band on 15–60m, the short-term uptrend remains intact.
• S2: 6,720–6,735
Y-VAL 6,720.5, LO.H 6,721.5, ONH 6,732.5. This is the top of the prior value area and a natural “buy-the-dip” location if 6,770 gives way on data noise.
• S3: 6,670–6,705
NYAM.L 6,674.5, IB Low 6,674.5, ONL 6,701.75, plus current LOL 6,701.75. If we get a deeper flush, this is the primary intraday demand band where bulls must step back in to preserve the recent trend from the daily low.
• S4: 6,560–6,580
PDL 6,574.5 and top of the larger daily discount block. A break and sustained acceptance below here would open the door for a much larger retrace back toward the 6,520–6,420 HTF discount zone (daily 1.272/1.618 fibs).
Market Outlook: Bias & Forecast (Overnight → NY Session)
Structural Bias:
The prevailing market sentiment remains bullish as long as the E-mini S&P 500 (ES) sustains its position above the support range of 6,720–6,735 on a closing basis. The likely trajectory indicates a probing towards the 6,810–6,850 extension band. While the recent rally shows signs of being extended, it has not yet reached a point of definitive exhaustion, pointing towards a “late-stage impulse” rather than a confirmed top.
Overnight → London Session:
The base case anticipates a sideways-to-moderately downward movement from the 6,790s back toward the support levels of S1/S2 (6,765 → 6,730). This move aims to address intraday imbalances without disturbing the overall market structure. Should liquidity be limited, there may be an attempt during the London session to trigger stops through today's highs, directing attention towards resistance levels R2 (6,805–6,815) ahead of the New York session's developments.
New York AM Session (8:30–11:00 ET):
Should robust data emerge—indicating a favorable economic climate with subdued core Personal Consumption Expenditures (PCE) and steady labor claims—this is likely to spark a rally through R1 towards R2/R3, targeting 6,810 and subsequently 6,847 as key upside magnets. Conversely, a negative surprise featuring weak growth, a troubling inflation mix, or a risk-off sentiment evident in the Beige Book later in the day could dramatically alter the market landscape, potentially driving a liquidation toward support levels S2/S3, or in case of an unexpected shock, even probing S4 over the coming 24 to 48 hours.
In the near term, the expectation leans towards a gradual upward movement with shallow pullbacks, aiming for the 6,810–6,847 range. However, traders should remain vigilant for an increased risk of an exhaustion spike and a possible intraday reversal as this target zone is approached.
A++ Setups for Tomorrow
A++ Setup 1 – Trend Long from Retest of 6,730–6,770
Trigger:
Price trades down into 6,730–6,770 (S1/S2 overlap) either overnight or on the 8:30 data flush.
15m prints a higher low and closes back above ~6,755, reclaiming the mid-range.
5m confirms with a clear reclaim and hold of 6,760–6,770, then a higher low on 1m.
Entry Zone: 6,760–6,775 on a clean pullback after reclaim (not the first knife-catch wick).
Initial Stop: Below 6,720, tucked beyond Y-VAL/LO.H and the pullback low (≈ 35–45 pts risk depending on your exact fill).
Targets:
• TP1: 6,810–6,815 (R2 / 1.272 fib).
• TP2: 6,840–6,850 (R3 / 1.618 fib).
• Stretch: 6,880–6,900 (R4 / 2.0 fib) if data and risk sentiment stay supportive.
A++ Setup 2 – Exhaustion Short from 6,847–6,888
Trigger:
Impulsive move into 6,847–6,888 during NY AM or early PM, ideally on or shortly after 8:30 data.
15m candle shows rejection (long upper wick) and closes back below ~6,847.
5m prints a lower high under that rejection high, and 1m fails to make new highs on retests.
Entry Zone: 6,845–6,865 on the first proper lower-high after the rejection (avoid shorting the exact wick; let the LH print).
Initial Stop: Above 6,900, beyond the 2.0 fib and psychological round number (≈ 35–45 pts risk).
Targets:
• TP1: 6,790–6,795 (R1 / NYPMH/PDH cluster).
• TP2: 6,760–6,770 (S1 pivot band).
• Stretch: 6,720–6,735 (S2 / top of value) if selling pressure persists.
Trade ideas

ES - Week 48 15min timeframeT.A explained -
BackSide (BS)
FrontSide (FS)
Inverse BS (Inv.BS)
Inverse FS (Inv.FS)
BS & FS levels are expected support when dashed lines, tested when dotted and resistance when solid lines.
The inverse is true for the Inv. BS Inv. FS levels, they are resistance as dashed lines, tested as dotted and support as solid lines.
Monthly timeframe is color pink
weekly grey
daily is red
4hr is orange
1hr is yellow
15min is blue
5min is green if they are shown.
strength favors the higher timeframe.
2x dotted levels are origin levels where trends have or will originate. When trends break, price will target the origin of the trend. its math, when the trend breaks, the vertex breaks too so the higher timeframe level/trend that breaks, the more volatility there could be as strength in the orders flow in to fuel the move.

ID: 2025 - 0136.12.2025
Trade #13 of 2025 executed.
Trade entry at 162 DTE (days to expiration).
Excellent fills this morning, well under mid. Created a GTC working order two days ago and let price come to me. No chasing. There are TONS of external liquidity voids resting below.
Target profit is 5% ROI
Happy Trading!
-kevin

E mini S&P 500 weekly outlook and HTF reference pointsCME_MINI:ES1!
Expansion levels on ES. Will approach on a day to day basis with the daily closures

Monday could set the tone for the weekMonday's price structure in the S&P 500 daily chart could set the tone for the rest of the week. Expected behavior from Monday is an inside day which means it trades inside the Ranger Friday the higher. The next objective to the upside is 6770.

The end - 2026 Financial panicSince 2300, I’ve marked a zone and made a personal commitment: no matter what happens in the market, when this zone is approached, I will begin reducing my exposure and carefully exit all financial markets—with extreme caution and tight stop losses.
Yesterday, I received an alert I never expected to see. It signaled the approach of the zone I identified back in 2021 as the escape point—where major crashes are likely imminent and the urge to invest must be resisted.
This zone aligns with the 0.786 trend-based Fibonacci level from the 2009 bottom to the 2020 peak, as well as the April 2020 bottom. It also coincides with the 2.618 and 3.618 Fibonacci extensions from the 2007–2010 cycle, and the 3.618 trend Fibonacci from the 2002–2009 cycle. But that’s not all.
According to Gann’s Square of 9, if you examine closely, you’ll notice that whenever the trend reaches one of its primary or secondary angles since the 2009 bottom, it consistently triggers a significant drop. The end cycle at the 360° angle corresponds to 7926—perfectly aligning with all the previously mentioned Fibonacci zones.
And for those skeptical of technical analysis, consider this: the upcoming year, 2026, is a pivotal year in the Samuel Benner chart developed in 1875 to identify periods of financial disorder. Benner’s chart indicated when to buy, when to sell, and when to expect chaos. Remarkably, it has accurately forecasted major financial crashes over the past 150 years—including the Great Depression, the Dot-Com bust, and the 2020 COVID crash. According to this chart, selling during the crash year and re-entering post-crash has historically led to profitable outcomes with a +-2 Years at a 87.5% accuracy.
When you combine all these signals, it feels reckless not to take them seriously—especially since this marks the end of a cycle measured from 2009. That’s how significant it is.
To those who dismiss technical analysis, this may sound like smoke and mirrors. But for those who’ve seen its power firsthand, the sheer number of confluences here is too substantial to ignore. If I know such big crash may happen - I would be happy to wait 1-2 years on cash and take opportunity of big red markets to buy.
Curious to hear your thoughts on this.

ES (SPX, SPY) Analysis, Key-Zones, Setups for Thu (Nov 20th)Market Bias Analysis
The current short-term bias is constructively bullish, yet it remains contingent on upcoming events. Recent momentum has been bolstered by Nvidia's exceptional earnings report and a significant intraday reversal in the E-mini S&P 500 (ES). As long as the 6,670–6,680 range holds during any pullbacks, the path of least resistance appears to be upward. It is important to note that the broader daily trend is still bullish, unless we see a decisive breach below the key demand zone of 6,520–6,510 in the ES.
Market Overview
In a notable shift following a four-day decline, today's trading session exhibited a renewed bullish sentiment. The E-Mini S&P 500 (ES) printed a robust green daily candle, bouncing off a low of approximately 6,622.00 yesterday to close near 6,740.
From a technical perspective, the daily chart reveals that the recent selloff has established a lower high without breaking the prior significant higher low. The reaction low remains comfortably above the daily 1.272 extension cluster situated around 6,521.25. On the 4-hour chart, the price action has transitioned from a pattern of lower lows to a new higher low, currently pushing into the Price Quotient Median (PQM) and Price Quotient High (PQH) band, just below previous 4-hour supply levels. Observing the 1-hour chart, today's trading reflected a definitive trend day upward, characterized by a consistent series of higher lows and higher highs, culminating the session near the 1-hour 1.272 Fibonacci extension at 6,743.75.
Macroeconomic factors played a crucial role in this market turnaround, particularly after Nvidia reported stunning Q3 earnings that exceeded expectations, generating approximately $57 billion in revenue. The company’s strong AI-driven outlook and positive after-hours performance alleviated concerns that the recent downturn in technology stocks signified the onset of a broader unwinding of the AI bubble. This development contributed to a rally in index futures as the session drew to a close.
Nonetheless, the overarching theme remains one of valuation pressures and interest rate concerns. Despite breaking a four-session losing streak, market participants are poised for tomorrow’s data, which will be pivotal in shaping the Federal Reserve's policy trajectory moving forward.
Scheduled Events (Tomorrow – Thursday, Nov. 20, 2025)
Tomorrow’s docket is heavy and directly relevant for ES:
• 8:30 a.m. ET – September Employment Situation (delayed jobs report)
The September nonfarm payrolls and unemployment rate, postponed by the government shutdown, are finally released. This is the only full jobs report the Fed will have before its December meeting, and markets are treating it as a major verdict on the labour market.
• Other U.S. data (during the morning/early afternoon)
Various calendars flag building permits / housing data, regional manufacturing (e.g., Philadelphia Fed), and existing home sales clustered through the U.S. session – all secondary to the jobs report but able to add fuel if they confirm or contradict the labour story.
• Fed speakers / meetings
• Chicago Fed President Austan Goolsbee has a scheduled fireside chat around midday (12:40 p.m. ET).
• The Fed also has a closed Board meeting at 1:15 p.m. ET and a two-day Cleveland Fed financial-stability conference that can generate headlines.
Net: the jobs report is the main event; Fed comments will colour the move rather than drive it on their own.
Setups (A++ Concepts)
These are two high-conviction, rule-style ideas you can plug into your own framework. Price levels are exact from your charts.
A++ Setup 1 – Continuation Long from Value Pocket
Entry trigger concept:
Look for a sweep into the chosen band (e.g., wick into 6,690–6,695 or down into 6,663–6,668) followed by a strong 15m/5m bullish close back above 6,700. That shows buyers defending value and rejecting a deeper rotation into S3.
Risk / invalidation:
Structural invalidation if ES closes the hour below 6,652.50 (Y-POC) and cannot reclaim 6,668. In practice, a tight stop can sit just under 6,652.00 if entering from 6,690–6,705, or under 6,645.00 if using the deeper S2 pocket.
Targets:
• TP1: 6,743.75 (1H 1.272)
• TP2: 6,777.00 (1H 1.618)
• TP3: 6,813.50 (1H 2.0)
---
A++ Setup 2 – Short Fade from 1H Extension Cluster
Entry zone:
Primary sell pocket: 6,777.00–6,813.50
(1H 1.618 to 2.0 extension cluster.)
Risk / invalidation:
Structural invalidation above 6,825–6,830 (clear 1H/4H acceptance beyond the 2.0 extension).
A practical stop can sit around 6,828.00 if entering inside the band.
Targets:
• TP1: 6,743.75 (1H 1.272 / prior extension)
• TP2: 6,683.50–6,690.00 (NYPM high / S1 top)
• TP3: 6,659.00–6,664.75 (VWAP/value pocket S2)
Narrative:
If Nvidia’s beat triggers a euphoric push straight into the upper fib level but the tape immediately rejects that strength, the market is saying “good news already in the price.” This setup expresses the view that the real gravity is lower, back toward value and potentially into S3 if macro data disappoint.

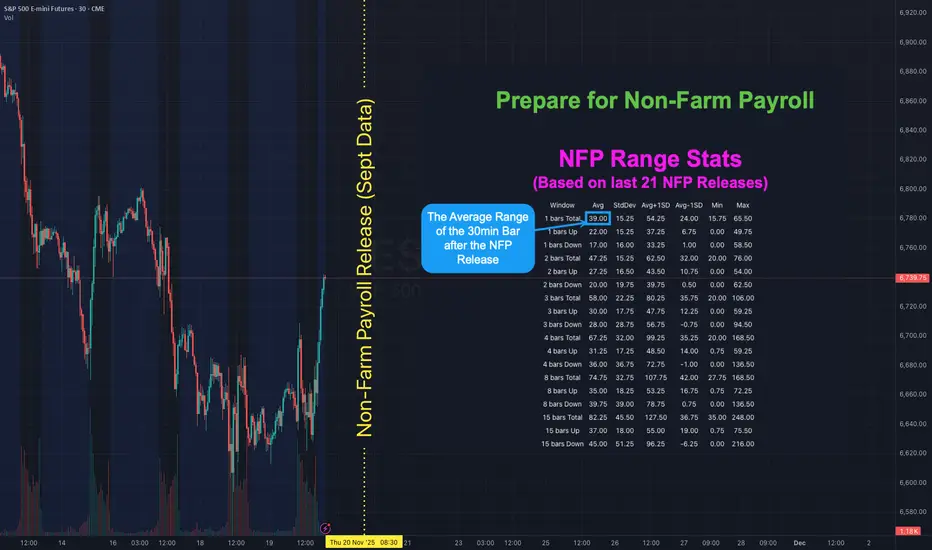
NFP is Back! Here's how to map out your playbook with statsHOW TO USE NFP RANGE STATS TO PREPARE YOUR PLAYBOOK
There has not been a Non-Farm Payroll release since Friday 5 September 2025 . Due to the government shutdown the September report that was originally set for Friday 3 October was postponed. It will finally be released on Thursday 20 November - a 48 day delay. With uncertainty around the labour data higher than usual it helps to know what “normal” looks like for ES S&P Futures. The table shows historical ranges after the 08:30 ET release on a 30-minute chart: 1 bar (30mins), 2 bars (60mins) 3 bars (90mins), 4 bars (2hrs), 8 bars (4hrs) and 15 bars (up to ~16:00 ET). The stats are based on the last 21 NFP releases (approx 2-years).
👉 If you think this would be useful as a script you can run yourself let me know (boost and drop a comment) and if there's enough interest I'll see if I can publish something.
WHAT THE COLUMNS MEAN
Avg - the typical move for that window based on past NFPs
StdDev - the variability around that average
Avg + 1 StdDev and Avg - 1 StdDev - quick upper and lower guardrails for a “normal” day
Min / Max - historical extremes in the sample
WAYS TO USE IT
1) Set guardrails for price discovery
Use Avg + 1 StdDev as a first “stretch” expectation for the window you trade. If price pushes beyond that level early you know we are outside normal and can adapt position size and expectations.
2) Pre-plan targets and emergency exits
Before 08:30 ET map a base scenario. Example for ES: if the 30m Avg post-release is X then a first take-profit can sit near X and a stretch target near Avg + 1 StdDev . Place an emergency stop beyond the Avg - 1 StdDev line if fading the first move.
3) Size positions to volatility
Translate the Avg 30m range into ticks or points and size so that a typical NFP bar does not exceed your defined risk. If your stats say the first 30m averages 9 points on ES do not run a size that cannot survive a 9-12 point swing.
4) Choose a playbook by window
1 bar (30m) - breakout or first-reaction mean-reversion
2-4 bars (60-120m) - continuation or reversal probabilities stabilise around the Avg envelope
8-15 bars - when the full session range is already at or beyond Avg + 1 StdDev be cautious chasing late moves
With the report 48 days late the probability of surprise is elevated. Go into the print with your ranges pre-mapped and your position sizing tied to those Avg and Avg ± StdDev bands. Clarity beats adrenaline.
👉 REMINDER:
If you think this would be useful as a script you can run yourself let me know (boost and drop a comment) and if there's enough interest I'll see if I can publish something.
ES 4h TF, LongAlright, here’s the call. I’m expecting a retracement sooner or later.
On the 1-hour timeframe, the ideal day-trading entry has already passed, so for now, I’m anticipating the price to tap or slightly extend beyond the blue line before pulling back toward one of the yellow zones.
Now, this is where it gets interesting. Both yellow zones offer potential long setups:
The first zone aligns with the VWAP, which often acts as strong dynamic support.
The second zone sits just below a price gap, meaning the market might fill that imbalance before continuing higher.
As long as the fundamentals remain stable, I’ll be watching for confirmation to go long from either of those two areas.
If I decide to take this trade, I’ll update and specify the exact entry point — but for now, patience is key. Let’s wait for that retracement first.

NY SESSION STRUCTURE UPDATEES continues to hold an inside-day structure, with price contained inside yesterday’s range.
This keeps the market in a balancing regime under MSM — compression, not trend.
The key level today is the inside-day break.
Until price resolves either side of the range, there is no confirmed directional intent.
The behaviour is straightforward:
– Liquidity is building at both edges
– Momentum remains muted
– No side is showing initiative
– Structure is coiling, not expanding
Operator approach:
Ignore early movement.
The valid move only appears once the inside-day resolves and behaviour confirms expansion.
— CORE5DAN
Institutional Logic. Modern Technology. Real Freedom.

ES (SPX, SPY) Analyses, Key Zones, Setups for Wed (Nov 19th)Market Analysis: A Shift in Momentum for ES
In today's market, the daily chart for the E-mini S&P 500 (ES) reveals a notable shift in momentum, characterized by a sequence of price action that signals a potential downtrend. Previously, we observed a high, followed by a lower high, and today's movement has decisively broken through the last remaining support at the higher-low shelf. This change comes after a rejection from the recent lower-high zone, situated just below the 6,900 mark, followed by a retreat through the crucial 6,700 threshold. What initially appeared to be a bullish uptick is now consolidating into a corrective downswing.
Today's significant drop marks the continuation of this emerging downward trajectory. Prices breached intraday support around 6,675 to 6,700, slid past the prior higher-low region near 6,635, and ultimately settled atop the initial daily demand zone. Notably, the selling volume during this decline expanded compared to previous sessions, underscoring that this movement reflects genuine market participation rather than mere fluctuations.
While the longer-term outlook remains bullish, reflected in the weekly trend, the daily and four-hour charts currently indicate a pronounced short-term downtrend. Key indicators include the formation of a lower high, the breach of the previous higher-low, and a liquidity run to the downside toward the extension cluster. As we move forward, this developing bearish scenario suggests potential for further declines in the coming sessions, though we are positioned within local demand territory, indicating that bounces and two-directional trading are likely in the near term.
Key Resistance Zones
Resistance 1: 6,637
This level represents today’s late-session swing high on the 30-minute chart, denoted as the S-session high (S.H 6,637). It serves as the initial resistance point above the current market price.
Resistance 2: 6,679.75 – 6,687.50
A cluster of highs, with NYAM.H marked at 6,679.75, LO.H at 6,685.75, and NYPM.H at 6,687.50, forms a critical intraday supply pocket. This region represents the primary A++ short zone should the price experience a bounce.
Resistance 3: 6,700 – 6,720
Above the NY session high band, the 4-hour chart highlights a previously broken support shelf and local supply just below 6,720. Any movement back into this area would likely be corrective within the ongoing downswing unless the E-mini S&P can close and hold a daily candle above this range.
Higher-Timeframe Cap:
Any price action remaining below the recent daily lower-high zone—situated near the last significant LH before the drop—maintains a bearish bias for the larger swing. A definitive daily close above this lower-high would be necessary to negate the current short-term downtrend.
---
Key Support Zones
Support 1: 6,627.50 and 6,614.75
The AS.L level is printed at 6,627.50, with the NL.L around 6,614.75 on the 30-minute chart. Together, these levels form the initial local support shelf just beneath the current price.
Support 2: 6,606.50 – 6,603.25
Marked by NYPM.L at 6,606.50 and NYAM.L at 6,603.25, this band serves as the next area of resting liquidity from today’s trading sessions. A clean break and sustained move below this range could pave the way for the Fibonacci targets below.
Support 3 (Major Fibonacci Cluster): 6,541.50 – 6,509.00
On the 1-hour chart, the 1.272 Fibonacci level is found at 6,541.50, while the 4-hour chart places it at 6,509.00. The daily chart marks the 1.272 at 6,521.25, creating a significant demand box from approximately 6,541 down to 6,509, with 6,521 serving as a mid-pivot. This is the pivotal "bounce or break" zone.
Support 4 (Deeper Extension Pocket): 6,501.75 – 6,458.00
The 1-hour chart identifies the 1.618 Fibonacci extension at 6,501.75 and the 2.0 extension at 6,458.00. The 4-hour chart aligns the 1.618 at 6,429.25 and the 2.0 at 6,341.50, with the daily chart placing the 1.618 at 6,418.00 and the 2.0 around 6,304.00. The initial focus for tomorrow is the 6,502–6,458 region. Should the 6,541–6,509 band fail, this area becomes a strong magnet where a more pronounced short-covering bounce is likely.
The definitive structural line on the downside is the cumulative daily 1.618–2.0 cluster, ranging from approximately 6,418 down to 6,304. A decline to this range could signify a major correction leg rather than a mere shallow pullback.
A++ SETUP 1 — REJECTION SHORT FROM NY HIGH BAND
Trigger:
15m: candle wicks into 6,680–6,688 and closes back below about 6,675.
5m/1m: a failed attempt to push higher (lower high) after that rejection.
Entry:
Aggressive: enter short 6,678–6,682 after the 15m rejection close and 1m fails to make new highs.
Conservative: limit sell in 6,680–6,685 on a controlled retest from below.
Stop (hard invalidation):
Around 6,698.00 above the band and intraday highs (about 16–20 points of risk if filled 6,678–6,682).
Targets:
TP1: 6,637.00 (session swing high). From 6,680 entry with 6,698 stop ≈ 2.3R.
TP2: 6,606.50 – 6,603.25 (NYPM.L / NYAM.L shelf), ≈ 4R from 6,680 entry.
TP3: 6,541.50 – 6,521.25 (top of fib demand cluster), campaign-style extension.
A++ SETUP 2 — EXHAUSTION LONG FROM FIB CLUSTER DEMAND
Trigger:
15m: price trades below 6,530, tags 6,521–6,509, then closes back above about 6,530 (wick through, body back up).
5m/1m: a higher low forms above roughly 6,520 after that reclaim; sellers fail to push back below the cluster.
Entry:
Aggressive: 6,525–6,535 on the first higher low on 1m/5m after the 15m reclaim of 6,530.
Conservative: limit buy near 6,525 on a controlled retest into the top of the cluster after the first reaction.
Stop (hard invalidation):
Around 6,497.00 under the bottom of the cluster and recent swing low (≈ 30–38 points of risk if entered 6,525–6,535).
Targets:
TP1: 6,595–6,600 (broken structure and local VWAP zone). From 6,530 entry with 6,497 stop ≈ 2R.
TP2: 6,637.00 (S-session high and first major resistance).
TP3: 6,679.75 – 6,687.50 (NYAM.H / LO.H / NYPM.H band), where a bounce can turn into a full squeeze.
Upcoming Economic Indicators
For tomorrow's trading session (Wednesday, U.S. time), traders should keep an eye on several key economic releases:
- At 8:30 AM ET, the U.S. will release Housing Starts and Building Permits for October, along with import/export price indices. These figures are vital for gauging growth, especially after a series of subdued permits and erratic starts.
- At 10:30 AM ET, the EIA Weekly Petroleum Status Report, alongside crude inventory data, is expected to influence energy markets and broader risk sentiment.
- Later in the afternoon, markets will be attentive to FOMC minutes and remarks from New York Fed President John Williams, both of which could impact rate-cut expectations based on the overall tone relative to recent communications.
Good luck !!!

ES UpdateI guess I was right Friday afternoon, it is a repeat of teh circled area. Expecting everything to hit oversold tomorrow.
Gap direction will depend on FDAX which is oversold and at support. If it breaks support, indicators may not work because Europe will go into a free fall.
NVDA earnings Wed AH, jobs report THU premarket, Fed minutes Thu.

S&P 500 Sell Decent zone on lower timeframe to sell. Current Month VPOC, Failure to go higher with Intraday range. Good zone to take short.

ES week 47 (1hr chart)T.A explained -
BackSide (BS)
FrontSide (FS)
Inverse BS (Inv.BS)
Inverse FS (Inv.FS)
BS & FS levels are expected support when dashed lines, tested when dotted and resistance when solid lines.
The inverse is true for the Inv. BS Inv. FS levels, they are resistance as dashed lines, tested as dotted and support as solid lines.
Monthly timeframe is color pink
weekly grey
daily is red
4hr is orange
1hr is yellow
15min is blue
5min is green if they are shown.
strength favors the higher timeframe.
2x dotted levels are origin levels where trends have or will originate. When trends break, price will target the origin of the trend. its math, when the trend breaks, the vertex breaks too so the higher timeframe level/trend that breaks, the more volatility there could be as strength in the orders flow in to fuel the move.

ES1 outlookES/NQ Outlook – Bearish Continuation
Bias: Shifted from early Bullish/Neutral to bearish once ES failed to confirm NQ strength. Correlation cracks lined up with the broader sell-off trend.
Macro Sentiment:
Risk sentiment remains shaky — Bitcoin pushing toward 93K,recovering from gov-shutdown and no data releases, and inconsistent tech strength keep pressure on indices. Underlying tone remains defensive.
⸻
Market Structure
• ES failed Friday’s Value High and rotated back below Friday’s POC.
• Now holding under POC, confirming sellers remain in control.
• Last session’s Value Low target still untested → unfinished business below.
⸻
Key Downside Targets
• PDL: 6,778
• Friday VAL: 6,725
• Main unfinished target: 6,666.5 (untouched value level)
⸻
Plan Going Forward
• Bias stays bearish while ES remains below Friday’s value high/poc but seeing interaction with week open.

bullflag breakoutBreakout from a bullflag is confirmed. if this holds could we see retest of highs by month end or possible new ATH?
HOW-TO: Analyze Support, Resistance & Short-Term DirectionHOW-TO: Analyze Support, Resistance & Short-Term Direction Using Volume Scope Pro (1H Example)
Introduction
This HOW-TO explains how to use the Volume Scope Pro — Order Flow Volume Analysis indicator to identify support and resistance, interpret order-flow signals such as absorption and distribution, evaluate buyer/seller strength, and determine a short-term market bias on the 1-hour timeframe.
1 — Chart Settings & Data Inputs
• Main timeframe: 1H
• LTF (Low-Timeframe data): 15-second volume blocks
• LTF coverage: ~115 bars
• Instrument: MES1! (CME Micro E-mini S&P 500)
This setup provides a high-resolution view of order flow behind each hourly candle by aggregating ultra-low timeframe volume behavior.
2 — Buy & Sell Volume Behavior
BUY Side:
• Buy Current Amount ≈ 18.539K
• 20-period Buy Average ≈ 54.044K
→ Buyers are significantly below their normal activity level.
→ Interpretation: Buyers are NOT supporting current price levels.
SELL Side:
• Sell Current Amount ≈ 17.073K
• 20-period Sell Average ≈ 50.857K
→ Sellers are also below average, but buyer weakness is far more pronounced.
Summary:
In higher timeframes like 1H, lack of buyer activity is often more important than strong selling. Here, buyers are too weak to create a sustained bottom.
3 — Trend Angle Convergence & Divergence (Trend θ)
BUY:
• Price vs Buy Volume (3 and 20 periods) = Divergent
→ Price attempts to hold or bounce are NOT backed by buyer aggression.
SELL:
• Price vs Sell Volume (3-period) = Convergent
→ Short-term movement is driven by sellers, strengthening the bearish bias.
4 — Delta Analysis
• Current Delta ≈ +1.46K
• Global Delta (100 candles):
– Positive Δ Sum ≈ 273.812K
– Negative Δ Sum ≈ 225.671K
Interpretation:
Although short-term delta is positive and long-term delta slightly favors buyers, the price structure does NOT reflect bullish dominance.
This type of delta behavior often indicates absorption rather than a trend shift — meaning buyers are active but ineffective at moving price.
5 — Support & Resistance Zones (SR Engine)
Volume Scope Pro identifies two main zones:
• Resistance Zone: 6880.75 ~ 6885.25
• Support Zone: 6707.75 ~ 6766.75
Current Position:
Price is holding inside the upper boundary of the Support Zone.
There was a minor bounce, but the reaction lacked strength and failed to break structural highs.
6 — Order-Flow Overlay Signals (OB / Distribution / Absorption)
• Multiple OB and Distribution labels appear near upper structure → clear signs of supply, selling pressure, and exhaustion at highs.
• OS and ABS signals at support did not result in meaningful continuation → weak follow-through from buyers.
Combined with weak buy volume, the market shows bearish intent.
7 — Short-Term Projection
Given:
✓ Weak buy volume compared to averages
✓ Sellers showing short-term dominance
✓ Converging sell-side angles
✓ Price reacting weakly to support
✓ Strong supply clusters above
✓ Delta showing ineffective buying
→ Short-term bearish continuation is the more probable scenario.
As shown on the chart, the Short Position tool highlights:
• Entry around the upper support boundary
• Stop above the minor pullback high
• Target near the lower support boundary
This forms a clear, structured bearish setup with defined R:R.
Disclaimer
This publication is for educational purposes only. Volume Scope Pro does not guarantee profit or certainty of market direction. Traders must perform independent risk management and verification at all times.

ES UpdateI'm not sure if the algos are doing the pump and dump. RSI and MFI haven't been hitting overbought lately. Seems like there are different algos fighting each other.
In any case, this looks like a bounce because it got oversold, much like the other day (circled). Not sure about gap direction Monday, but I'm carrying a few puts in stuff I expect to go down like GM.

Bouncing lowGood daily structure in the S&P 500 on Friday implies a market that got low enough to find buyers. If buyers are here ideally you would want to see this market closing above 6825 on Monday.

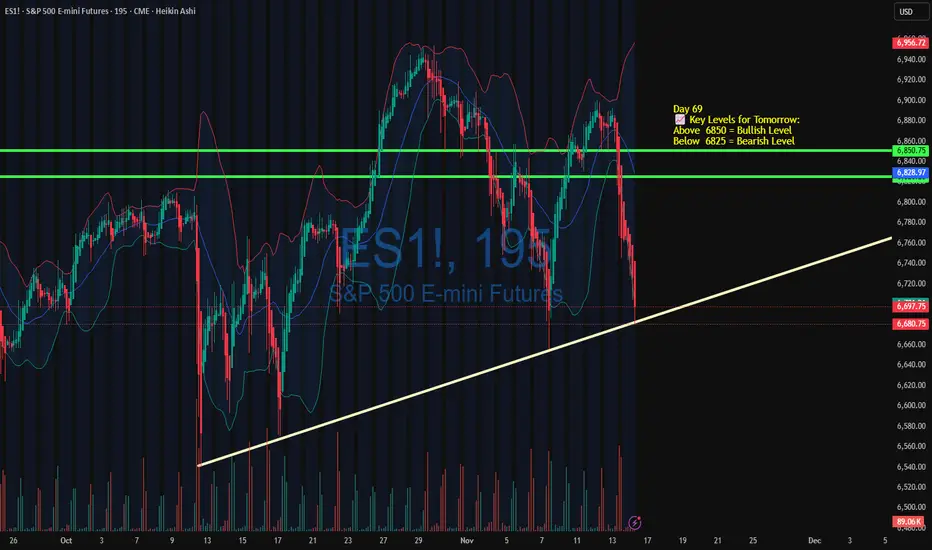
I Broke My Own Rule & Paid $515 for It | Day 70 RecapLost $515 today trading S&P Futures, and it was 100% on me.
After promising yesterday that I’d trade small, I accidentally entered ES instead of MES overnight — and that mistake cost me $800 in minutes. The rest of the day was a slow crawl back from that emotional hit.
It’s a painful reminder that discipline > direction. The market wasn’t the problem — my execution was.
Above 6840 stays bullish, below 6815 turns bearish.
We’ll see if this selloff stabilizes or extends into week close.

ES - hourly chart Monthly boxes are pink
Weekly boxes in grey
they frame the price action and show high, low and median ranges.
using a fib based trend tool to find targets to the upside.
T.A explained -
BackSide (BS)
FrontSide (FS)
Inverse BS (Inv.BS)
Inverse FS (Inv.FS)
BS & FS levels are expected support when dashed lines, tested when dotted and resistance when solid lines.
The inverse is true for the Inv. BS Inv. FS levels, they are resistance as dashed lines, tested as dotted and support as solid lines.
Monthly timeframe is color pink
weekly grey
daily is red
4hr is orange
1hr is yellow
15min is blue
5min is green if they are shown.
strength favors the higher timeframe.
2x dotted levels are origin levels where trends have or will originate. When trends break, price will target the origin of the trend. its math, when the trend breaks, the vertex breaks too so the higher timeframe level/trend that breaks, the more volatility there could be as strength in the orders flow in to fuel the move.

It looks so gloomyWhat I’m Watching:
Reaction to the trendline on the next retest
Whether volume confirms a true bounce or a breakdown
Price behavior as it re-approaches the highlighted green zone, which has repeatedly acted as both support and resistance

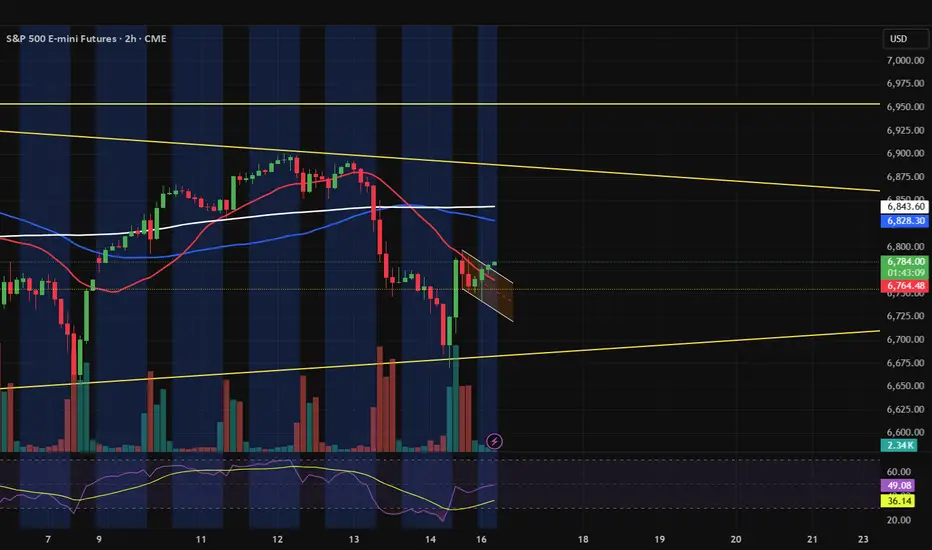
Trendline Support hitPrice has pulled back into a key technical zone and is now testing a long-term rising trendline that has held multiple times throughout the past several weeks. This trendline has acted as a structural support area, aligning with prior swing lows and validating the broader uptrend structure.
Today’s decline pushed ES directly into this support, and the reaction here will likely determine the directional bias for the next session.
What I’m Watching:
Reaction to the trendline on the next retest
Whether volume confirms a true bounce or a breakdown
Price behavior as it re-approaches the highlighted green zone, which has repeatedly acted as both support and resistance
If we close under 6680 today, All is lost and we will drop a lot more.