TRB big crash 🩸 incoming Oracle defi coin COINBASE:TRBUSD 🪙 #DYOR
Done good performance 🙌
I am expecting dump from present price 📌
If any liquidation pump 📌 to liquidate short positions
It will reach red box $56-73
Day close above box $74 invalid 📌
I am expecting dump towards $8-10
TRBUSDT trade ideas

TRB Breakout Now- Long to $280Hey everyone,
TRB is getting ready for another energetic move! For the past day, price has been consistently rejected by strong resistance right around the area of $243. This introduced another bullish pennant formation, which we are currently working to break out of right now. Considering the volatility in the markets, I'm staying cautious here... waiting for a retest after the break to confirm a safe long entry.
I'm actually a little surprised that it held here. I initially anticipated a reversal based on the overall market, but we have been steadily trying to push up which gives some confidence. That being said.... even if it's a dime piece of a trade, always remember to be mindful of risk and to trade responsibly. It could turn around at any moment.
Entry: 243.62
TP1: 255
TP2: 280
SL: 237

TRBUSDT IDEAHey traders hope you are enjoying our analysis. Now we are here again with a new trading opportunity. We will discuss today about LDO
LDO Falling Wedge Breakout is Already Confirmed,In 1D Timeframe ✅
Expecting 70% Bullish Wave

Trb short idea Trb pumping more and more and it touch all time high so it can go anywhere so my opinion is to not take a revenge trade just look for small scalp with stoploss .
Short idea with 260 is a stoploss and Target is 220 and 200

TRB - Still Strong 💪Hello TradingView Family / Fellow Traders,
In reference to my previous analysis (attached on the chart), TRB has broken above 140.0 and traded higher.
Now, what's next?
↗️ TRB is currently overall bullish from a long-term perspective, trading inside the rising blue channel.
📈 According to my trading plan, as TRB approaches the lower blue trendline, I will be looking for bullish reversal setups on lower timeframes to catch the next bullish impulse.
🎯 As the next bullish impulse begins, our target will be the 300.0 round number marked in green.
📚 Always follow your trading plan regarding entry, risk management, and trade management.
Good luck!
"All strategies Are Good If Managed Properly!"
~Richard Nasr

TRB LONG - 15m Bullish Pennant On the 15 minute chart, TRB is forming A bullish Pennant that looks like it's breaking out to the upside at this time. Fib projection places the 2.618 at the range of $235 to $245. Current price action is sitting at all time high so I consider this a risky trade.
Entry: 206.49
TP: 244.6
SL: 201

TRBUSDT IDEAHey traders hope you are enjoying our analysis. Now we are here again with a new trading opportunity. We will discuss today about TRB
TRB Moving Exactly As Expected Running In +130% Profit So Far Still Long Way To Go

TRB/USDT big crash one of the best pairs moved more than 2000% , waiting to hit 200-220$ for anticipating big crash will be no mercy 50-75% crash
sl any candle closed above 225$

📊#TRB is hopeful to challenge ATH🚀🌕🧠If we look at the daily level, we can find that we started to rise after completing the daily K-level adjustment. At this stage, we have successfully broken through the turning point, so the previous high will most likely be broken through. If the previous high is successfully broken through, Then there is hope for ATH to be broken through.
Let’s see 👀
🤜If you like my analysis, please like 💖 and share 💬
💕 Follow me so you don't miss out on any signals and analyze 💯


TRBUSDT is BullishTRB is currently in a strong bullish momentum and if the ABCD pattern plays out the target would be around 219, after which a reversal could come. Until then if BTC remains stable TRB is bullish.


Tellor TRB Coin Price Prediction🔥 Price on the 4H chart might come at these support area and we might get a potential bounce🔥
Potential bounce areas for Buying 127.18 and 104.50
👉 Follow me for More Real Time Opportunities.
Share your Thoughts if you have any?

✴️ Tellor Double Top Confirmed! 9-Nov Tellor (TRBUSDT) produced a peak and moved to produce a retrace (small correction).
This 9-Nov top is the "orthodox" end of the bullish wave.
As part of an irregular correction, TRBUSDT produced a higher high based on a candle wick today, 20-Dec. This session ended up closing below the 9-Nov peak price, signaling that the top is in and a major correction will now develop.
Additional signals supporting bearish potential
➖ Highest volume came in both 9-Nov and 20-Dec, in both cases the session ended closing red.
➖ 20-Dec session (today) produced a very strong higher high but ended up closing lower. So a higher high based on candle wick but lower high based on candle close. The closure is the relevant signal.
➖ Very strong bearish divergence with the RSI. The RSI peaked 23-Oct while TRBUSDT peaked 20-Dec. A two months long bearish divergence.
Marketwide signals
➖ Bitcoin trading near its high for more than a year.
➖ ALTSBTC going bullish (this only happens when Bitcoin either topped or is about to enter a correction after a major bullish wave.
➖ Smaller Altcoins going extremely bullish. Small and medium-sized Altcoins only grow after the major Altcoins are done with their growth.
Conclusion
Buy low to sell high.
This one is pretty high up. Tellor grew more than 2,000% from its June low. This is great growth, great action and we love it, but the market moves in waves... It goes up and down, up and down... It went up strong, now it is very likely to go down for long.
Namaste.

✴️ Tellor | Double Down (Elliot Wave Theory)Good evening my fellow Cryptocurrency trader, I hope you are having a wonderful day.
Correction potential for Tellor (TRBUSDT) remains intact.
The current rise is low volume and still trades below 143 or the 9-November peak price.
If you look at the trading volume it is exceedingly low compared to previous price action.
Looking from the Elliot Wave theory perspective, we know that the highest volume happens on Wave 3 of any impulsive move.
Looking at the bullish impulse, we can see high volume on Wave 3 while volume is low on Wave 5.
The perfect 5 wave count also points towards a correction next.
Now, the correction can be irregular as we are seeing with Chainlink or with Bitcoin's peak in 2021, meaning a higher high on Wave B. Or it can be a classic one where Wave B ends in a lower high.
Make sure to allow room to adapt for variations.
Bearish potential is high after a strong 1,830% rise.
Namaste.

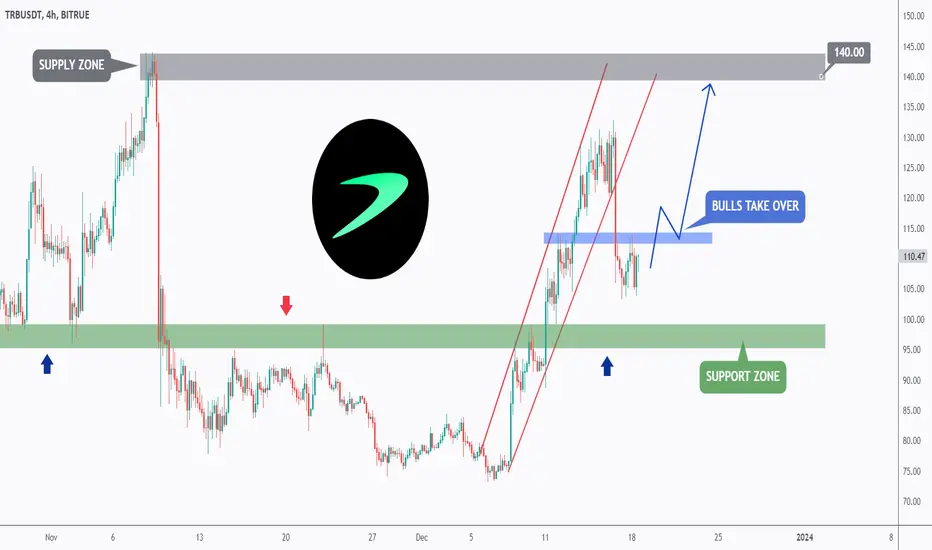
TRB - Catching The Next Impulse 📈Hello TradingView Family / Fellow Traders,
As per my last analysis, we know that the correction phase started on TRB as the red channel has broken downward.
📈 According to my trading plan , as TRB approaches the 100.0 support zone and the round number, I will be looking for buy setups.
🏹 For the bulls to take over and start the next impulse movement, we need a break above the last major high in blue.
🎯 In this case, a movement to the 140.0 supply zone would be expected.
📚 Always follow your trading plan regarding entry, risk management, and trade management.
Good luck!
All Strategies Are Good; If Managed Properly!
~Richard Nasr
The key is whether the Fibonacci ratio can rise above 0.5Hello traders!
If you "Follow" us, you can always get new information quickly.
Please also click “Boost”.
Have a good day.
-------------------------------------
(TRBUSDT chart)
(1D chart)
If it rises above 164.05, the new high (ATH) will be updated.
Accordingly, the key is whether the price can be maintained by rising above the Fibonacci ratio of 0.5 (140.54).
If not, and it falls below 104.97-108.94 and shows resistance,
1st round: 73.60-83.89
2nd round: 52.79
You need to check whether you are supported in the first and second sections above.
If it rises above 140.54-143.97 and becomes supported,
1st round: 156.44-168.43
2nd: 207.91
There is a possibility of resistance near the 1st and 2nd stages above.
--------------------------------------------------
- The big picture
The full-fledged upward trend is expected to begin when the price rises above 29K.
This is the section expected to be touched in the next bull market, 81K-95K.
-------------------------------------------------- -------------------------------------------
** All explanations are for reference only and do not guarantee profit or loss in investment.
** Trading volume is displayed as a candle body based on 10EMA.
How to display (in order from darkest to darkest)
More than 3 times the trading volume of 10EMA > 2.5 times > 2.0 times > 1.25 times > Trading volume below 10EMA
** Even if you know other people’s know-how, it takes a considerable amount of time to make it your own.
** This chart was created using my know-how.
---------------------------------

TRB Is looking Bullish TRB recently broke out of a consolidation channel and is looking for a move upwards.
TP1: 125
TP2: 142 (ATH)
Invalid if it closes below 105, then we will probably revisit high 90's

TRBUSDT SHORT SCALPAfter somewhat of an impressive run, inevitably TRB has completed the motions and needs a lie-down..
Safe TP: $22.50
TP: $20.00

#TRB Speedy Down to 91 USD#TRB Speedy Down to 91 USD.. At 91 it'll test local support then we'll watch reaction and trade further according conditions. But this time DOWN ONLY.

3 HOUR TIME FRAME TRBthis 3 hour time frame of TRB ( tellor ) as i have pointed you guys can see it got rejected many times so IMO this will be a another rejection point so we can make some profits this not a final advise

TRB #trb Descending patternTrb
Last night the whole sell-off happend buy a lot of holders...
The profit saving...
With an small risk we could go with it

Buy TRB
TRB has been forming an accumulation schematic (following Wyckoff method). In my opinion the Phase D is on going, where prices is about to break the accumulation area to go higher.
The trade set-up is propose as in chart.
