1557 trade ideas

The Mechanics Of Trading - Part IIIPart III
I started this video because a friend asked me for help determining trends on multi-interval (time frames) and asked how I look at trading across multiple intervals. Asking how to best setup/use price trends to capture the best trade setups.
Essentially, it comes down to three key components...
A. Initial reversal/impulse waves should be traded lightly (if at all). They are the "potential price reversal setups" that are usually the most dangerous for traders (and often fairly short in length).
B. Looking for the second wave to form provides traders with the opportunity to catch the bigger Wave-3. This wave forms after the impulse (Wave-1) and a corrective wave (Wave-2), which must stay below any previous ultimate high or above any previous ultimate low.
C. Wave-3, and Wave-5 if applicable, are where traders can flex their muscles related to trade size using the techniques I present to try to capture the MEAT (Sweet Spot) of any trend.
Remember, after Wave-3, you must prepare for the potential end of a trend setup where volatility is likely to increase and risks become a bit more elevated.
I go over multiple techniques in this video.
Fibonacci techniques and Fibonacci Price Theory
Anchor Bars (breakaway bars)
Using Fibonacci Retracements to identify key support/resistance levels for trending
Stochastics
RSI
Wave formations (ZigZag)
and Others
This video is designed as an instructional video to help you incorporate usable techniques into your own trading style.
Hope you enjoy.

The Mechanics Of Trading - Part IIPart I
I started this video because a friend asked me for help determining trends on multi-interval (time frames) and asked how I look at trading across multiple intervals. Asking how to best setup/use price trends to capture the best trade setups.
Essentially, it comes down to three key components...
A. Initial reversal/impulse waves should be traded lightly (if at all). They are the "potential price reversal setups" that are usually the most dangerous for traders (and often fairly short in length).
B. Looking for the second wave to form provides traders with the opportunity to catch the bigger Wave-3. This wave forms after the impulse (Wave-1) and a corrective wave (Wave-2), which must stay below any previous ultimate high or above any previous ultimate low.
C. Wave-3, and Wave-5 if applicable, are where traders can flex their muscles related to trade size using the techniques I present to try to capture the MEAT (Sweet Spot) of any trend.
Remember, after Wave-3, you must prepare for the potential end of a trend setup where volatility is likely to increase and risks become a bit more elevated.
I go over multiple techniques in this video.
Fibonacci techniques and Fibonacci Price Theory
Anchor Bars (breakaway bars)
Using Fibonacci Retracements to identify key support/resistance levels for trending
Stochastics
RSI
Wave formations (ZigZag)
and Others
This video is designed as an instructional video to help you incorporate usable techniques into your own trading style.
Hope you enjoy.

The Mechanics Of Trading - Part IPart I
I started this video because a friend asked me for help determining trends on multi-interval (time frames) and asked how I look at trading across multiple intervals. Asking how to best setup/use price trends to capture the best trade setups.
Essentially, it comes down to three key components...
A. Initial reversal/impulse waves should be traded lightly (if at all). They are the "potential price reversal setups" that are usually the most dangerous for traders (and often fairly short in length).
B. Looking for the second wave to form provides traders with the opportunity to catch the bigger Wave-3. This wave forms after the impulse (Wave-1) and a corrective wave (Wave-2), which must stay below any previous ultimate high or above any previous ultimate low.
C. Wave-3, and Wave-5 if applicable, are where traders can flex their muscles related to trade size using the techniques I present to try to capture the MEAT (Sweet Spot) of any trend.
Remember, after Wave-3, you must prepare for the potential end of a trend setup where volatility is likely to increase and risks become a bit more elevated.
I go over multiple techniques in this video.
Fibonacci techniques and Fibonacci Price Theory
Anchor Bars (breakaway bars)
Using Fibonacci Retracements to identify key support/resistance levels for trending
Stochastics
RSI
Wave formations (ZigZag)
and Others
This video is designed as an instructional video to help you incorporate usable techniques into your own trading style.
Hope you enjoy.

This will be the last rally SPY.SPY holding that 520 like god. They gonna rally test highs 533 it past that then we go 550 maybe. After that we should head down this time longer deeper. watch daily stoch turn up see how far it goes before turning. Why sell off
1. Rates are going higher u hear Bernstein saying inflation down 60% and 2% looks good target. WTF that why I play charts
2. Banks baby in trouble especially regionals other banks will fall also why debt man banks broke why they rally stock buy backs u understand that correct not productivity money to buy OWN shares back
3. Housing look XHB PHM housing about drop
4. IWM IWM has not yet and will not get to old highs that is bad bad.
5 breadth in market terrible
6 Watch fund managers sell into this rally get clients out.
so lets see next week we have SMH QQQ selling off to why inflation high rates
1 more high rates why banks dropping defaults not lending Jamie diamond announce no stock buy back may 23 look we dropped hard no stock buy back to expensive. National debt crazy. Lets see how next week goes. I am long SPXL 127.85
Thanks taking time read. Comments welcome.

Spy to gain if we break 530 next week.I believe that we are in the middle of a strong uptrend, if spy can break the 530 barrier next week with strong volume, i think we will see a re test, and if it holds we can get to 540-560 by the middle of July. I currently have 555 calls for middle of July because i got them so cheap!
If it rejects at 530, I think we will see another pullback and i will be selling my calls, any input is greatly apprecieted!

SPY: First week of June Hey everyone,
Posting an idea. I will be away next week, God willing, on a ship 🚢, in the Bahamas 🌴, so figured I would post now, because I will pretty radio silence for next week and haven't decided whether I will make an effort to track the market while on the sea or not. Probably not from the looks of the probs, so let's get into expectations next week.
Daily probability on Monday is bullish, which works well for the bull flag SPY left off on.
The TPs are in the chart. Biggest concern you have is we fell below overhead trend resistance at approximately 530. So watch this area.
Probability on the week indicates inside. You may get away with buying the dip, shorting the rip next week as a result. Most critical I would argue being that 530 trend resistance.
Reference target is at 528.12. We open above, we will sell down to this point. We open below, we will buy up to this point. 80 ish % of the time.
Inside week makes sense with the following week containing NVDA stock split and FOMC.
Be weary of NVDA stock split, this is a bearish event for most stocks and it was for NVDA's last split as well. I got burned on that the last time😩.
FOMC I have no expectations.
Going into the following month (July) we will have new 3-month levels and new 6-month levels with the high prob target, so curious about that.
In terms of TP expectations for next week, 530 is what I expect.
Safe trades everyone and catch you in 1 week!

The market is taking a breakLooks like the market is going to make another visit to the uptrend line from October 2023. Be ready for a bumpy ride in the next couple of weeks. Save some cash for the right moment to buy or short something. We are still on a bull market.

Expired SPY Weekly outlook. 5th WK MAY 2024Expired SPY Weekly outlook. 5th WK MAY 2024
> NEUTRAL 📊 CORRECT
Closed Price: 529.44
Target Price: 530 | Strike Price: 531.28 MAY28 24'
Upper Range: 551
Lower Range: 510

SPY bigger pictureI am going slowly short.
SPY should make another leg down this week.
Level of interest is 475-470
Lets see what Wednesday will bring, until then we should stay flat.
From the lows of 470, we shall do the usual election run.
target 548?
Ill be updating this idea.

Volume will be all selling on SPYVolume has been so low as traders look for a new all time high, but big money is about to pull the plug. Going into the weekend ted as a baboon's butt.

SPY evening star setupFor those of you who understand candlestick patterns, this is not news to you.
The weekly SPY is setting up an evening star formation. It's a bearish setup on a weekly chart. More importantly, it should be noted as a false breakout (if we close near current levels)

SPY Red Alert below 524.61 we need to look downWe have a Demark 13 weekly exhaustion count, 5th wave 1.0 extension on EW, negative divergence on the weekly MACD and failed breakout, if we don't close above 524.61 for the week then the market looks in trouble

$SPY - It can get ugly unless...If AMEX:SPY fails to bounce from here and breaks below $522 - $520 area, things will get ugly real quick!
The members of the Fed are becoming sports commentators, narrating every move in the macro data and causing havoc in the market.
Potential downside targets:
$515
$498
$475

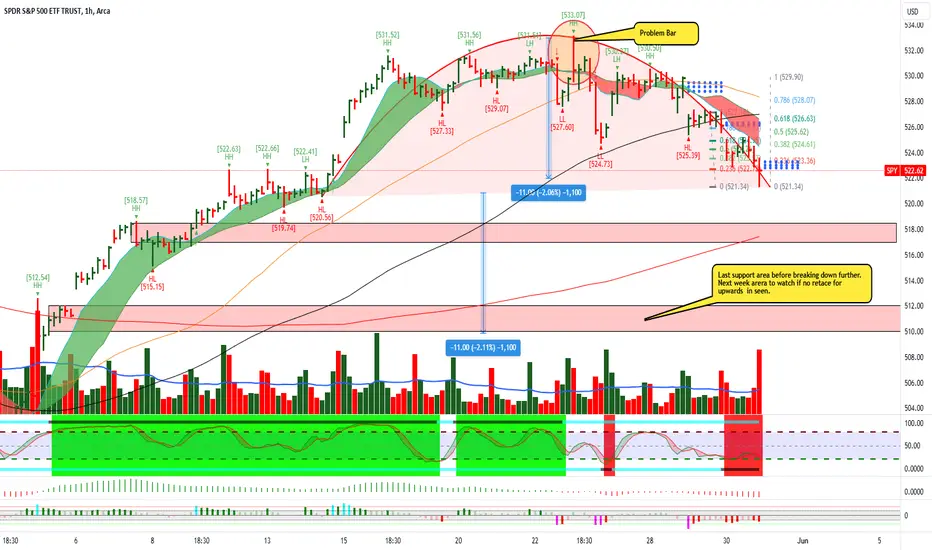
$SPY May 31, 2024AMEX:SPY May 31, 2024
60 Minutes.
As expected, 522 was achieved.
21 ema of daily done.
In Both daily and 60 minutes the bar making ATH is the issue. It had close near low of bar.
Hence long for higher target is only above 533.5 levels with close near top of bar.
Yesterday i had shared A, B And C.
And said B and C was important for the day.
Today i will consider A the rise from 499.55 to 533.
We can see in daily the rise was swift.
Thats being corrected now.
I expect AMEX:SPY to consolidate around 516 - 517 levels before next uptrend as long as 488-492 is held on any retrace.
Now for the day in 15 minutes we have oscillator divergence.
AMEX:SPY making LL but not supported by Oscillator.
Considering the fall 529.9 to 521.34 a retrace to 526.5 is possible being 61.8% retracement and 10 averages too.
So today contra trade could be a buy around 522 - 522.5 levels for 525 - 526 as target or sell 525-526 for 518-519 levels.
S&P stalls in indecision; still bullishLast week was marked with indecision. Market was moving in a narrow range while Buyers were waiting for FOMC ad NVDIA’s earnings. After receiving positive confirmation (FOMC neutral, earnings good) market tried to go higher but found no support from large players. Sellers took advantage of the weakness and dropped price, clearing many weak longs established in the previous 5 days. It was a strong move but for some reason sellers lacked conviction to go lower. Price pivoted after filling the gap from Wednesday 15th and went back into the balance zone ( 527.5-531.5 ).
We should expect more pushes and pulls in the short term while market is fishing for new information. To confirm their control buyers must clear last week high ( 533 ) and build value above it. Bears’ objective is to break last week low ( 525 ). Until it happens the most likely scenario is bracketing within last week range.
It is important to note that while short term direction is unclear, we are still in weekly uptrend. So bears must work twice hard to prove their strength
Disclaimer
I don't give trading or investing advice, just sharing my thoughts.


SPY turns bearish After pulling away from the upper Bollinger band earlier this week, the MACD has indicated that this Bullshit are about to be taken to the woodshed. Selling calls is easy money IMHO.

SPY levels - Time to be patient Let's quickly review some levels in SPY.
I can see potential support at 525 as a base flip level.
523 also looks like support - here are 21 EMA + the flag bottom + gap fill.
The obvious resistance here is 532-533.
One key thing I want to mention: the market is now ranging, and it's important to be patient and give it some time to form clearer price action and confirm the next momentum.

SPY might repeat itself??If spy repeat itself, it will be good buy. I still think we will see all time high end of the year

$SPY May 30,2024AMEX:SPY May 30,2024
15 Minutes.
At the moment long only above 533.07 for any higher targets.
A The rise from 493 to 533
B The rise from 519.74 to 533.07
C the fall from 529.9 to 525.39
AT the moment these are the 3 important numbers.
At the moment I will consider B and C only.
For the rise B important to hold 524 levels being 61.8% retracement for the rise.
For the fall 529.9 to 525.39, a retracement to 528 levels will give an opportunity to short.
At the moment upside is limited to 532 533 levels
Since we have multiple touch points on 531-533 levels, I expect a swift move upside once 533.5 is crossed convincingly.
And on downside 524 is important to hold. If 524 is broken, then we can see at least 521-522 as target which is 21 ema in daily.
So, I will think only on short side today.

SPY Fibonacci Price Theory And BreakOut BarsThis instructional video teaches you the basics of Fibonacci Price Theory in conjunction with Breakout Bars and how price is the ultimate indicator.
Throughout this video, I try to provide instruction on key elements related to the Fibonacci Price Theory (Unique & Standout Highs/Lows). Additionally, I've also included Breakout Bars and Fibonacci Price Retracement concepts.
What I really hope you learn from this video is to see price as the true ultimate indicator for your trading decisions. Using technical analysis techniques is fine, but use price as the key element when trying to confirm or reject your trading ideas.
I hope this helps you understand that price, action, and reaction through trends, peaks, and troughs are the most important components of the chart. Everything else is peripheral.

ICT Short setup SPY swing trade, retracement trade👋Hello Traders,
Our 🖥️ AI system detected that there is an H4 or higher timeframe ICT Short setup in SPY for Swing trade.
Of course SPY is in up trend in Daily chart, so this is a retracement trade for reference.
Or you could consider to buy SPY after reaching the demand zone marked on chart.
Please refer to the details Stop loss, FVG(Sell Zone),open for take profit.
For more ideas, you are welcome to visit our profile in tradingview.
Have a good day!
Please give this post a like if you like this kind of simple idea, your feedback will bring our signal to next better level, thanks for support!
