A nice Bullish setup Expecting price action to drop a bit first to the 27.41 level, and then....
1st Target - 28.35
2nd Target - 29.31
3rd Target - 30.59
4th Target and Objective - 30.84
PTONN trade ideas

PTON making a runBullish divergence coming into play today and PTON finally broke resistance. Keep an eye on EOD close for confirmation of breakout.

Peloton $37 target from WedbushSome bullish action in the stock and looks like the correction is over.
Peloton initiated with an Outperform at Wedbush. Wedbush analyst James Hardiman initiated coverage of Peloton with an Outperform rating and $37 price target.
Read more at:
thefly.com
Average Recommendation: BUY Average Target Price: $34.58
16 buy rating out of 20 analysts
Huge short interest at 69%,


The gift that gives backPELOTON
- PTON started to look like it would be breaking out and heading for a double top which would be my original setup for a short position.
Anyways, it didn't go like that, not enough volume to back up a breakout and to sustain the gains, green to red move. So a new opportunity has arised, short from current level at resistance down to support level at 24. Stop loss above today's high.

Possible HedgePton has been on this nice bearish channel for days now.
Short Entry $30
Exit $27
Stop $31


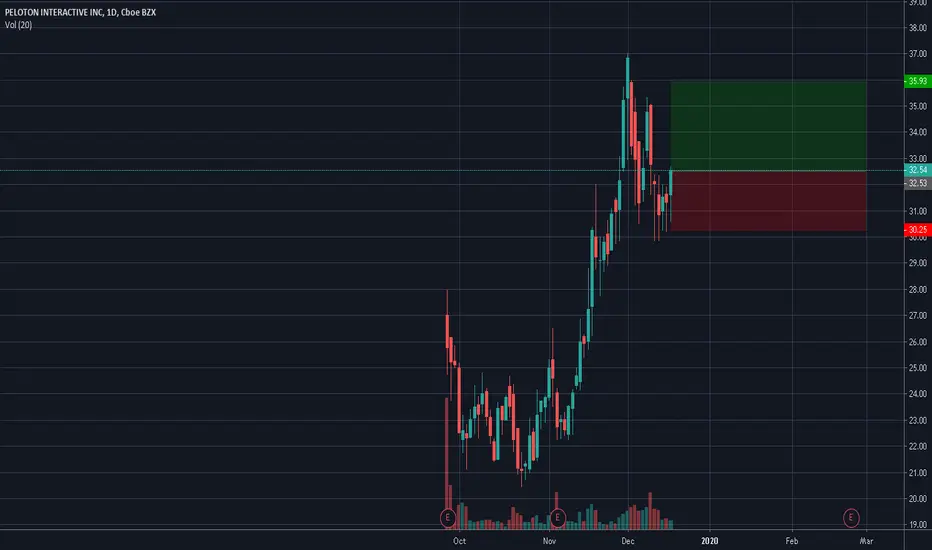
Along for the Ride On Peloton InteractiveEntry level $30.85 - Target price $35.00 - Stop loss $30.00.
The negative commentary and analysis has swung to positive outlook and reviews after a bumper spending spree by consumers over the festive period. The chart is also very bullish with all indicators in reversal and the volume profile is particularly encouraging.

$PTON Morning Star Pattern?$PTON is to new for regular technical analysis so, I'm looking at what appears to be a Morning Star pattern. If this clears the $29.20 area it should have room to run to the old highs... Ideas, not trading advice.

Peloton up on a down day $ptonLooks like we may have found some support here which may offer up a day trade on a break above the $28 region.
Moving averages are now providing much needed support.

Fibonacci Support Holds in Peloton $ptonWill be on the lookout for a reversal opportunity in Peloton today, in Fridays session the Fibonacci Golden pocket held perfectly which is a good sign but could very well be retested today, if it holds it suggests buying strength, thus will look to long.
7&12ma's have been regained as support.
Macd and histogram in reversal.
On the other hand is this support fails there is large price range below to support , so short will be in play.
Company profile
Peloton Interactive, Inc. is the interactive fitness platform, which engages in the operation of in-studio fitness classes, fitness clubs, at-home fitness equipment & content and health & wellness apps. It operates through the following segments: Connected Fitness Products, Subscription, and Other. The Connected Fitness Products segment engages in the sale of bike and tread and related accessories, associated fees for delivery and installation, and extended warranty agreements. The Subscription segment engages in the connected fitness subscription and digital subscription. The Other segment consists of peloton branded apparel. The company was founded by John Foley, Tom Cortese, Yony Feng, Hisao Kushi, Marion Roaman, and Graham Stanton in 2012 and is headquartered in New York, NY.


PTON potential Long spotlooks like a stock with a healthy uptrend. Dont know anything about the company but the pull back looks textbook with an impulsive move up followed by descending compression into support. Think that the probabilities are good that we rebound from this zone. (This specific level is nice because it has a lot of confluence with it being below many swing lows--> AKA stop losses, also it's met with an untested first touch level and a measure move from the first pull back from the highs.)

PTON correction at or near Completion? Peloton fib support zonesPart of my ongoing analysis of Peloton price action (see links below).
Peloton appears to have stabilized a bit, but likely has one more drop to come.
The perfect 5-wave uptrend is going through the requisite 3-wave correction.
Wave C most often goes further than wave A, so am expecting lower lows.
It is POSSIBLE that correction is done, with the $30 round number test.
But $30 psych and the red 3.618 were PIERCED, are now weak support.
$28.30-28.40 seems a LIKELY target for wave C, and $27.-- is possible.
Previous Analysis (click):
Dec 02, 2019: $37 Top Call
Dec 04, 2019: $35 2nd Top
Dec 10, 2019: $30 Target
Dec 16, 2019: $28 Buy Zone
.

PTON correction NOT done yet? Peloton support zones to watchFollow up to my previous plots (see links on chart or below).
PTON was at natural "End Points" for several waves moving upward.
And surprise surprise, Social Media attack hits and knocks it down.
The bounce looks impressive on paper, but may be just a Bull Trap.
The rise was a clear 5 part move, or a "12345 Impulsive Wave".
Most corrections are 3 part moves, or "ABC Corrective Wave".
I believe we have completed wave "B" and starting wave "C".
Of course I could be totally WRONG and it shoots past $100 today.
Or it may not follow my plotted paths and just randomly WANDER.
But the zones WILL cause reactions, and that is WHAT to study.
$ 34.38/43 is the "Decision Zone", look where Daily close falls.
$ 29.51/71 is the "Most Bullish" retrace that can be expected.
$ 27.18/42 is the "Worst Case" unless this stock just collapses.
$ 35.26/35 is the immediate resistance which I expect to hold.
$ 36.00/02 could be the "UpThrust" before a sharp pullback.
$ 36.65/70 could be a "Double Top" with lower high, gulp.
Previous Analysis on Dec 02, 2019: $ 37 Top Call :
.
Previous Analysis on Dec 04, 2019: $ 31 Bounce Call :


PTON peaked EXACTLY as expected, Peloton now in Retrace WatchFollowup to my first map for PTON topping zones (click) .
So we peaked exactly as expected and are retracing now.
First leg down could have been just market wide pressure.
But second leg down is on a positive day for most indices. (uh oh)
Plotted EW paths are just GUESSES as to the retrace.
But the ZONES are SOLID and each will cause a reaction.
So we now we observe the action at our zones for clues.
It is also possible we do not get an "ABC" correction.
Perhaps we reach a support and bounce to new highs.
Perhaps we crash through supports to final destination.
The Numbers
$ 30.49-30.62 is the minimum expected target.
$ 29.51-29.73 is perhaps the most likely target.
$ 26.45-26.84 should be VERY STRONG support.
DISCLAIMER :
I know NOTHING about this company (other than TV ads).
I do NOT OWN nor SHORT this asset (the stock nor bike).
PURELY for educational purposes (not financial advice).
Previous plot looking for $35.-- or $37.00 top :


Bullish PTONThis correction is a nice opportunity to get long here. We should see price action reverse course soon and the 37.13 level should be achieved to the upside in the next few weeks.

PTON - $37.20 PTThis looks like it has a little way to go before a breather is in store. New IPO very volatile and who knows but this is starting to get overbought and should pull back soon.

PTON Support Resistance zones via Fibonacci: Peliton near a top?Plot to study this asset's behavior around key Fib multiples.
Is this one of the few IPO's with immediate success this year?
Or is it about to run out of steam and wither away like many?
I know what you are thinking of the chart above:
"Draw enough lines and some will hit every time".
My goal is to study the price action at each zone.
Some of these waves could dictate the future for years to come.
Thus it is important to study the "birth" of a stock in great detail.
We will see a retrace at some point, which will offer many clues.
34.26 - 34.44 is immediate Resistance, Blue 4.618 possible wave End.
36.70 - 37.09 is next Resistance, Blue 5.236 very common wave ender.
39.75 - 39.90 would be the maximum expected before a correction.
It is actually possible we have technically TOPPED.
Or maybe we see a BULL TRAP above then steep drop.
Or I am totally WRONG and it goes straight past $100 :)
I will post updates at key milestones or rapid changes.
