US Recession Imminent! WARNING!Bond traders are best when it comes to economics. Stock traders not so much.
As the chart shows, historically, when rates bunch up, what follows is a recession. During the recession, the economy tries to fix itself by fanning out the yield curve, marking it cheaper to borrow and boosting the economy.
The best time to be buying up stocks and going long the market is when the yield curve is uninverted and fanned out wide—not when it is bunched up like this.
My followers know this is my first warning of a recession since FEB. 2020.
WARNING! Things can get ugly from here very quickly!
US 30Y yield
No trades
Trade ideas

Home Rate Trends - US30YIf you are htinking about buying a house or refinancing. This is the chart for you.

Bond Gap FillI guess Govt bonds don't like open gaps either. I was wondering about it yesterday. Filled today.

Supply zone sellIs this supply zone in line with the pressure on the Fed to cut rates aggressively? It could also explain why large-cap stocks are going up.

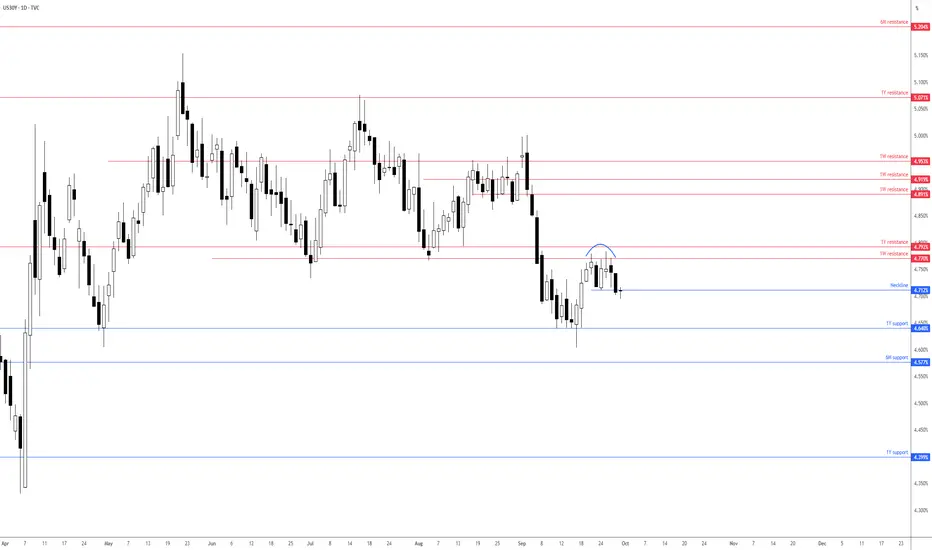
US30Y pattern support breachAs can be seen from the chart below, price action continues to respect resistance between 4.792% (1Y) and 4.770% (1W), which has also seen flow move below the neckline of a double-top pattern at 4.712%.
With the close below a notable pattern neckline, additional underperformance towards 1Y support at 4.640% (which held on two occasions in April and September this year) might unfold. A leg below 4.640% also unearths another layer of nearby 6M support at 4.577%.
Written by the FP Markets Research Team
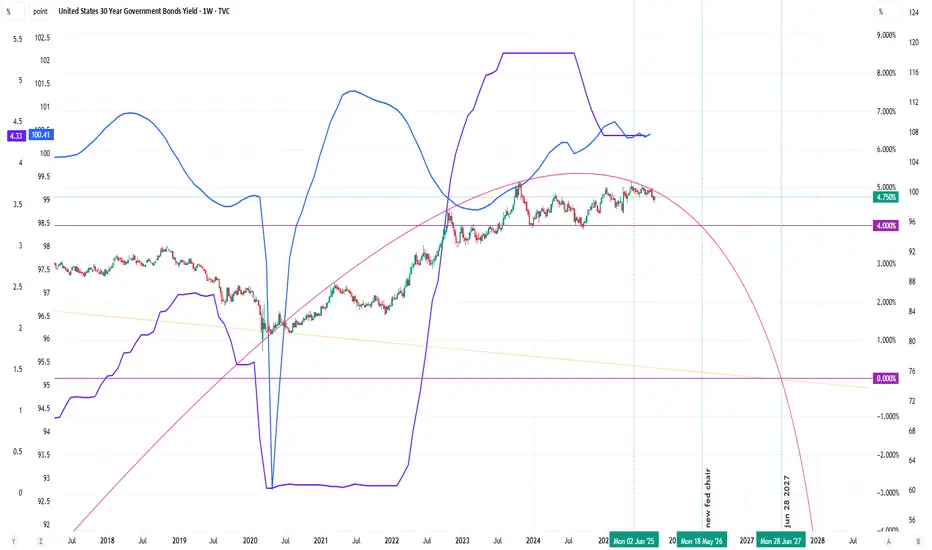
30 year US treasury yields going forwardShowing of potential levels involving US treasury yields over the next few years as Trump puts in a "super-dove" as Fed Chair.
Bond yields are rocking to the upsideToday, bond yields are hitting the wires and causing a slight market sell-off. Fear is kicking in and investors are becoming even more cautious, as economic cracks start to appear.
Let's dig in.
TVC:US10Y
TVC:US30Y
TVC:JP30Y
TVC:GB30Y
TVC:EU30Y
Let us know what you think in the comments below.
Thank you.
75.2% of retail investor accounts lose money when trading CFDs with this provider. You should consider whether you understand how CFDs work and whether you can afford to take the high risk of losing your money. Past performance is not necessarily indicative of future results. The value of investments may fall as well as rise and the investor may not get back the amount initially invested. This content is not intended for nor applicable to residents of the UK. Cryptocurrency CFDs and spread bets are restricted in the UK for all retail clients.

Daily Updates 8/25/25 UCHFHello Traders! I am neutral on UCHF. The signs are not super clear for me currently. This pair was moving as primed as I wanted. No trend has really picked up this month. No quarterly shift.

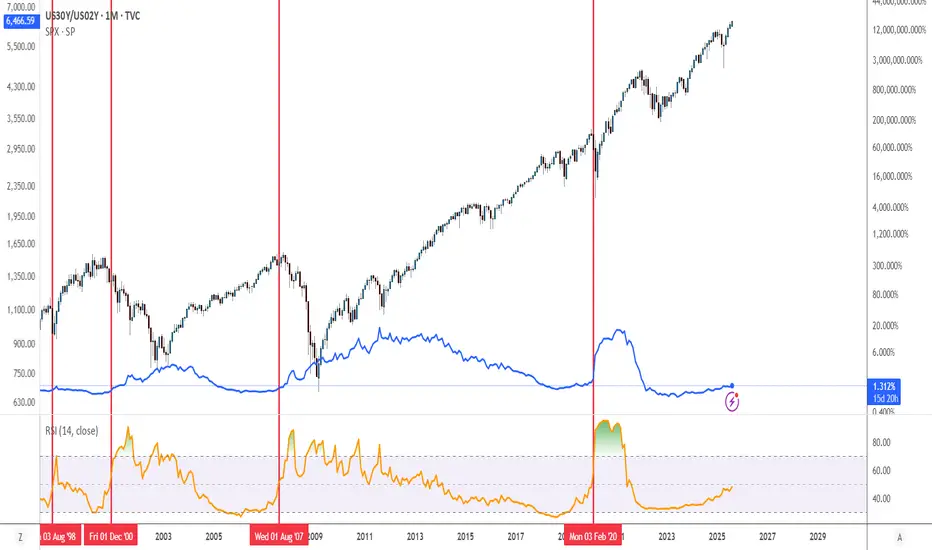
US30Y/US02Y Ratio Chart Crash PreditionAnytime the RSI hits 50% on the US30Y/US02Y ratio a crash soon proceeds when on a monthly timeframe. This only works on the monthly timeframe, it will not work on other timeframes.
US30Y Bullish ideaThis is a potential idea of the 30 year bond yield potentially having movement to the upside. We have already reached into a daily volume imbalance and weekly volume imbalance. We also have a monthly order block that is acting as support combined with our volume imbalance levels. We also have relative strength with the US30Y against the US10Y and US5Y. Could be a potential idea to look for bullish ideas with the the fact that we are in a potential point were we could have a Quarterly shift.
*Targeting
A move to the upside were we have buyside liquidity and the 4H fair value gap.

Rising Yields doesn't (always) translate Dollar StrengthThe 30-year Treasure yield pushed above 5%, which should be bullish for the dollar. However, the DXY actually went lower. It seems like investors aren't just looking at yields, they're concerned about why yields are rising. It won't be pretty. If the greenback falls below 99.50, the alarm will go off. The Treasury yields tell the truth about debt confidence. We'll be on the lookout for EURUSD & USDJPY price action next week when NFP comes around. I'm not gonna say it, but I'm leaning towards continued sellside delivery on the greenback.

Is US debt a threat to equity market recovery?Introduction: The equity market is marking time in the short term after a vertical uptrend since the beginning of April. There are many issues of fundamental concern, but one is currently front and center: the sustainability of US sovereign debt. Of course, it's far too early to talk about a US public debt crisis, but the new tax bill championed by the Trump Administration envisages raising the US debt ceiling by $4 trillion, putting short-term upward pressure on US bond yields on 10-, 20- and 30-year maturities. Is this a threat to the rebound in US equities since the beginning of April?
1) US bond yields reach macroeconomic warning zone
The Trump Administration's tax bill calls for tax cuts and, above all, an increase in the US public debt ceiling by US$4 trillion to allow the US federal government to continue its massive indebtedness.
The market is beginning to worry about this situation, as US debt is on the verge of surpassing the 1946 record when expressed as a percentage of US GDP. The annual interest burden on existing debt has reached US$880 billion, equivalent to the US defense budget.
Chart showing the evolution of US public debt as a percentage of US GDP
As a result, financial markets are expressing their concern with rising US bond yields on the long end of the yield curve.
Chart showing Japanese candlesticks in daily data tu 10-year US bond yields
Graph showing monthly Japanese candlesticks for the 30-year US bond yield.
2) The market is hoping for activation of the FED put to ease bond tension
This upward pressure on US bond yields may represent a risk for the equity market, as higher US federal government yields will have a direct impact on US corporate borrowing rates.
S&P 500 companies have solid balance sheets and should be able to cope, but long-term bond yields must not rise above 5/6%, as the financial situation of small and medium-sized US companies would then become problematic. This 5/6% threshold has been identified as the macroeconomic warning threshold for the majority of US companies. In such a scenario, the FED would be obliged to intervene directly on the bond market to relieve the pressure.
3) The S&P 500 is overheating in the short term, but the underlying uptrend is technically intact, and remains supported by the new record high in global liquidity.
At this stage, technical analysis of the financial markets suggests that the upward rally since the beginning of April is not under threat. The market was overheated in the short term and needed to breathe. For the S&P 500 index, the consolidation is short-term in scope, and the recovery remains intact as long as the major technical support zone of 5700/5800 points remains intact. The 200-day moving average, shown in blue on the chart below, passes through this price range.
Chart showing Japanese candlesticks in daily data for the S&P 500 future contract
DISCLAIMER:
This content is intended for individuals who are familiar with financial markets and instruments and is for information purposes only. The presented idea (including market commentary, market data and observations) is not a work product of any research department of Swissquote or its affiliates. This material is intended to highlight market action and does not constitute investment, legal or tax advice. If you are a retail investor or lack experience in trading complex financial products, it is advisable to seek professional advice from licensed advisor before making any financial decisions.
This content is not intended to manipulate the market or encourage any specific financial behavior.
Swissquote makes no representation or warranty as to the quality, completeness, accuracy, comprehensiveness or non-infringement of such content. The views expressed are those of the consultant and are provided for educational purposes only. Any information provided relating to a product or market should not be construed as recommending an investment strategy or transaction. Past performance is not a guarantee of future results.
Swissquote and its employees and representatives shall in no event be held liable for any damages or losses arising directly or indirectly from decisions made on the basis of this content.
The use of any third-party brands or trademarks is for information only and does not imply endorsement by Swissquote, or that the trademark owner has authorised Swissquote to promote its products or services.
Swissquote is the marketing brand for the activities of Swissquote Bank Ltd (Switzerland) regulated by FINMA, Swissquote Capital Markets Limited regulated by CySEC (Cyprus), Swissquote Bank Europe SA (Luxembourg) regulated by the CSSF, Swissquote Ltd (UK) regulated by the FCA, Swissquote Financial Services (Malta) Ltd regulated by the Malta Financial Services Authority, Swissquote MEA Ltd. (UAE) regulated by the Dubai Financial Services Authority, Swissquote Pte Ltd (Singapore) regulated by the Monetary Authority of Singapore, Swissquote Asia Limited (Hong Kong) licensed by the Hong Kong Securities and Futures Commission (SFC) and Swissquote South Africa (Pty) Ltd supervised by the FSCA.
Products and services of Swissquote are only intended for those permitted to receive them under local law.
All investments carry a degree of risk. The risk of loss in trading or holding financial instruments can be substantial. The value of financial instruments, including but not limited to stocks, bonds, cryptocurrencies, and other assets, can fluctuate both upwards and downwards. There is a significant risk of financial loss when buying, selling, holding, staking, or investing in these instruments. SQBE makes no recommendations regarding any specific investment, transaction, or the use of any particular investment strategy.
CFDs are complex instruments and come with a high risk of losing money rapidly due to leverage. The vast majority of retail client accounts suffer capital losses when trading in CFDs. You should consider whether you understand how CFDs work and whether you can afford to take the high risk of losing your money.
Digital Assets are unregulated in most countries and consumer protection rules may not apply. As highly volatile speculative investments, Digital Assets are not suitable for investors without a high-risk tolerance. Make sure you understand each Digital Asset before you trade.
Cryptocurrencies are not considered legal tender in some jurisdictions and are subject to regulatory uncertainties.
The use of Internet-based systems can involve high risks, including, but not limited to, fraud, cyber-attacks, network and communication failures, as well as identity theft and phishing attacks related to crypto-assets.

US30Y : Not perfect anymoreS&P in 2011
Fitch in 2023
Now Moody downgraded it from AAA to Aa1
The reason is clear. The market thinks debt and interest payments are not sustainable for the US, Europe, Japan, and elsewhere. Bottom line: Nowhere is safe. No government bond is safe.
If it keeps climbing, above 5.25%, the Fed will have to act. The only way is QE. However, this time US will print to save just itself. No more life line swaps for the rest. Tariff would be in place. No trade with uncle SAM anymore. If you reject the rule based order, where you recycle your surplus forex and petrodollar into UST, you can expect no help.
This is the chart to watch if you are playing XAU and BTC.
For DXY, dollar may fall. Just that the other currencies will fall FASTER.
Watch it:
a) go up above 5.25%
b) then watch if the FED goes into action.
Exit stocks like what M.Burry did a few days ago.
Good luck to all of us. This will not end well.

The increasing yields of JGBs might attract a repatriation bidIt seems with the increase in JGB yields we might start to see a strengthening yen. Especially with the possibility of repatriation and a "Mar a lago accord".
Plan accordingly...

Bullish Bond BonanzaThis chart is simply ultra bullish.
This idea attempts to highlight a bullish pattern, within an ultra bullish pattern.
The first pattern is an Inverted Head and Shoulders pattern which has formed over 16 years!
In Oct 23, US30Y breached the 16 year Year High and since then we have created a double bottom (the second pattern) on the 3M chart at near equal lows around 3.9%
US30Y looks like it wants to break out very soon.
The red areas highlights the 3months selling Fair Value Gaps, however the closest unfilled 3M fair value gaps starts around 6.5%
I anticipate that the price will be initially attracted to the 6.5% area, but inverted head and shoulders pattern could play out over several years to get to the overall target.

As GDP Falls Off a Cliff, so Will Interest RatesIt is not different this time. This is how the cycles work. Bond rally of the ages dead ahead

Potential Bond Duration Spread - 'Riding The Yield Curve'I expect short-dated treasury yields to drop, increasing their price
ie. buy short-dated treausries
could also go short ultras but my view is that yields will slowly come down across the board so I will not be buying the spread
COT positioning shows commercials favour shorter duration bonds

Technical Analyses1. Market Direction (up or down)
2. Trend ins (up or down)
3. Entries
i. Higher high- on top) for down trend
ii. Lower low DL for up trend
4. Stop loss
i. 2 levels below
5. Take profit
i. 1:3

BONDS TLT 30Ythe moment of truth, this is the final level for long term bonds to remain bullish, the 30Y has reached the peak


Plotting the decline in ratesplease approximate the next number in the following number sequence: 1187, 850, 455, 266
...
Therefore, the next number in the sequence might be approximately 163
falls in rates are happening faster and faster. forecasts.org predicting 2% rates by april in the 30Y with the drop starting in oct/nov

The 30 Year Bond has never been below 1% beforeWhen theorizing how high TLT can go, remember that the 30 Year Bond has never fallen below 1% in history. There is extra boost below that 1% marker that could potentially send TLT over 200

US Government Bonds 30YR Yeld (US30Y)As inflation trends closer to the Federal Reserve’s 2% target,
speculation grows around a potential interest rate cut.
The futures market anticipates a 50-basis-point reduction
at the conclusion of the Fed’s September meeting and for rates
to be a full percentage point lower than the current 5.25%-5.5%
range by the end of 2024.
