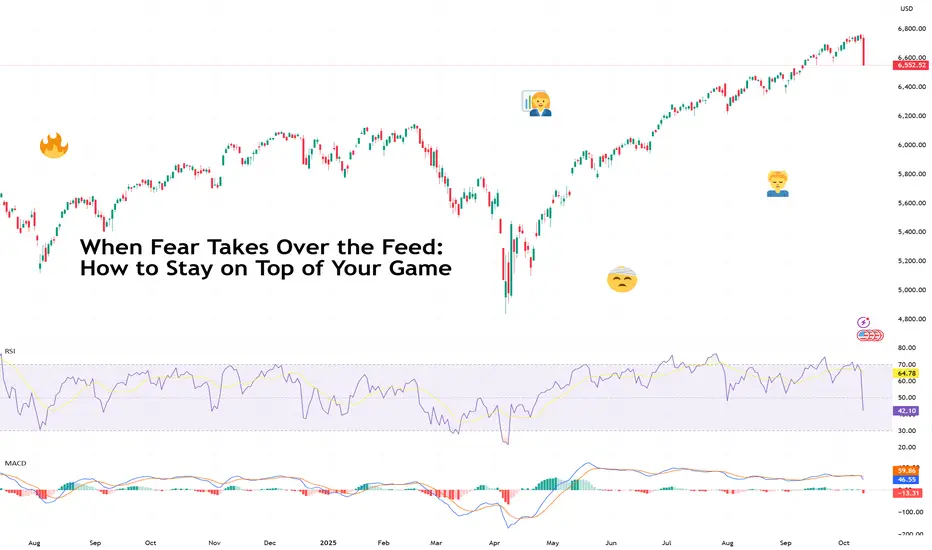
When Fear Takes Over the Feed: How to Stay on Top of Your GameFriday wasn’t just a red day — it was the kind of red that makes traders question their life choices.
The Nasdaq Composite NASDAQ:IXIC plunged 3.6% , its worst day since the April tariff-fueled meltdown.
The S&P 500 SP:SPX dropped 2.7%, the Dow Jones TVC:DJI tumbled nearly 900 points, and $
About S&P 500 Index
Standard and Poor's 500 Index is a capitalization-weighted stock market index measuring the performance of 500 large publicly traded companies in the United States. This index covers a wide range of industries, including technology, healthcare, energy, and finance. It serves as a benchmark for the overall health of the U.S. stock market, as well as a reflection of the country's economic strength.
Substantial gains in the S&P 500 are often interpreted as positive signals for the economy, while losses can be seen as indicators of potential trouble. Investors use this index as a barometer for their own portfolios and to assess the performance of individual stocks. The S&P 500 index plays a vital role in the financial world and is closely watched by analysts and policymakers.
Substantial gains in the S&P 500 are often interpreted as positive signals for the economy, while losses can be seen as indicators of potential trouble. Investors use this index as a barometer for their own portfolios and to assess the performance of individual stocks. The S&P 500 index plays a vital role in the financial world and is closely watched by analysts and policymakers.
Related indices
Hellena | SPX500 (4H): LONG to resistance area of 6777.Price made a sharp and strong move to the 6503 level, making wave “4” quite large, but this move did not break the structure.
I think that now the price is in the big wave "5" and middle wave "2".
I think that there will be an upward movement with the purpose to renew the maximum of the wave "3" of

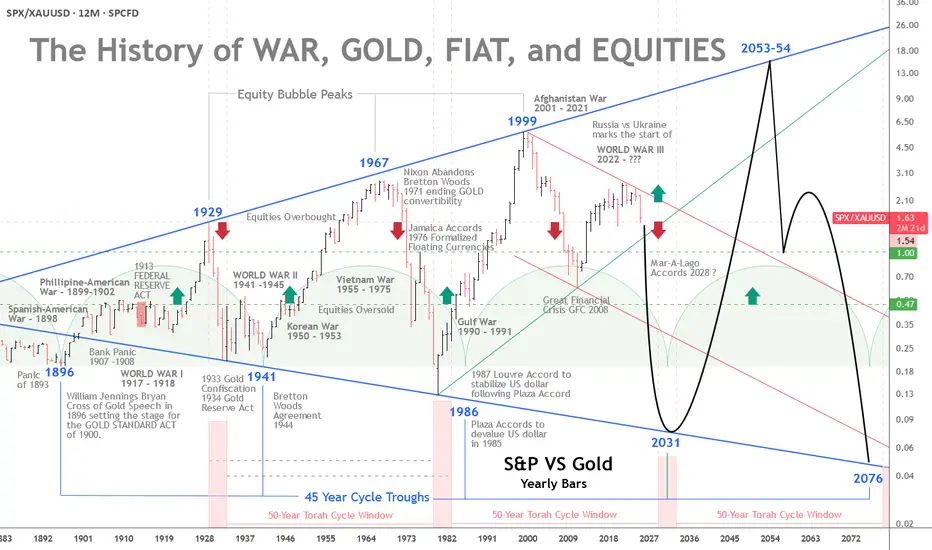
The History of War, Gold, Fiat, and EquitiesGold vs. Equities — The 45-Year Cycle and a Pending Monetary Reset
The interplay of war, gold, fiat money, and equities has long been a barometer of real wealth and economic stability. A recurring pattern emerges across modern history: approximately 45-year intervals when gold strengthens relative
I can't believe nowbody saw this coming for crypto. S&P 500 Technical Analysis: Long-Term Channel Pattern
The S&P 500 has been trading within a well-defined ascending parallel channel for over 5 years. As shown in the chart, the index has consistently respected both the upper resistance and lower support trendlines of this channel throughout this

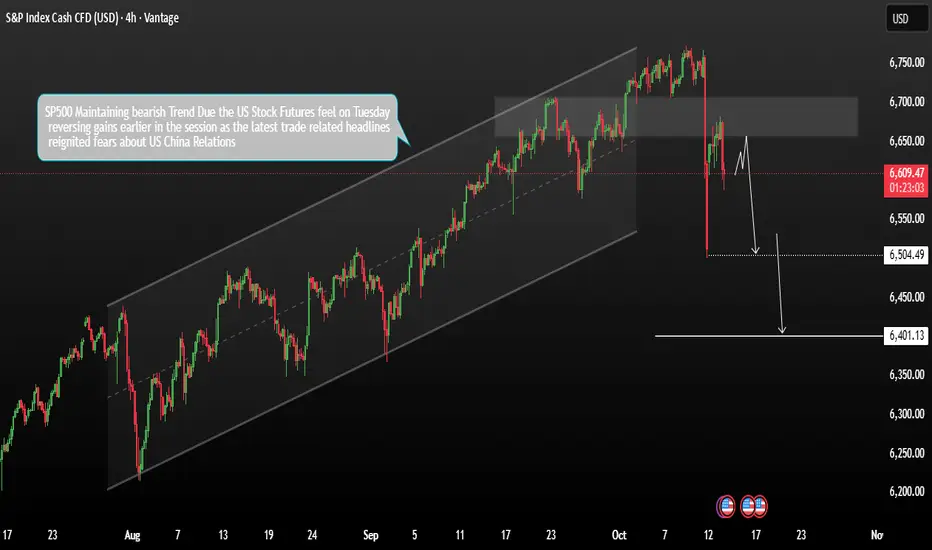
SP500Consoldation Could Next falling patternSP500 Price consolidation a bearish trend due the U.S. stock futures fell on Tuesday, reversing earlier gains as renewed concerns over U.S.–China trade relations weighed on sentiment. The latest trade-related headlines reignited fears of escalating tensions between the two economic powers.
These mo
$SPX500 by all metrix this is overboughtMarkets can stay irrational longer than we can stay solvent. Right now, we’re at the top of this megaphone pattern, with everything extremely overbought in epic fashion.
⚠️ Caution: the odds of a serious correction are high — the chart points to a potential target around $5,650.
Sure, the madness
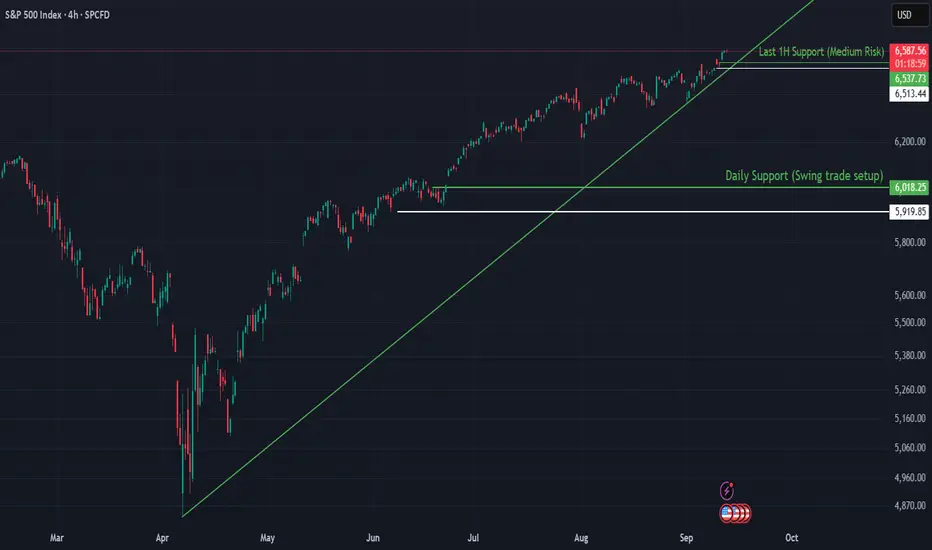
SPX Supported by Trendline and Rate Cut ExpectationsThe S&P 500 has been climbing steadily, with the ascending trendline from April acting as a reliable backbone for the move. Despite short-term volatility, buyers continue to defend higher lows. Coupled with expectations of interest rate cuts, the trend structure remains intact unless key supports gi
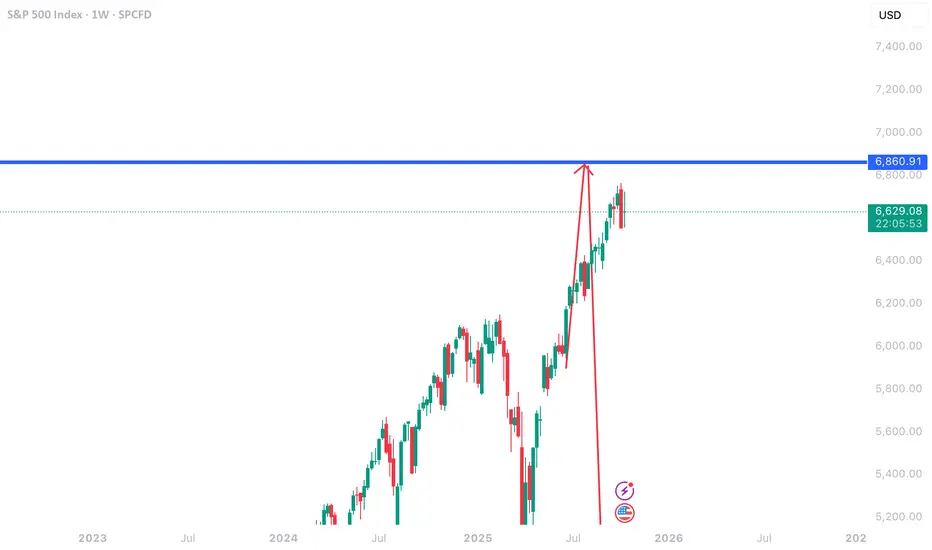
SPX ceiling has set in, we expect no further bull activity!This will happen, what will cause it, I don't know.........
NO MORE BULL ACTIVITY FOR SPX, ITS ONLY DOWN FROM HERE - Goldstandard212
Friday will be bloody for SPX. We've been calling the bull move since 5,900$ and before I opened this account, even lower (the bottom).
Please see linked ideas to
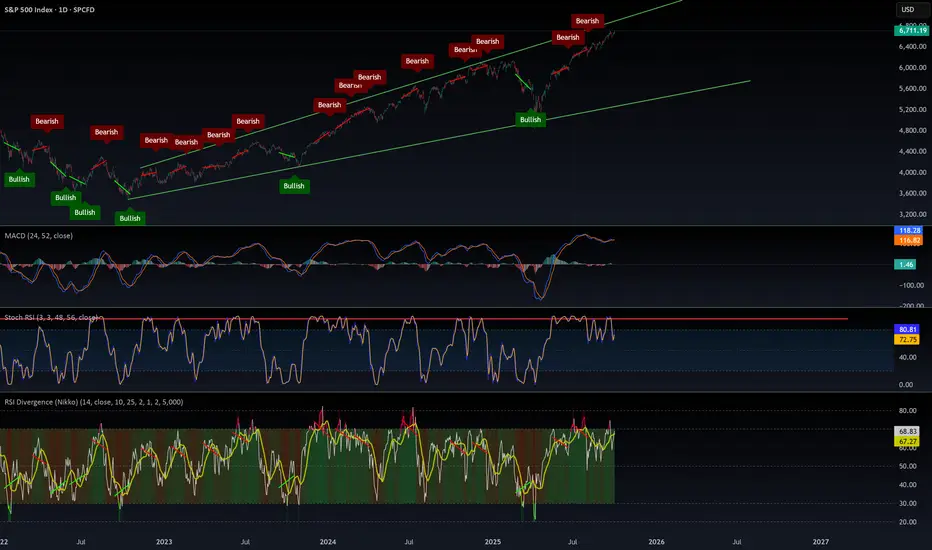
S&P 500 (SPX) Technical Outlook Moving Forward Overview
The S&P 500 remains in a clear upward trajectory despite last Friday’s sharp selloff. The drop was largely imminent after a historic rally from the April tariff lows, with the index marking consecutive all-time highs before facing resistance at the upper boundary of the long-term ascending

S&P500 Can the 1D MA50 save the day?The S&P500 index (SPX) has been trading within a 5-month Channel Up and last Friday's flash crash touched its bottom making a new Higher Low. At the same time, it hit its 1D MA50 (blue trend-line) for the first time May 01 2025.
As long as the market keeps closing the daily candles inside the Chann

See all ideas
Summarizing what the indicators are suggesting.
Oscillators
Neutral
SellBuy
Strong sellStrong buy
Strong sellSellNeutralBuyStrong buy
Oscillators
Neutral
SellBuy
Strong sellStrong buy
Strong sellSellNeutralBuyStrong buy
Summary
Neutral
SellBuy
Strong sellStrong buy
Strong sellSellNeutralBuyStrong buy
Summary
Neutral
SellBuy
Strong sellStrong buy
Strong sellSellNeutralBuyStrong buy
Summary
Neutral
SellBuy
Strong sellStrong buy
Strong sellSellNeutralBuyStrong buy
Moving Averages
Neutral
SellBuy
Strong sellStrong buy
Strong sellSellNeutralBuyStrong buy
Moving Averages
Neutral
SellBuy
Strong sellStrong buy
Strong sellSellNeutralBuyStrong buy
Displays a symbol's price movements over previous years to identify recurring trends.
Frequently Asked Questions
The current value of S&P 500 Index is 6,727.54 USD — it has risen by 0.53% in the past 24 hours. Track the index more closely on the S&P 500 Index chart.
S&P 500 Index reached its highest quote on Oct 9, 2025 — 6,764.58 USD. See more data on the S&P 500 Index chart.
The lowest ever quote of S&P 500 Index is 2.73 USD. It was reached on Jun 1, 1877. See more data on the S&P 500 Index chart.
S&P 500 Index value has decreased by −1.13% in the past week, since last month it has shown a 0.90% increase, and over the year it's increased by 14.82%. Keep track of all changes on the S&P 500 Index chart.
The top companies of S&P 500 Index are NASDAQ:NVDA, NASDAQ:MSFT, and NASDAQ:AAPL — they can boast market cap of 4.45 T USD, 3.82 T USD, and 3.74 T USD accordingly.
The highest-priced instruments on S&P 500 Index are NYSE:NVR, NASDAQ:BKNG, and NYSE:AZO — they'll cost you 7,639.06 USD, 5,070.02 USD, and 4,030.17 USD accordingly.
The champion of S&P 500 Index is NASDAQ:HOOD — it's gained 379.73% over the year.
The weakest component of S&P 500 Index is NASDAQ:TTD — it's lost −57.91% over the year.
S&P 500 Index is just a number that lets you track performance of the instruments comprising the index, so you can't invest in it directly. But you can buy S&P 500 Index futures or funds or invest in its components.
The S&P 500 Index is comprised of 503 instruments including NASDAQ:NVDA, NASDAQ:MSFT, NASDAQ:AAPL and others. See the full list of S&P 500 Index components to find more opportunities.