UBER Holding Trendline Support – Bullish Rebound SetupUber is respecting a long-term ascending trendline and has recently bounced from this key support area. RSI is also recovering from lower levels, indicating improving momentum. As long as price stays above the trendline, bullish bias remains valid; a clean break below it would invalidate this setup
Key facts today
Next report date
—
Report period
—
EPS estimate
—
Revenue estimate
—
4.82 USD
10.05 B USD
52.02 B USD
2.00 B
About Uber Technologies, Inc.
Sector
Industry
CEO
Dara Khosrowshahi
Website
Headquarters
San Francisco
Founded
2009
IPO date
May 10, 2019
Identifiers
3
ISIN US90353T1007
Uber Technologies, Inc provides a platform that allows users to access transportation and food ordering services. The Company operates through two segments: Core Platform and Other Bets. The Core Platform segment consists of Ridesharing and Uber Eats. The Other bets segment consists of Uber Freight and New Mobility platforms. Ridesharing refers to products that connects consumers with drivers who provide rides in a variety of vehicles, such as cars, auto rickshaws, motorbikes, minibuses and taxis. Its Uber Eats platform allows consumers to search for and discover local restaurants and order meals through online. Its Freight platform creates a transparent and on-demand marketplace that connects shippers and carriers. New Mobility product that provide consumers with access to rides through a variety of modes, including dockless e-bikes and e-scooters.
Related stocks


UBER Great Returns Ahead!!!Uber has been trading within a clearly defined rising wedge. If price manages to hold above wedge support, we expect it to resume trending higher toward the upper resistance zone marked in blue. This move would likely represent the final impulsive leg (Wave 5) of the current structure, as shown on t

UBER Pre-Earnings Analysis: Quant-Backed Bull Call SpreadUBER QuantSignals V4 Earning 2026-02-03
Bias: Bullish
Event: Earnings (binary, high risk)
Implied Move: ±$5.7 (~7.4%)
IV Rank: 32% (low → limited IV crush)
Trade Idea:
Bull Call Spread: Buy $77 Call / Sell $80 Call
Expiry: Feb 7, 2026
Cost: ~$1.40
Max Profit: ~$1.60
Max Loss: ~$1.40
What

UBER 4H UBER, On the 4 hour chart looking in we can see a potential multiple bottom setting up this is an excellent place for uber to catch a bid.

$UBER isn't cheap!- NYSE:UBER shouldn't trade more than $65 until they start improving EPS
- Fundamentally,
Year | 2026 | 2027 | 2028
EPS | 3.49 | 4.46 | 5.32
EPS% | -34.92% | 27.77% | 19.35%
2026 : we are getting big reduction in EPS yoy and next year it's increasing by 27% and then moderating to high teens.
P

UBER 4H TECHNICAL ANALYSIS So here we have the 4h chart and as you can see uber seems to be forming a reversal bottom. I'm targeting the cherry at or above previous highs. Questions and comments are welcome, i do reply with generosity and kindness'

UBER- Uber Technologies, Inc. touched the bullish trend line
- Support aligned with trend line and Fibonacci levels
- I'm looking at $117 to $128 price soon

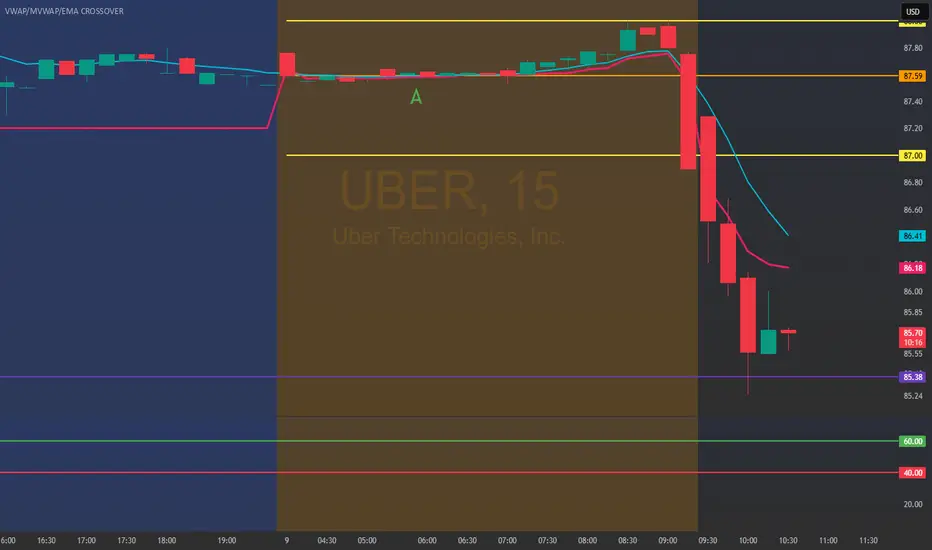
Hello Trader, part #2 UBER: 85.85 result. As we mentioned #1www.tradingview.com
the bullish entry point was above 89.00 with a possible profit target of 92.50.
The bearish entry point was below 87.00 with a reversal point quite far away, but the stock went to reach it. This was today's result; I hope you took advantage of it.
Uber’s "Hybrid" Pivot: Why Robotaxi Threat is Now an OpportunityTime Horizon: Long-term, Bias: Bullish (Long)
The "Big Picture" (Summary) For years, the biggest fear for Uber investors was that autonomous vehicles (like Tesla or Waymo) would make the company obsolete. However, the newly confirmed partnership with Lucid and Nuro changes the story completely. In

See all ideas
Summarizing what the indicators are suggesting.
Neutral
SellBuy
Strong sellStrong buy
Strong sellSellNeutralBuyStrong buy
Neutral
SellBuy
Strong sellStrong buy
Strong sellSellNeutralBuyStrong buy
Neutral
SellBuy
Strong sellStrong buy
Strong sellSellNeutralBuyStrong buy
An aggregate view of professional's ratings.
Neutral
SellBuy
Strong sellStrong buy
Strong sellSellNeutralBuyStrong buy
Neutral
SellBuy
Strong sellStrong buy
Strong sellSellNeutralBuyStrong buy
Neutral
SellBuy
Strong sellStrong buy
Strong sellSellNeutralBuyStrong buy
Displays a symbol's price movements over previous years to identify recurring trends.
UBRT5886387
Uber Technologies, Inc. 5.35% 15-SEP-2054Yield to maturity
5.73%
Maturity date
Sep 15, 2054
UBRT6170119
Uber Technologies, Inc. 4.8% 15-SEP-2035Yield to maturity
4.92%
Maturity date
Sep 15, 2035
UBRT5886385
Uber Technologies, Inc. 4.8% 15-SEP-2034Yield to maturity
4.86%
Maturity date
Sep 15, 2034
UBRT5237349
Uber Technologies, Inc. 4.5% 15-AUG-2029Yield to maturity
4.46%
Maturity date
Aug 15, 2029
UBRT6170118
Uber Technologies, Inc. 4.15% 15-JAN-2031Yield to maturity
4.30%
Maturity date
Jan 15, 2031
UBRT5886386
Uber Technologies, Inc. 4.3% 15-JAN-2030Yield to maturity
4.09%
Maturity date
Jan 15, 2030
UBRT5706997
Uber Technologies, Inc. 0.875% 01-DEC-2028Yield to maturity
—
Maturity date
Dec 1, 2028
UBRT6077245
Uber Technologies, Inc. 0.0% 15-MAY-2028Yield to maturity
—
Maturity date
May 15, 2028
See all UBER bonds
Frequently Asked Questions
The current price of UBER is 74.77 USD — it has decreased by −1.49% in the past 24 hours. Watch Uber Technologies, Inc. stock price performance more closely on the chart.
Depending on the exchange, the stock ticker may vary. For instance, on NYSE exchange Uber Technologies, Inc. stocks are traded under the ticker UBER.
UBER stock has fallen by −8.43% compared to the previous week, the month change is a −14.09% fall, over the last year Uber Technologies, Inc. has showed a 13.86% increase.
We've gathered analysts' opinions on Uber Technologies, Inc. future price: according to them, UBER price has a max estimate of 150.00 USD and a min estimate of 72.00 USD. Watch UBER chart and read a more detailed Uber Technologies, Inc. stock forecast: see what analysts think of Uber Technologies, Inc. and suggest that you do with its stocks.
UBER reached its all-time high on Sep 22, 2025 with the price of 101.99 USD, and its all-time low was 13.71 USD and was reached on Mar 18, 2020. View more price dynamics on UBER chart.
See other stocks reaching their highest and lowest prices.
See other stocks reaching their highest and lowest prices.
UBER stock is 4.39% volatile and has beta coefficient of 1.51. Track Uber Technologies, Inc. stock price on the chart and check out the list of the most volatile stocks — is Uber Technologies, Inc. there?
Today Uber Technologies, Inc. has the market capitalization of 156.27 B, it has decreased by −0.74% over the last week.
Yes, you can track Uber Technologies, Inc. financials in yearly and quarterly reports right on TradingView.
Uber Technologies, Inc. is going to release the next earnings report on May 6, 2026. Keep track of upcoming events with our Earnings Calendar.
UBER earnings for the last quarter are 0.14 USD per share, whereas the estimation was 0.79 USD resulting in a −82.20% surprise. The estimated earnings for the next quarter are 0.71 USD per share. See more details about Uber Technologies, Inc. earnings.
Uber Technologies, Inc. revenue for the last quarter amounts to 14.37 B USD, despite the estimated figure of 14.32 B USD. In the next quarter, revenue is expected to reach 13.37 B USD.
UBER net income for the last quarter is 296.00 M USD, while the quarter before that showed 6.63 B USD of net income which accounts for −95.53% change. Track more Uber Technologies, Inc. financial stats to get the full picture.
No, UBER doesn't pay any dividends to its shareholders. But don't worry, we've prepared a list of high-dividend stocks for you.
EBITDA measures a company's operating performance, its growth signifies an improvement in the efficiency of a company. Uber Technologies, Inc. EBITDA is 6.84 B USD, and current EBITDA margin is 12.08%. See more stats in Uber Technologies, Inc. financial statements.
Like other stocks, UBER shares are traded on stock exchanges, e.g. Nasdaq, Nyse, Euronext, and the easiest way to buy them is through an online stock broker. To do this, you need to open an account and follow a broker's procedures, then start trading. You can trade Uber Technologies, Inc. stock right from TradingView charts — choose your broker and connect to your account.
Investing in stocks requires a comprehensive research: you should carefully study all the available data, e.g. company's financials, related news, and its technical analysis. So Uber Technologies, Inc. technincal analysis shows the sell today, and its 1 week rating is sell. Since market conditions are prone to changes, it's worth looking a bit further into the future — according to the 1 month rating Uber Technologies, Inc. stock shows the sell signal. See more of Uber Technologies, Inc. technicals for a more comprehensive analysis.
If you're still not sure, try looking for inspiration in our curated watchlists.
If you're still not sure, try looking for inspiration in our curated watchlists.