SPX Technical Levels to watchSPX (S&P 500) Technical Levels Quick Breakdown
Current Price: 6,552.51 (as of Oct 10, 2025 close, down 2.71%; futures suggest mild rebound at Oct 11 open).
Key Levels (Classic Pivots):
Support: S1 $6,576 | S2 $6,562 (watch for breakdown below S2 toward $6,500).
Resistance: R1 $6,613 | R2 $6,637 (clearing R1 eyes $6,700 round number).
Pivot: $6,600 (neutral gravity point).
Key Indicators (Daily Timeframe):
RSI(14): 18.6 (deeply oversold—potential bounce setup above 30).
MACD(12,26): -34.8 (strong sell signal, bearish momentum).
Moving Averages: All sell (e.g., 5-day SMA $6,602; 50-day $6,717; 200-day $6,619—price well below, confirming downtrend).
Overall: Strong sell across MAs and indicators, but oversold RSI flags exhaustion risk for a relief rally. Watch volume on any upside push.
Trade ideas
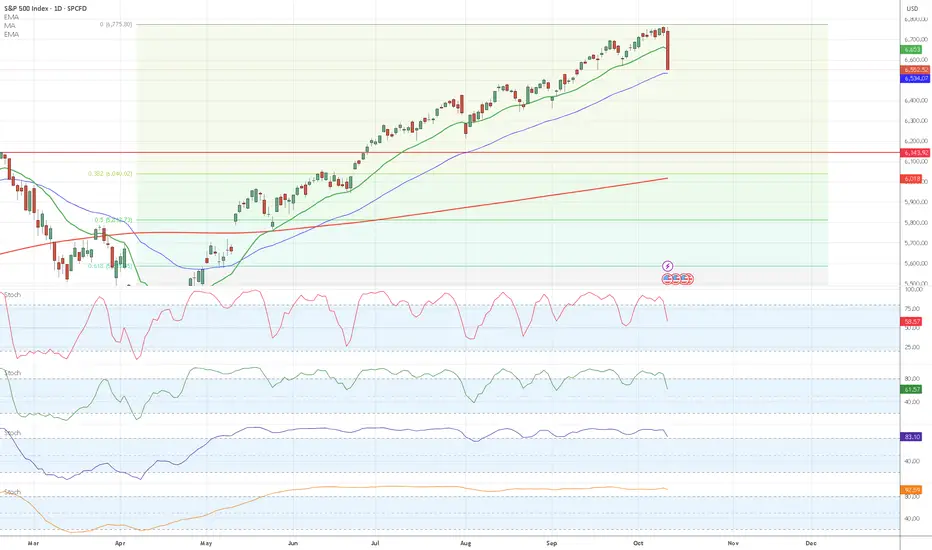
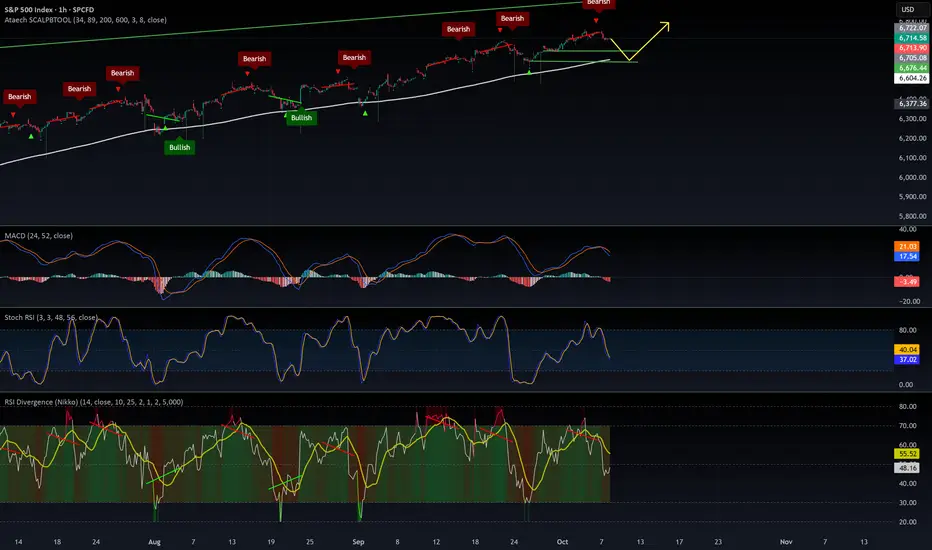
SPX Current Technical analysis of the SPX, Focus on the Stochastics, channel lines and recohnizable patterns

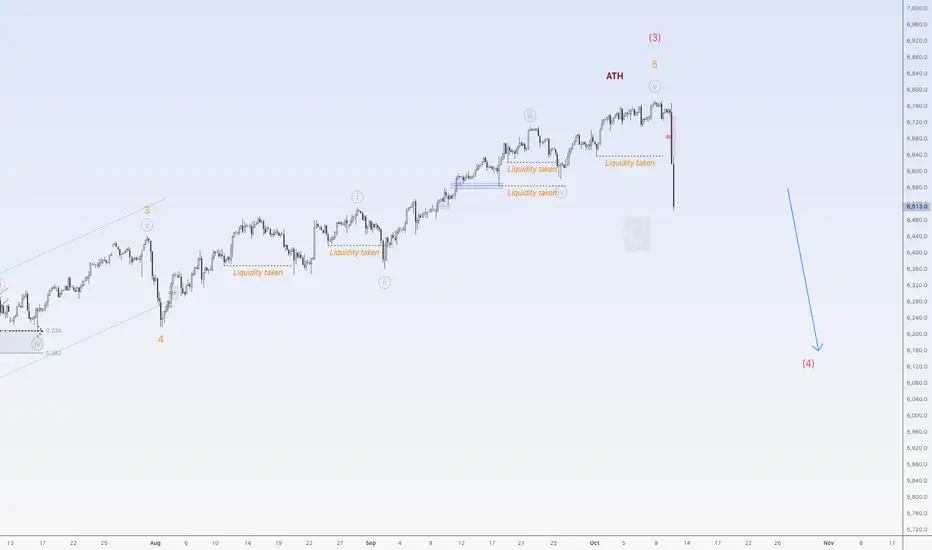
Bigger correction down for SPX500USDHi traders,
I called the top in my outlook of last week for SPX500USD.
After a small correction last week it went up one more time to make a new ATH. After that it dropped.
Now it started the bigger correction down.
So next week we could see a correction up and more downside for this pair.
Let's see what the market does and react.
Trade idea: Wait for a correction up and a change in orderflow to bearish on a lower timeframe to trade shorts.
If you want to learn more about trading FVG's & liquidity sweeps with Elliott wavecount and patterns, then please make sure to follow me.
This shared post is only my point of view on what could be the next move in this pair based on my technical analysis.
Don't be emotional, just trade your plan!
Eduwave
S&P 500 (US500) Multi-Timeframe StrategyS&P 500 (US500) Technical Analysis | October 11, 2025 UTC+4 Multi-Timeframe Strategy
Closing Price: 6,508.2 | Market Context: Trading at all-time highs with institutional accumulation evident
Market Structure Analysis
The S&P 500 demonstrates robust bullish momentum, having broken through the critical 6,500 psychological barrier. Daily chart reveals a mature impulse wave in Elliott Wave terminology (Wave 5 extension), supported by expanding volume profiles. Wyckoff analysis indicates we're in a Phase E markup following successful re-accumulation between 5,800-6,200. The Ichimoku cloud on 4H timeframe shows price trading above all components (bullish alignment), with Tenkan-sen (9-period) at 6,485 providing dynamic support. Gann analysis using the Square of 9 identifies 6,528 as the next natural resistance level, with time-price squaring suggesting October 15-17 as a potential pivot zone.
Technical Indicators Confluence
RSI (14): Daily = 68 (approaching overbought but not extreme), 4H = 71 (caution zone).
Bollinger Bands: Price riding the upper band on 4H (expansion phase), suggesting continuation with potential volatility.
VWAP Analysis: Anchored from October 1st shows strong positioning above 6,465; volume profile indicates acceptance above 6,480 with 82% bullish volume dominance. Moving Averages: Golden cross intact (50 EMA > 200 EMA by 340 points), 21 EMA at 6,470 acting as immediate support. Harmonic pattern detection reveals a potential Butterfly completion near 6,550-6,580 zone (1.272-1.618 Fibonacci extension).
Critical Levels & Pattern Recognition
Support Structure: 6,485 (Tenkan-sen + 4H demand), 6,465 (VWAP anchor), 6,440 (daily pivot + Gann 45° angle), 6,400 (psychological + Wyckoff spring test). Resistance Zones: 6,528 (Gann Square of 9), 6,550-6,580 (Butterfly PRZ + 1.618 extension), 6,620 (weekly resistance). Pattern Alert: Watch for potential bull trap formation if price spikes above 6,580 on declining volume—this would signal exhaustion. Current candlestick structure shows consistent higher highs/higher lows with no reversal patterns (no shooting stars or bearish engulfing yet).
Intraday Trading Strategy (5M-4H Charts)
BUY ZONES: Primary entry: 6,485-6,495 (confluence of Ichimoku + VWAP support) | Stop Loss: 6,465 (risk 20-30 points) | Targets: T1: 6,520 (quick scalp, 25 points), T2: 6,545 (risk-reward 1:2), T3: 6,575 (swing extension). Secondary Entry: Aggressive long on breakout above 6,528 with volume confirmation (minimum 20% above 20-period average) | Stop: 6,510 | Target: 6,565-6,580.
SELL/SHORT ZONES: Counter-trend short only if rejection at 6,580 with bearish divergence on RSI + shooting star formation | Entry: 6,575-6,585 | Stop: 6,595 | Target: 6,520, 6,485. Intraday Bias: 75% bullish until broken below 6,465.
Swing Trading Strategy (Daily-Weekly)
Position Building: Accumulate on pullbacks to 6,440-6,465 zone (25-35% position) with 4-6 day holding period | Full position stop: 6,390 (swing low violation). Profit Targets: Conservative: 6,580 (exit 50%), Aggressive: 6,650-6,720 (monthly target based on Elliott Wave projection and Gann time cycles suggesting completion by October 28-31). Risk Management: Trail stops below each daily higher low; current trail at 6,465. If price closes below 21 EMA on daily (6,470), reduce exposure by 60%. Wave Count: Currently in Wave 5 of (5) of larger degree—expect final parabolic move but prepare for 8-12% correction when complete (target retracement to 5,950-6,050 zone).
Market Context & Catalyst Watch
Geopolitical landscape shows stabilization in Middle East tensions, supporting risk-on sentiment. Fed policy remains neutral (hold position), but monitor October 17th retail sales data and October 23rd PMI releases—strong data could push us to 6,650; weak data triggers profit-taking. VIX at 13.2 (complacency zone) suggests low fear but increases gap-risk. Volume analysis critical: Declining volume on new highs would confirm distribution (Wyckoff Phase E to Phase A transition)—watch for volume 25% below 20-day average as warning signal. Institutional flow data shows continued net buying but decelerating pace.
Execution Playbook
Monday-Tuesday: Expect consolidation 6,485-6,520; ideal for range scalping. Wednesday-Thursday: Gann time window suggests volatility expansion; breakout likely. Friday: Monthly options expiry could create pinning effect near 6,500. Best trades: Long on dips to 6,485-6,495 with tight stops OR breakout long above 6,528 on volume. Avoid: Chasing above 6,550 without pullback; shorting below 6,580 without clear reversal confirmation. Risk no more than 0.5-1% account per intraday trade, 2% for swing positions. This market rewards patience at support and aggression at breakouts—trade the plan, not emotions.

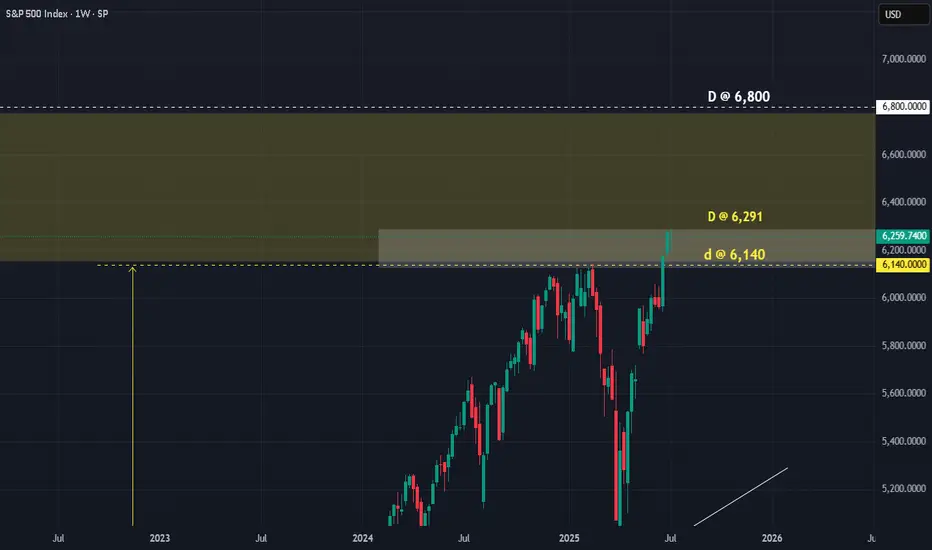
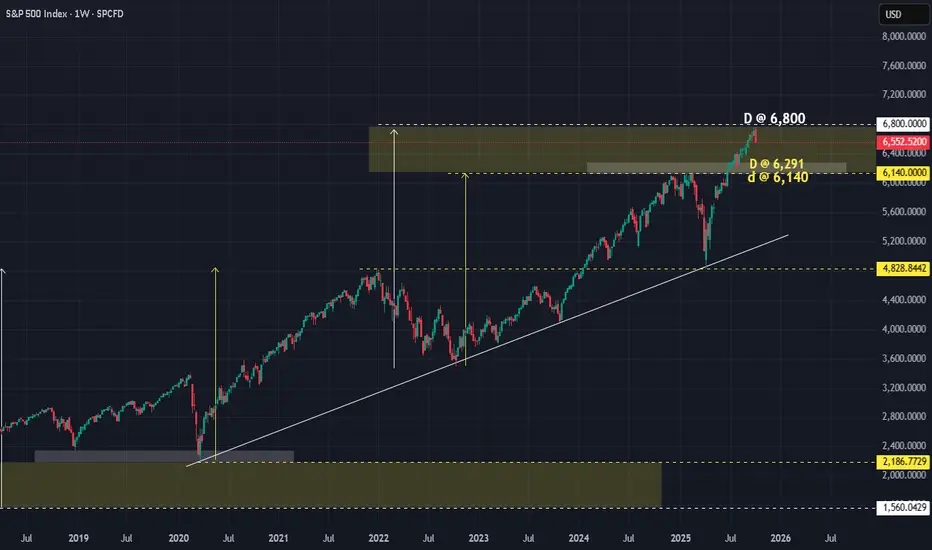
SPX : How to play this DPrice has now reached our target as anticipated. The question is, when do we SELL?
Anyway, for those who follow the D, I am sure it has saved you guys a lot of trouble. At least you know where/when to start SELLING. Many others who started selling EARLy had all lost their money.
As we can see, there are 3 D's. Price can still move UP to 6,800. Bear that in mind. Or has already reached the max at 6,291!!!
Price is at where they are, there are 2 choices:
a) SELL now and SL @ 6,300
b) SELL when price touched the lower D @ 6,140 with SL @ 6,291
Whichever way, the R/R is still FANTASTIC.
It is true that MARKET MAKER might still take advantage and try to screw short sellers. But even they would find it hard at the D. For even they need to respect it a bit.
If you know your D, you trade safer.
Good luck.
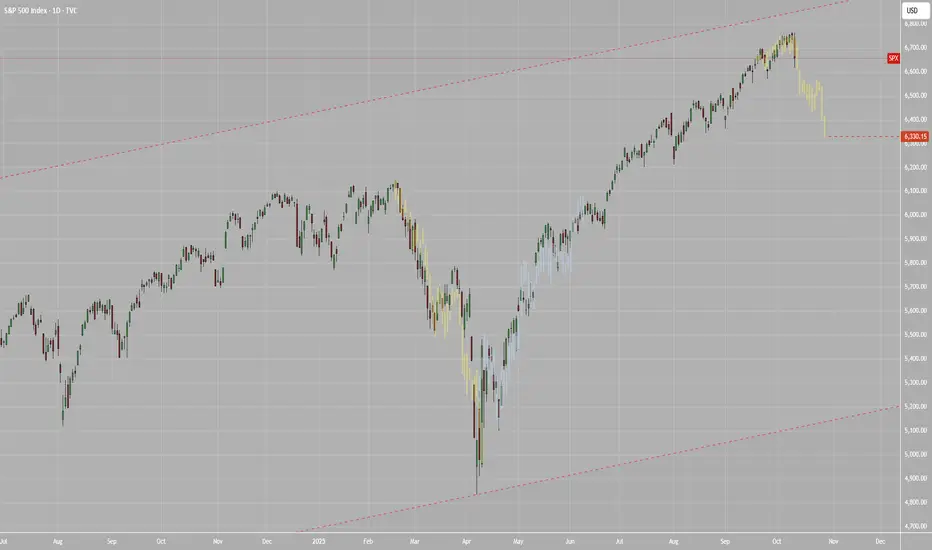
SPX : Remember what I wrote on 14 Jul 2025Long ago, I put up this chart.
Thanks to Trump, it is finally a reality.
Price has nowhere else to go but DOWN.
This is the kind of MONEY you can make by being patient.
Good luck.
DJI and SPX ---- ;-)
S&P 500 - GRAND MARKET OUTLOOKS&P 500 - GRAND MARKET OUTLOOK BY FIBCOS
This analysis integrates multiple layers of market interpretation, combining Elliott Wave Theory across Supercycle , Macro , Micro , and Sub-Micro degrees with Smart Money Concepts (SMC) , price action behavior, and Fibonacci retracements/extensions to project the S&P 500 ’s long-term trajectory. It captures how institutional capital rotates through accumulation and distribution phases, aligned with macroeconomic cycles, policy shifts, and investor sentiment. Each wave is grounded in historical and forward-looking fundamental events—from post-war booms to financial crises to the current AI-driven tech surge. The use of Fibonacci ratios (1.618, 3.618, 5.618) provides mathematical confluence for wave targets, while price structure confirms the ongoing impulsive behavior. Altogether, it creates a cohesive, multi-dimensional forecast expected to culminate in a Supercycle Wave (III) top around Q1 2029 , with an S&P 500 target between 20,000(20K).
🌀 Supercycle Wave (III) — The Final Ascent (1942–2029*)
🌍 SUPERCYCLE STRUCTURE: The Multi-Generational Bull
We are inside Supercycle Wave (III) which began in 1942 and is unfolding in 5 Macro Impulse Waves . Each of these macro waves has further Micro and Sub-Micro waves. As of 2025, we're in the final stretch of this grand cycle, specifically:
👉 Sub-Micro Wave ③ of Micro Wave ⑤ of Macro Wave ⑤ of Supercycle Wave (III)
Final top expected in Q1 2029 , around the 20,000 (20K) zone 📍
🧭 MACRO WAVE TIMELINE (Supercycle III)
🔹 Macro Wave ① (1942–1968): 🌟 Post-War Industrial Renaissance
Fundamentals:
WWII victory → economic dominance
Baby boom, suburbanization, auto and housing expansion
Bretton Woods system established USD supremacy 💵
Smart Money Insight:
Institutional capital rotated from war manufacturing into consumer goods, construction, and tech foundations
Price Action: Strong impulsive move with clean higher highs/lows
Fibonacci Insight: Laid the base for 1.618 extension targets
Ends in 1968 with rising inflation and Vietnam drag
🔹 Macro Wave ② (1968–1974): 🌪️ Stagflation Storm
Fundamentals:
Vietnam War expenditures
Gold standard broken (1971 Nixon shock)
Oil embargo, inflation > growth
Price Action: Deep correction, volatile chop, broad distribution
SMC Insight: Institutions exited cyclicals, quietly accumulated future outperformers (tech, defense)
Fibonacci: 0.236% retracement of Super Cycle Wave ii
🔹 Macro Wave ③ (1974–2000): 🚀 Tech & Financialization Explosion
Fundamentals:
Reaganomics & deregulation
PC revolution, Internet birth, globalization 🌐
Explosion in derivatives, S&P futures, ETFs
SMC: Institutions accumulated during 70s lows, fueled tech IPO boom (Apple, Microsoft)
Price Action: Violent rallies with accelerating slope — classic 3rd wave behavior
Fibonacci: Extended well beyond 4.618% of Macro ① & ② — true power wave
🔹 Macro Wave ④ (2000–2009): 🌊 Dot-Com + Financial Crisis Correction
Fundamentals:
Dot-Com bust ➜ $5T in lost value
9/11 shocks & Iraq war
GFC: Housing bubble → global banking collapse
Price Action: Double top structure (2000 & 2007), multi-leg correction
SMC Insight: Smart money cashed out in 2000 and 2007; bought again heavily in March 2009
Structure: WXY complex correction, bottoming with V-shape GFC recovery
Fibonacci: 0.236% retracement of Macro ②
🔶 MACRO WAVE ⑤ (2009–2029): 🔥 The Final Ascent – AI, Liquidity & Euphoria
This is the final macro wave of Supercycle (III), and it subdivides into 5 Micro Impulse Waves.
We are now in Micro Wave ⑤ , which itself contains Sub-Micro Waves 1–5.
🔷 Micro Wave ① (2009–Apr 2010): 🪙 The Bounce from Oblivion
Fundamentals:
Fed QE1 💉, bailouts (TARP), 0% rates
Fear of deflation flipped to hunt for yield
Price Action: Clean V-bottom, shallow pullbacks
SMC: Institutions were loading REITs, tech, and banks post-GFC carnage
🔷 Micro Wave ② (Apr 2010–Jun 2010): 🩻 Flash Crash Flush
Fundamentals:
Euro debt scare, Greece bailout, volatility spike
Price Action: Sharp correction, liquidity vacuum
Fibonacci: Textbook 0.236% retracement
SMC: Stop hunt phase — liquidity grab before next leg
🔷 Micro Wave ③ (Jun 2010–2018): 🚀 Passive Investing Boom
Fundamentals:
QE2, QE3 → massive central bank asset inflation
Apple, Amazon, Google explode in earnings and valuation
ETF revolution = automated capital flows
Price Action: Relentless trend with low volatility
Fibonacci: 2.618+ extension of Wave ①
SMC: Institutions began multi-year hold strategies (FANGM), volatility sellers emerged
🔷 Micro Wave ④ (2018–2020): ⚠️ Volatility & COVID Shock
Fundamentals:
Rate hikes (2018), trade war (US-China)
COVID black swan — global shutdown, crude oil collapse (went negative!)
Price Action: Massive drop with record velocity (VIX > 80)
SMC: Panic selling, smart money accumulation March 2020
🔵 MICRO WAVE ⑤ (2020–2029): 📈 The Final Climb Begins
This is where we are now. This Micro Wave ⑤ is subdividing into:
🟢 Sub-Micro Wave ① (Mar 2020 – Nov 2021): 💹 Stimulus Mania
Fundamentals:
Unlimited QE, COVID relief checks
Crypto/NFT mania, meme stocks (GME/AMC)
Retail explosion via Robinhood & Reddit
Price Action: Parabolic rally, overbought signals
SMC: Institutions faded retail euphoria mid-2021
🟡 Sub-Micro Wave ② (Nov 2021 – Oct 2022): 🔻 Inflation Reckoning
Fundamentals:
CPI > 9%, Fed hikes aggressively
Yield curve inversion, tech meltdown
Price Action: 0.236% retracement
SMC: Smart money rotated into energy, defense, and value stocks during panic
Sentiment : Retail fled, fear extreme — perfect accumulation zone
🔴 Sub-Micro Wave ③ (Oct 2022 – Est. 2027): ⚡ AI Supercycle Ignites
CURRENT WAVE IN PROGRESS
Fundamentals:
AI revolution (ChatGPT, LLMs, Robotics, Automation)
Cloud, semiconductors, defense, biotech surge
Fiscal policy dominance, wars & tech race 🧠
Price Action:
Clean impulse structure
Shallow pullbacks, breakout-retest continuation
SMC:
Institutions aggressively long AI/Defense (Nvidia, Palantir, defense contractors)
Liquidity injections in dips, stealth breakouts
Fibonacci Target: 3.618 extension ~11,200
Expected to peak in 2026
🟠 Sub-Micro Wave ④ (Est. 2027-2028): 🧯 Last Shakeout Before the Climax
Expect:
Profit-taking, geopolitical panic, credit stress
Retest of broken trendline or previous resistance zone
Fibonacci : Retrace 0.236–0.382 of Wave ③
SMC: Final accumulation before blow-off top
🔵 Sub-Micro Wave ⑤ (Est. 2028–Q1 2029): 🚨 Blow-Off Top: 20,000 Target
Fundamentals:
Peak optimism: “AI replaces everything”, euphoria
Retail mania, influencer ETFs
Fed/central banks possibly easing again to avoid slowdown
Price Action: Parabolic, low pullbacks, extreme momentum, RSI divergence, volume climax
SMC: Massive institutional distribution — quiet selling into strength
Target: ~20,000 (5.618 of Wave ①), final top of Supercycle (III)
🛑 What Comes After? SUPERCYCLE WAVE (IV): 🔻 Decade-Long Reset (2029–2040?)
Major correction, potentially multi-decade sideways or secular bear
Catalyst? AI bust, geopolitical war, credit collapse
"Stay focused on structure, not emotions." - FIBCOS
📘 Disclaimer: This is a structural, educational market outlook. Not financial advice. Please do your own due diligence and risk management.
#FIBCOS #ElliottWave #SmartMoneyConcept #MarketAnalysis #Gold #XAUUSD #ElliottWave #WaveTheory #SuperCycle #MacroTrend #SmartMoney #Fibonacci #PriceAction #Commodities #TechnicalAnalysis #LongTermOutlook

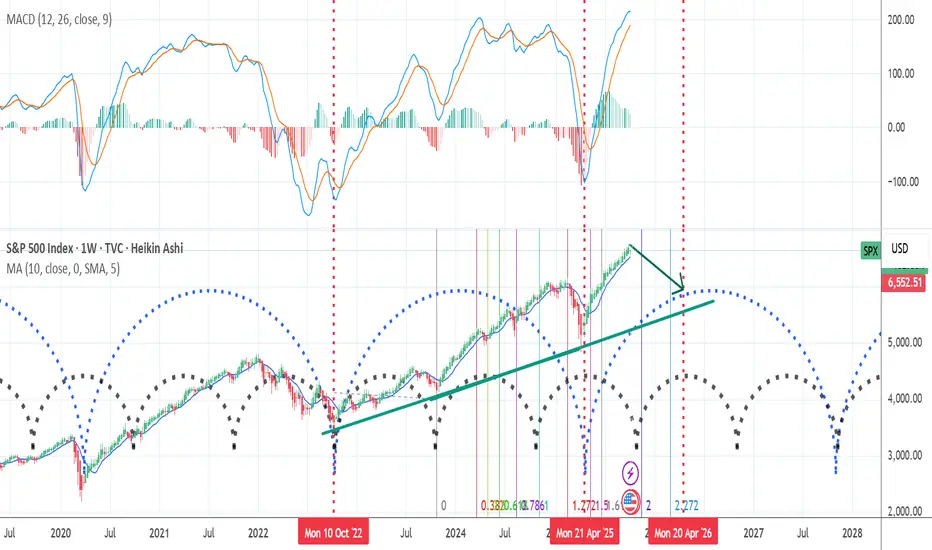
[VNFORECASTER][SPX] The price action of SPX in next cycle The price action of SPX in next cycle on Oct 11, 2025
The price action of SPX index can go down quickly.
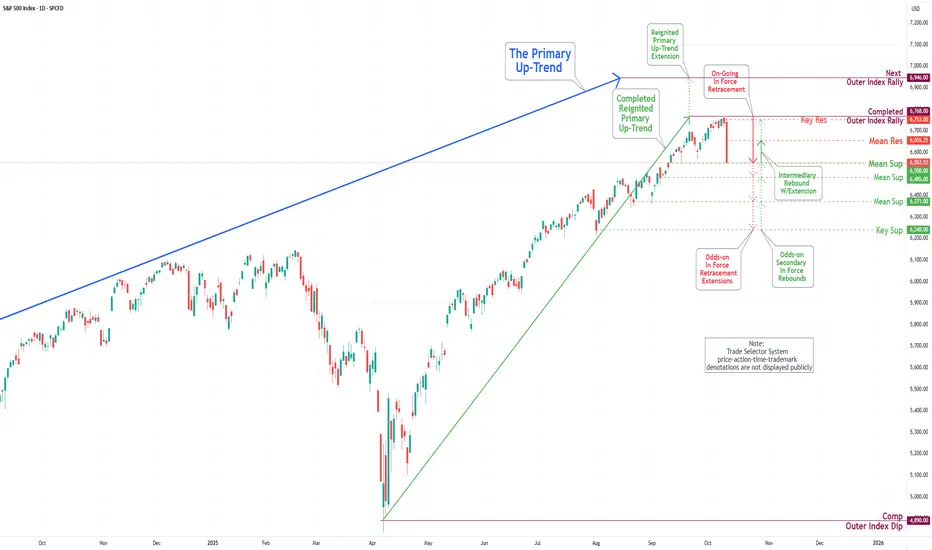
S&P 500 Daily Chart Analysis For Week of Oct 10, 2025Technical Analysis and Outlook:
During the previous week's trading session, the S&P 500 Index experienced a notable decline in price activity after reaching the Key Resistance level of 6750 and the Outer Index Rally at 6946.
At present, the index is positioned just above the newly established Mean Support level of 6550, which indicates the potential for further downward momentum. This trend could extend to subsequent Mean Support levels of 6485, 6371, and the Key Support level at 6240.
It is imperative to recognize that the index may exhibit a strong rebound following its price contact at the Mean Support level of 6550. Furthermore, there exists the possibility of an upward extension that could reach the Key Resistance target of 6753.
Global Market Time Zone ArbitrageExploiting Temporal Gaps in Financial Trading.
Introduction
In the world of finance, time is money—literally. Global markets operate across multiple time zones, from Tokyo to London to New York, creating a continuous 24-hour trading cycle. This nonstop nature of global finance gives rise to an intriguing phenomenon known as “time zone arbitrage.” It refers to the opportunity traders have to profit from differences in asset prices across markets that open and close at different times. These discrepancies often occur due to variations in liquidity, news flow, investor sentiment, and economic data releases.
While traditional arbitrage exploits price differences between identical assets in different locations or exchanges, time zone arbitrage takes advantage of temporal inefficiencies—how the same information is priced differently at different times of day across the globe. Understanding this concept requires a grasp of market interconnections, regional behaviors, and how global events ripple through the timeline of financial markets.
1. The 24-Hour Trading Clock
Global financial markets never sleep. When the Asian markets wind down, Europe takes over, followed by the U.S. sessions, which eventually hand back momentum to Asia. This rotation ensures that trading activity continues around the clock, covering key financial hubs:
Region Major Markets Trading Hours (GMT) Overlap With
Asia-Pacific Tokyo, Hong Kong, Singapore 00:00 – 08:00 Europe (partial)
Europe London, Frankfurt, Paris 07:00 – 15:30 Asia (early), U.S. (midday)
North America New York, Chicago 12:00 – 21:00 Europe (early)
The overlapping hours, especially between London and New York, see the highest liquidity and volatility. However, when one market closes and another opens, temporary inefficiencies can occur. These are the breeding grounds for time zone arbitrage opportunities.
2. Defining Time Zone Arbitrage
Time zone arbitrage is a strategy that seeks to profit from price differences created by timing gaps between global markets. For instance, when an event occurs after the close of one market but before another opens, the latter reacts first. Traders anticipating how the closed market will respond once it opens can position themselves ahead of that reaction.
Example:
Suppose a major tech company listed on both the New York Stock Exchange (NYSE) and the Tokyo Stock Exchange (TSE) releases strong earnings after NYSE closes. The Tokyo market opens several hours later and reacts immediately to the news, pushing prices higher. A savvy trader could buy shares in Japan and later sell in New York when it opens, assuming the NYSE-listed shares will follow the same upward adjustment.
This approach doesn’t involve “insider information”—it’s about acting faster within a global time structure.
3. The Mechanisms Behind Time Zone Arbitrage
a. Information Lag
Financial information doesn’t reach all investors at the same time. Even though digital news travels instantly, the interpretation and pricing of that information vary across regions.
Asian traders may react differently to U.S. Federal Reserve comments than their European counterparts.
Markets that close early might “miss” a late-breaking development, creating temporary mispricing.
b. Fund Valuation Delays
Mutual funds, ETFs, and index funds in certain markets are priced based on closing prices, which creates valuation lags. For example, U.S. mutual funds investing in Asian equities may value their holdings at stale prices, ignoring overnight moves in Asian markets. Arbitrageurs can exploit this discrepancy through stale price arbitrage, a form of time zone arbitrage.
c. Cross-Listed Securities
When the same company’s stock trades on multiple exchanges (e.g., London and New York), time zone differences can create arbitrage windows. Traders monitor price deviations and use derivatives or foreign exchange tools to hedge risk while exploiting temporary inconsistencies.
d. Currency Influence
Because cross-border trading involves multiple currencies, forex market movements play a critical role in time zone arbitrage. Exchange rates fluctuate continuously, impacting how international assets are priced in local currencies.
4. Real-World Examples of Time Zone Arbitrage
i. Japan-U.S. Market Arbitrage
When Wall Street closes, the Nikkei often reacts to the S&P 500’s performance overnight. Traders who anticipate these reactions can use index futures to capitalize on correlations between the two.
ii. Asian ETFs in U.S. Markets
Many U.S.-listed ETFs (like the iShares MSCI Japan ETF) track Asian indices. However, when the U.S. market opens, Asian exchanges are closed. If U.S. traders expect the Asian market to open higher the next day (based on global cues), they can buy the ETF in anticipation—earning profits when the ETF’s price aligns after Asia opens.
iii. Currency Futures
Currency markets, particularly USD/JPY or EUR/USD, exhibit strong correlations with regional stock markets. Traders use these as time-zone proxies, trading currencies in one time zone to predict or hedge equity movements in another.
iv. Gold and Commodities
Commodities like gold trade continuously across exchanges, but price adjustments often occur in waves. If Asian demand pushes gold higher overnight, U.S. traders can anticipate a catch-up rally during their session.
5. Institutional Exploitation and Algorithmic Trading
Modern arbitrage has largely become the domain of institutions equipped with algorithmic trading systems. High-frequency trading (HFT) algorithms scan multiple markets, currencies, and time zones to detect fleeting inefficiencies.
Key techniques include:
Latency Arbitrage: Exploiting milliseconds of delay between data feeds from exchanges in different time zones.
Cross-Exchange Hedging: Simultaneously buying in one market and selling in another as prices converge.
AI-Powered Prediction Models: Using sentiment analysis and global event tracking to forecast market reactions in different time zones.
Because these opportunities exist for only seconds to minutes, manual traders rarely succeed without advanced technology.
6. Risks and Limitations
Despite its appeal, time zone arbitrage isn’t without challenges:
a. Execution Risk
Price discrepancies may vanish before the trade is executed, especially in high-frequency environments. Latency and order execution speed are critical.
b. Currency Risk
Cross-border transactions expose traders to exchange rate volatility. A profitable price move could be offset by an unfavorable currency fluctuation.
c. Transaction Costs
Commissions, spreads, and taxes can erode the small profit margins typical in arbitrage strategies. Institutions often rely on large volumes to make such trades worthwhile.
d. Market Correlations
With globalization, asset correlations have increased, reducing inefficiencies. Arbitrage opportunities are rarer and shorter-lived.
e. Regulatory Barriers
Different countries have distinct trading regulations, taxes, and capital controls. Navigating these legal frameworks requires compliance expertise.
7. Time Zone Arbitrage in Different Asset Classes
a. Equities
Cross-listed stocks and ETFs provide the most direct time-zone arbitrage routes. Example: ADRs (American Depository Receipts) and their foreign counterparts often show price mismatches.
b. Bonds
Fixed-income markets move slower but still present opportunities. Global bond ETFs can react late to sovereign yield changes, creating short-term valuation gaps.
c. Currencies
Forex markets operate 24/7, making them the backbone of time zone arbitrage. Traders use currency pairs as early indicators for equity and commodity moves.
d. Commodities
Oil, gold, and copper often see price leadership shifts between Asia, Europe, and the U.S. as regional demand and supply updates roll out.
e. Cryptocurrencies
Crypto markets are open 24/7, yet time-zone trading patterns persist due to regional investor behavior. Asian sessions often set the tone for early momentum, while U.S. traders influence volatility later in the day.
8. Case Study: The Asia–U.S. Price Reaction Cycle
Consider a simplified chain reaction:
U.S. closes higher on positive economic data.
Asian markets open hours later and react to the U.S. optimism by rallying.
European markets open next, digesting both U.S. and Asian sessions, adding or adjusting momentum.
The U.S. reopens, responding to global sentiment formed overnight.
Traders who understand this cyclical information flow can position themselves to profit. For instance, buying Asian index futures before the open after a strong U.S. session often yields short-term gains—an example of inter-temporal correlation arbitrage.
9. The Future of Time Zone Arbitrage
Technological advancement is both a blessing and a curse for arbitrageurs. On one hand, machine learning and big data analytics enhance detection of global mispricings. On the other, automation has drastically reduced the lifespan of opportunities.
Emerging technologies shaping the future include:
Quantum computing for ultra-fast data analysis.
AI-driven sentiment analysis tracking news flow across time zones.
Decentralized trading platforms reducing latency barriers.
Moreover, as financial institutions seek a “follow-the-sun” trading model, with teams operating in shifts across continents, time zone arbitrage could evolve into real-time global arbitrage networks.
10. Conclusion
Time zone arbitrage stands as a testament to the interconnectedness of modern finance. It reveals how geography and time, despite technological progress, still shape global asset pricing. By leveraging differences in market hours, traders exploit short-lived inefficiencies caused by delayed reactions to information.
However, succeeding in this space requires precision, speed, and understanding of cross-market correlations. What began as a manual strategy has now evolved into a highly automated, algorithm-driven endeavor dominated by institutions.
In essence, time zone arbitrage is the art of turning time itself into a tradable asset—where every second counts, and every sunrise in Tokyo or sunset in New York opens a new chapter of global opportunity.
THE NEXT MOVE WILL BE PARABOLIC! CRYPTO GOING TO FOLLOW!We are in a bubble phase, the next move will be big until start of Q2 2026.

SPX500 Local Short!
HI,Traders !
#SPX500 made a nice
Bullish move up and
made a retest of
The horizontal resistance
Level of 6750.77 from where
We are already seeing a bearish
Reaction and so we will be
Expecting a further move down !
Comment and subscribe to help us grow !

A healthy consolidation should dip lowerA healthy consolidation should dip lower (around $6,648 or even better $6,000) before bouncing.
But will the billionaires manipulating this market have the patience — or will they fire their money into the air too soon?
Hopefully, we get a deeper correction for a solid long setup by the end of the week and a strong rebound next week.
Patience is key. 🕒
Expected Moves (Old Favorite)Last week: +/- 94
Next week: +/- 178
Huge expansion next week! Broke the lower end of the expected move this week (red bar).
All credits to Don at Theotrade

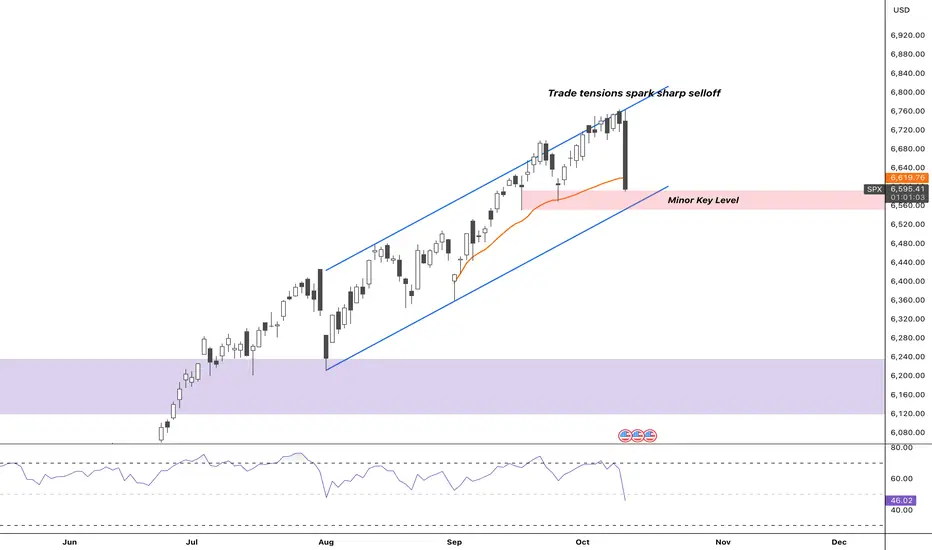
SPX Pulls Back Hard — Testing Channel Support After Trade ShockPost:
SPX saw a sharp reversal after Trump’s renewed tariff threats on China, sparking a broad risk-off move. The index broke sharply from the upper channel, tagging the 21-day EMA and now sitting right on a minor key level within the ascending channel.
Momentum clearly flipped short-term, but the question now is whether there’s enough downside energy to break through both this key level and the channel’s lower boundary — a move that would shift structure from controlled pullback to confirmed trend break.
Key Levels:
• 6,535–6,550: Minor key level + channel support
• 6,750–6,780: Prior rejection zone
• 6,200: Major support if channel breaks
Focus: Watch for confirmation — either buyers step in at channel support, or momentum extends into a deeper structural break.
SPX500 — 4H ChartSPX500 — 4H Chart 📈
If the 4H candle closes above 6751.8, creating a new Break of Structure (BOS), we could see a pullback.
I’ll be watching for price action confirmation to buy on the retest.
Target: 6803

Today Fundamental Analysis Confirmed my Technical AnalysisSee my previous post where I stated that we were getting rejected the triple top was confirming the market was rolling over at least in the short term. Today Trump stating that China was becoming openly hostile caused a sell off. But the tape was telling the tale before it happened.
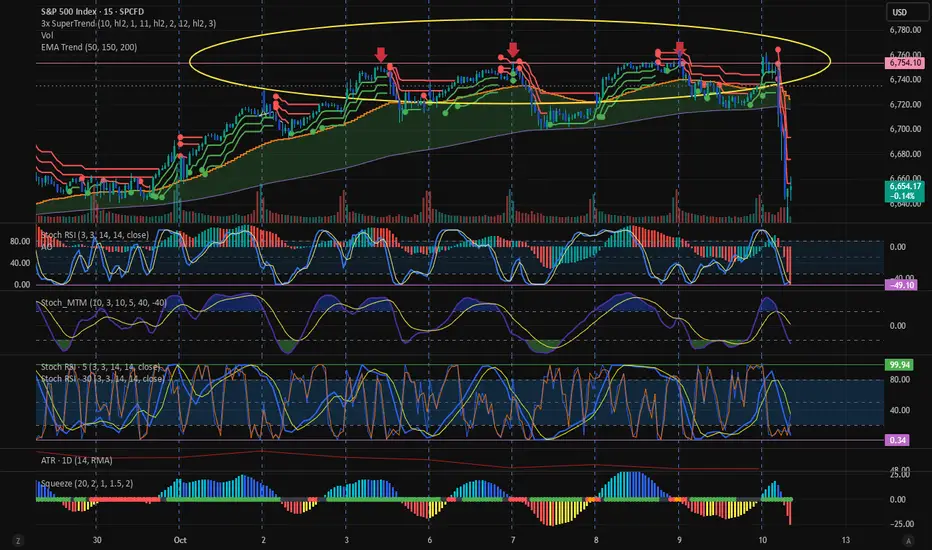
Crash ... 10 % and up 6760 is very important Pivot that price can`t pass for many reasons :
its 720 GANN angle since the uptrend begins in apr 2025 @ 4840
and it comes with upper trend that contain the price and face it down evey time it touch
Now . its matter of time before the movie start
This is how the big whales punish you when you trade in the markets
Gold at a record high
The dollar is also rising
Bonds are rising
Political tensions are increasing
Inflation is rising
Unemployment is increasing
Government shutdown
High tariffs
Yet the market hits a new record every other day by day
Patience is a virtue
Wait for a 10-15% crash before the end of the year
After they wipe out the sellers, as they always do
have a sit , have a kit kat

Is this real or not? SP500 and VIXA quick overview. SPY now under it's 18ma. Vix breaking out and holding above 18 dollars is an ominous sign. High Yield continues to fall. Gold probably makes another high.

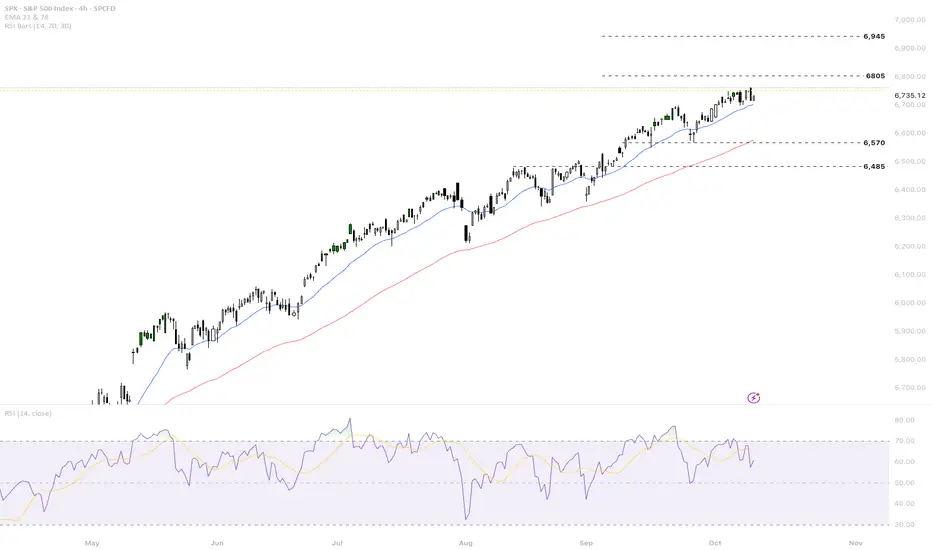
US500 Remains Fundamentally ConstructiveFundamental Analysis
US500 remains fundamentally constructive, with robust year over year growth above 15% driven primarily by optimism in the technology and AI sectors. However, sentiment has cooled, leading to recent profit taking following fresh record highs. Key fundamental risks include worries over stretched valuations in tech and persistent uncertainty stemming from the ongoing US government shutdown and the resulting shortage of key economic data. Near term direction will be heavily influenced by the release of the University of Michigan sentiment index and the crucial September CPI, alongside the upcoming banking sector earnings.
Technical Analysis
The US500 is currently consolidating near 6,735 points after its recent peak. The dominant trend remains bullish, supported by the fact that all major Moving Averages (10 to 200 periods) are in "strong buy" territory. Momentum indicators like the RSI are approaching overbought levels, suggesting the rally needs a brief pause but have not yet signaled a reversal.
Key technical levels to watch are:
Immediate Resistance: 6,805 Stronger technical target for the medium term.
Pivot Support: 6,700, Potential bounce zone/trend continuation threshold.
Critical Support: 6,570, Key downside buffer; breach could signal a deeper correction.
Analysis by Terence Hove, Senior Financial Markets Strategist at Exness

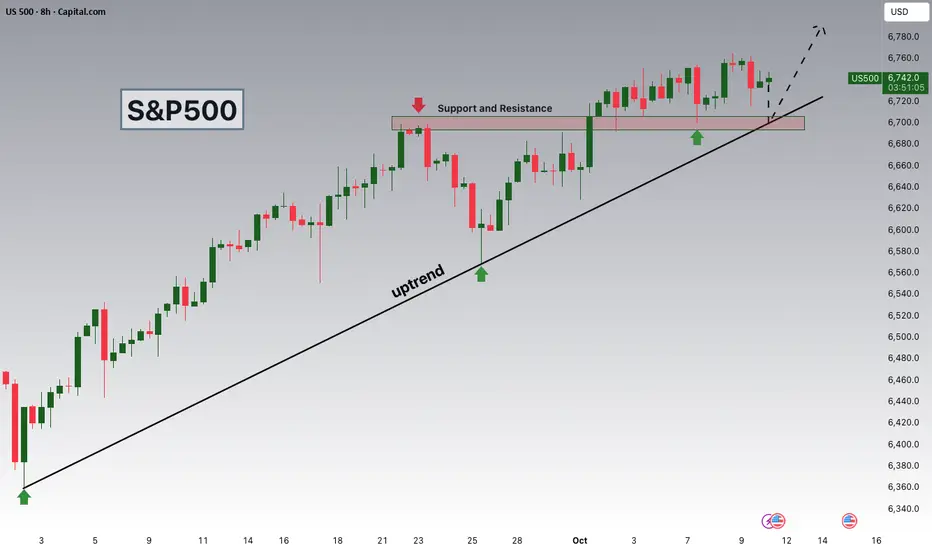
S&P 500 Watching 6,700 Support as Seasonal Tailwinds Strengthen.Hey Traders,
In today’s session, we’re keeping a close eye on US500 for a potential buying opportunity around the 6,700 zone. The S&P 500 remains firmly in an uptrend, with price currently in a healthy correction phase approaching a key support and trend confluence near 6,700.
Beyond the technical setup, seasonality adds a bullish layer — over the past 15 years, the S&P 500 has advanced 14 times in October to early November, averaging significant gain during this window.
If history rhymes, the current pullback could offer a compelling buy-the-dip opportunity into one of the market’s strongest seasonal periods.
Trade safe,
Joe.