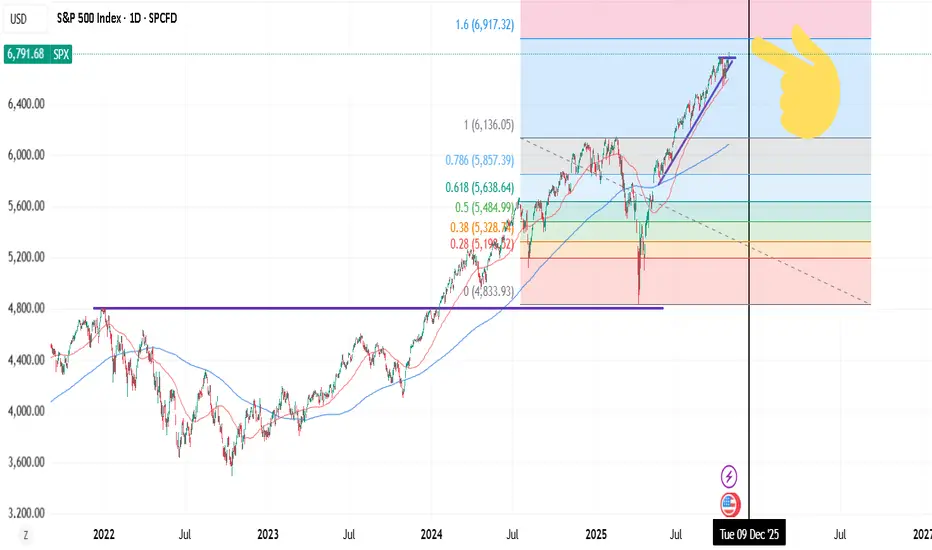
1.6 FIB Ceiling - Stock market correction soon in NOV/DEC.You can apply 1.6 FIB to FAANG or QQQ for high probability ceilings. VIX "structure" (pattern) or setup also indicates it. Stocks forming a sharp "wedge drop", extension from 50dma.
Bullish near term (probably?), correction in NOV/DEC.
I wonder if the first 5 (monthly) trading days in NOV are not volatile AF. 😂
Trade ideas
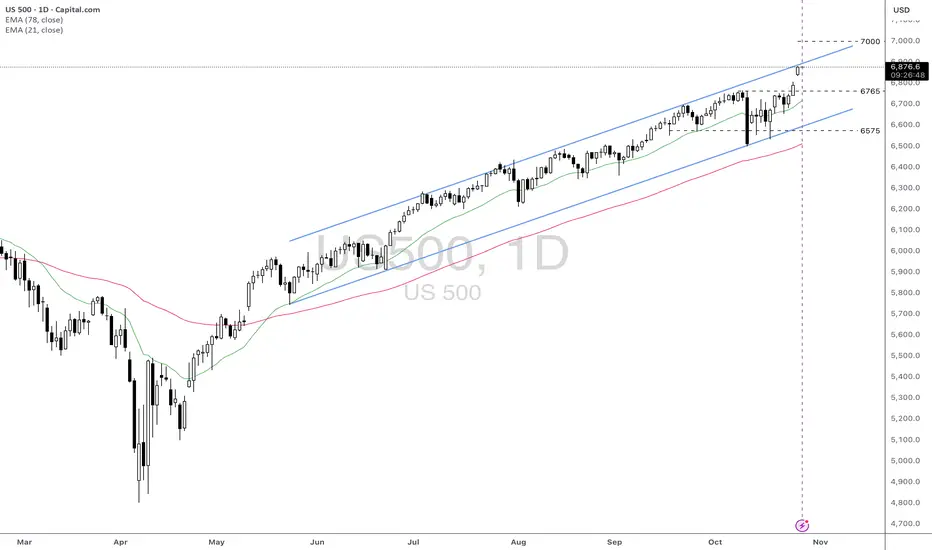
US500: Strong Upward Momentum Approaching 7000 LevelFundamental approach:
- The US500 advanced this week, propelled by strong earnings momentum from tech giants and robust performance in select sectors. Among top movers, Qualcomm rose over 11% following upbeat earnings guidance, while Alphabet and Tesla also rallied ahead of their highly anticipated quarterly results. W.R. Berkley Corporation and Welltower Inc. were notable gainers, reflecting sector rotation and risk-on flows in the index.
- Earnings from the 'Magnificent Seven', including Microsoft, Alphabet, and Meta, drove sentiment, with over 86% of S&P 500 companies reporting results above consensus expectations so far this quarter. Tesla's performance was mixed, while Amazon is set to announce slightly lower profits, but the broader group is still outpacing the rest of the market in earnings growth.
- Tech earnings and the upcoming FOMC decision are key catalysts that may influence future US500 moves. Broad sector participation and ongoing AI investment could sustain upward momentum if macroeconomic conditions remain supportive.
Technical approach:
- US500 created a new all-time high this week after breaching the key level at around 6765. The index showed an urgency in moving upward, creating a gap that remains unfilled. US500 is well above the diverging EMAs, indicating a strong upward momentum. However, the index is approaching the upper bound of the ascending channel, which may limit the price movement.
- If the current gap remains unfilled, the US500 may continue to move upward and test the psychological resistance at 7000.
- On the contrary, rejecting the channel's upper bound may prompt a correction and fill the gap around 6790, retesting the broken level at 6765.
Analysis by: Dat Tong, Senior Financial Markets Strategist at Exness
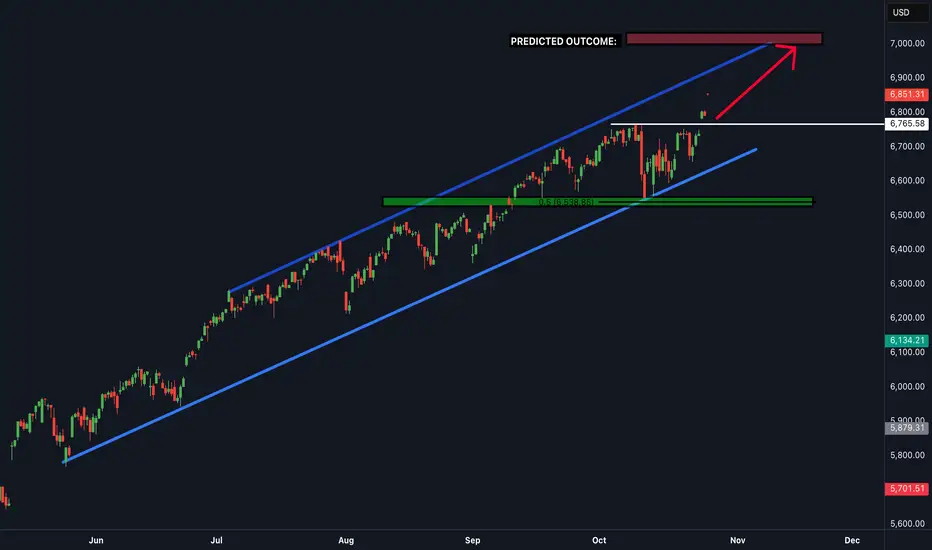
Fib's extensionIf so, then this thing won't stop until it reaches the purple level. That's where the correction could really begin. I'm not ready to say when yet, because the angle of attack could be either gradual or exponential, depending on the economy and the political situation.

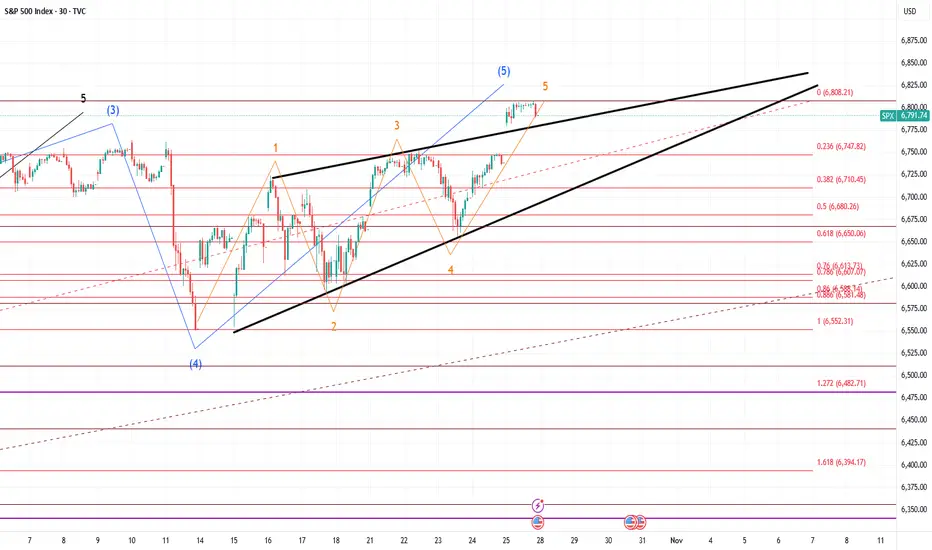
This is the END(ing diagonal)The ending diagonal has formed. If you check RSI you will see a double daily and fresh WEEKLY divergence. It will crash hard next week. 6480 is the first target, but it can be just a bounce area. 1.618 level from low to top of the diagonal is at 6400 level on SPX and at 6300 level on US500 - I think we can get a flash-crash into this area next week. And if this is a reversal, it can trend down to February peak and lower according to fibs.
S&P 500 Consolidation Turning Bullish StructureThe S&P 500 remains in a consolidation phase, leaning toward a bullish trend as it aims for new record highs once again.
Global stocks jumped on Monday to fresh intraday records, while the U.S. dollar eased on optimism that a potential trade deal between China and the U.S. may be approaching. Investors are also awaiting a series of central bank policy meetings and key earnings reports from several mega-cap companies.
From a technical perspective, prices continue to react strongly to the upside. If this upward momentum persists, the next resistance level is seen around 6,950.10.
You may find more details in the chart.
Trade wisely best of Luck buddies,
Ps; Support with like and comments for better analysis Thanks for Supporting.

SPX500 | Futures Rise on Intel Boost Ahead of CPI DataSPX500 | Futures Rise on Intel Boost Ahead of CPI Data 📊
Wall Street futures edged higher on Friday, lifted by strong Intel earnings, as investors await a crucial U.S. inflation report (CPI) that could influence the likelihood of a December rate cut.
Technically, the SPX500 maintains a bullish structure, with potential to extend gains toward 6,792 → 6,838, especially if CPI data comes in below or in line with expectations.
However, if inflation prints higher than expected, the index could face bearish pressure toward 6,720 → 6,670.
Pivot Line: 6,770
Resistance: 6,792 – 6,838
Support: 6,720 – 6,670
Weekend Analysis: DXY, BTC, Gold, Silver, Nas100 and SPX500In this video presentation I am expecting the dollar index to continue its uptrend on the lower time frame towards the liquidation level target of 99.500.
Bitcoin is still in a distribution range and currently correcting the sharp sell off from $126,296. I am observing an A-B-C corrective pattern potentially to targets of either $115,044 or $117,653. These are confluence of resistance level and will be expecting a sell off from these levels. If these levels gets invalidated then potentially the all time highs of $126k is in view. However that's not my expectation so a breach of the target level will invalidate the bearish analysis on Bitcoin.
I think Gold and Silver have peaked out for now and smart money is off loading to FOMO retail traders. I am expect Silver to sell off much faster than Gold.
Nas100 and SPX500 clinched to a breakout of new highs but the buying volume is fading out and seems to be a fake out. I will be watching if the breakout levels gets support or breakdown on pullback to decide a long position or short position.
This is my opinion on the market this week and I thank you for your time to visit my publications.
Have a great trading week and don't forget risk and money management is your first job as trader or investor. Cheers!!

SPX - The Road to 6900 Begins “History never repeats itself. Man always does.”
A deep look into SPX History exposes the path of a market cycle and tells us the truth on where markets are headed.
Percentages don't lie.
See you guys at 6900!

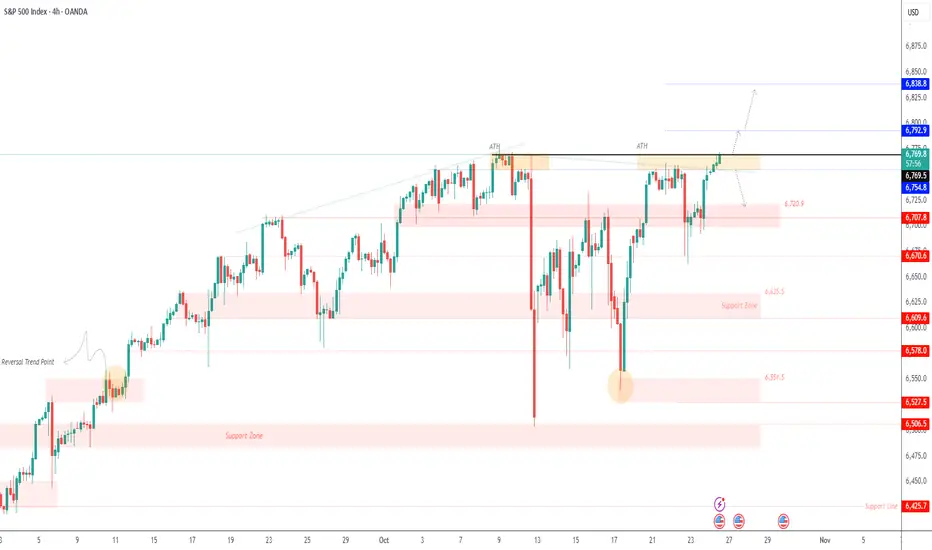
S&P 500 looks Bearish Correction But Fed is Coming...SPX500 – Technical & Fundamental Overview
The index remains under bullish momentum, but a short-term correction toward 6838 from the pivot line at 6889 is possible before the next directional move.
Technical Outlook:
A 1H close below 6839 would confirm a bearish reversal, targeting 6769 as the next support.
However, a 1H close above 6889 would reinforce the bullish trend, paving the way toward 6941 and 6991 — with potential for a momentum-driven continuation if sentiment stays positive.
Pivot Line: 6889
Support Levels: 6840 · 6800 · 6769
Resistance Levels: 6940 · 6991
Fundamental Context:
Traders are positioning cautiously ahead of this week’s Trump–Xi trade talks, which could shape near-term market sentiment. Optimism over a potential U.S.–China tariff framework and expectations that the Federal Reserve may cut rates again are supporting risk appetite.
However, with indices at record highs and AI-related stocks heavily concentrated, any disappointment in the trade outcome or earnings results could spark a sharper downside reaction.
In short, bullish while above 6889, but watch for volatility driven by trade headlines and Fed signals in the coming sessions.

SPX | Daily Analysis #9 - 30 October 2025Hello and welcome back to DP,
Market Review:
Well, yesterday was a significant day across global markets — from U.S. stock indexes to crypto assets — with investors digesting major developments from the Federal Reserve and the renewed U.S.–China trade dialogue. The yesterday’s market summery:
- Monetary policy / central bank: The Fed’s decision to cut interest rates by 25 basis points (as expected) was overshadowed by Powell’s cautious tone about future cuts. However, optimism was tempered by comments from Jerome Powell indicating that another rate cut in December is not guaranteed. That caused some caution in the market.
- S&P 500: 6,890.59 (down ~0.30 points). Dow Jones Industrial Average: 47,632.00 (down ~74.37 points, ~0.2%). Nasdaq Composite: 23,958.47 (up ~130.98 points, ~0.5%).One of the biggest drivers: Nvidia Corporation became the first public company to reach a roughly $5 trillion market valuation, boosting the tech segment.
- Trade & geopolitics: The U.S. signalled progress in trade and industrial policy with China: comments from Donald Trump hinted at easing of some tariffs (e.g., on fentanyl-related goods) and possible cooperation on rare-earth export controls. The U.S. will reduce some tariffs on Chinese goods: for example, tariff on certain chemicals tied to fentanyl production will go from 20 % down to 10 %, and overall U.S. duties on Chinese imports shift from ~57 % to ~47 %. China agreed to resume more agricultural purchases from the U.S. (e.g., soybeans, sorghum) and to postpone export restrictions on rare earth materials for about one year.
- And for watching ahead is earnings: Big names like Apple Inc. (AAPL) and Amazon .com Inc. (AMZN) are due after market close, which could influence the market.
- The overall crypto market cap held steady near $3.2 trillion, with sentiment described as “risk-on, but wary.”
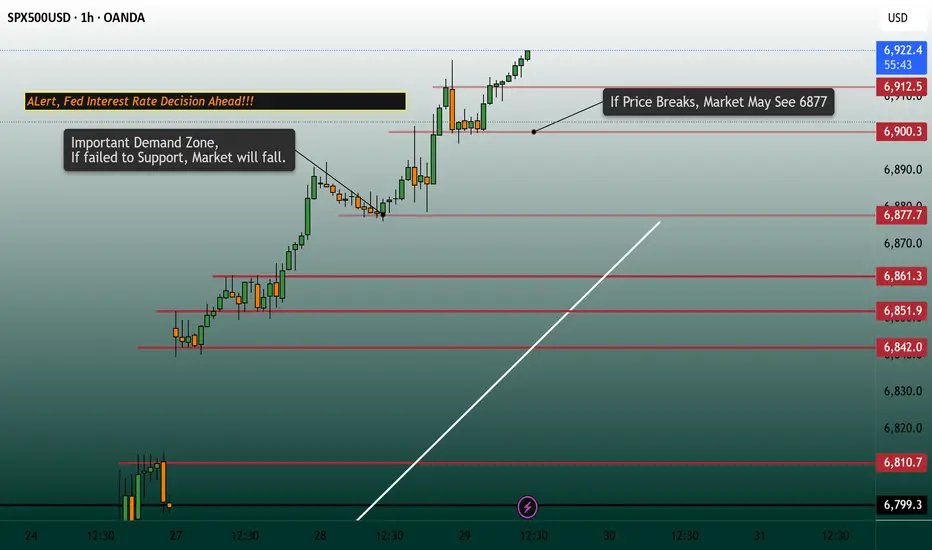
1H – 4H Technical Analysis:
As observed on the chart, price has broken below the bullish trend line and moved through yesterday’s key demand zone, signaling a potential shift in short-term momentum.
Currently, the price is declining, approaching lower demand areas. As of this analysis, SPX is retracing and may find temporary support around the 6,842 level, where a short-term rebound toward 6,877 is possible before the next move unfolds.
However, if bullish momentum fails to hold above that level, a drop through the gap zone could follow, pushing price action toward the 6,810 support region, which aligns with the next major demand zone on the 4-hour chart. This zone may serve as a stronger accumulation area for potential medium-term buyers.
From a broader perspective, the recent U.S.–China trade truce provides a fundamental tailwind for the market — a bullish catalyst that could limit downside extensions and support sentiment in the coming sessions.
It’s also notable that the S&P 500’s annual return now stands near +16 %, compared with roughly +24 % two years ago. This suggests that while growth has moderated, there remains room for further upside if macro conditions stay supportive and earnings momentum continues.
Disclaimer:
This content is for informational purposes only and does not constitute financial or investment advice. © DIBAPRISM
Amir D.Kohn

Blockchain’s Role in Different Trading Segments1. Introduction: Redefining Trust in the Trading World
The modern trading ecosystem — spanning financial markets, commodities, forex, and digital assets — relies heavily on trust, transparency, and speed. For decades, intermediaries such as brokers, clearing houses, and central depositories have played a vital role in ensuring smooth settlements and recordkeeping. However, this system is often plagued by inefficiencies, high transaction costs, and occasional lapses in security or accountability.
Enter blockchain technology — a decentralized ledger system that offers immutable, transparent, and secure recordkeeping. By eliminating the need for traditional intermediaries, blockchain has the potential to revolutionize how trades are executed, verified, and settled across different segments of the global financial market.
Blockchain’s role in trading is not confined to cryptocurrencies. Its applications now extend to stock markets, commodity exchanges, forex trading, derivatives, and even carbon credit and energy trading. Each of these sectors can benefit from blockchain’s ability to automate trust and reduce systemic inefficiencies.
2. Understanding Blockchain in the Context of Trading
At its core, blockchain is a distributed database shared among a network of participants. Once data — such as trade details or payment confirmations — is recorded on the blockchain, it cannot be altered without the consensus of the network. This ensures that all trading participants operate from a single, verified source of truth.
In trading terms:
Each transaction (buy or sell order) is a “block.”
These transactions are chained together chronologically.
The system is decentralized, meaning no single entity can manipulate data.
This architecture has far-reaching implications for global markets:
Instant settlements instead of multi-day clearing cycles.
Elimination of counterparty risk, as smart contracts execute automatically.
Lower transaction costs due to reduced intermediary dependence.
Enhanced auditability, since all data is time-stamped and verifiable.
3. Blockchain in Stock Market Trading
The traditional equity trading system involves multiple intermediaries — brokers, stock exchanges, clearing corporations, and custodians — all performing specific functions such as matching orders, confirming trades, and settling securities. While effective, this system is slow and costly.
How Blockchain Transforms Stock Trading
Real-Time Settlement: Blockchain can reduce the settlement period from the current T+2 (trade date plus two days) to near-instantaneous settlement (T+0). This significantly reduces liquidity risk and capital lock-in.
Tokenization of Assets: Shares can be represented as digital tokens on a blockchain. This enables fractional ownership, making high-value stocks accessible to smaller investors.
Decentralized Exchange Platforms: Decentralized stock trading platforms can facilitate peer-to-peer transactions without intermediaries, ensuring transparency and reducing costs.
Immutable Recordkeeping: Corporate actions such as dividends, bonus issues, and stock splits can be recorded permanently and automatically distributed using smart contracts.
Examples
Nasdaq Linq: One of the early adopters of blockchain, Nasdaq used the Linq platform to record private securities transactions, demonstrating efficiency and transparency.
India’s NSE pilot programs: The National Stock Exchange of India has experimented with blockchain for know-your-customer (KYC) data and settlement tracking.
4. Blockchain in Forex (Foreign Exchange) Trading
The foreign exchange market is the world’s largest financial market, with daily volumes exceeding $7 trillion. Yet, it remains fragmented, opaque, and reliant on central intermediaries like banks and payment processors.
Blockchain’s Advantages in Forex
Cross-Border Settlement: Blockchain enables direct peer-to-peer currency exchange without intermediaries, drastically cutting transfer times and fees.
Transparency and Auditability: All trades recorded on a blockchain are verifiable, reducing manipulation and fraud risks.
Smart Contracts for FX Swaps: Automated execution of forex swaps and forward contracts ensures minimal counterparty risk.
24/7 Accessibility: Unlike traditional systems, blockchain-based FX networks can operate continuously without downtime.
Example
RippleNet and Stellar Lumens use blockchain to enable instant cross-border currency transfers with minimal costs, challenging the dominance of SWIFT.
5. Blockchain in Commodity Trading
Commodity trading — involving oil, metals, and agricultural goods — often suffers from documentation delays, supply chain opacity, and settlement inefficiencies. Blockchain brings trust and traceability to this sector.
Applications
Smart Contracts for Trade Settlement: Automatically execute trades once contractual conditions are met (e.g., delivery confirmation triggers payment).
Supply Chain Transparency: Blockchain can trace commodities from extraction or production to final sale, ensuring authenticity and sustainability.
Tokenization of Commodities: Commodities like gold, crude oil, or carbon credits can be represented digitally, making them easier to trade and fractionalize.
Reduction in Paperwork: Blockchain eliminates the need for multiple physical documents like bills of lading, inspection certificates, and letters of credit.
Example
Vakt, a blockchain-based platform supported by BP and Shell, digitizes the post-trade processes in oil markets, improving efficiency and reducing fraud.
6. Blockchain in Derivatives and Futures Markets
Derivatives — including futures, options, and swaps — are complex instruments often involving multiple intermediaries. Blockchain’s smart contracts can automate these trades and settlements with precision.
Benefits
Instantaneous Settlement: Reduces the time gap between contract execution and settlement, minimizing counterparty and liquidity risks.
Automated Margin Calls: Smart contracts can automatically adjust margin requirements based on real-time price movements.
Transparency: Blockchain’s shared ledger ensures all participants view the same data, reducing disputes.
Regulatory Compliance: Blockchain enables real-time reporting to regulators, improving oversight.
Example
DTCC (Depository Trust & Clearing Corporation), which handles trillions in derivatives, has explored blockchain for trade reporting and settlement to enhance efficiency.
7. Blockchain in Cryptocurrency Trading
Cryptocurrency trading is the first and most obvious area where blockchain has already established dominance. Cryptos like Bitcoin and Ethereum are themselves blockchain-native assets, and their trading happens entirely on blockchain-based exchanges.
Innovations
Decentralized Exchanges (DEXs): Platforms like Uniswap and PancakeSwap allow traders to exchange tokens directly from their wallets without intermediaries.
Liquidity Pools: Smart contracts automatically match buyers and sellers, ensuring market liquidity.
Transparency and Security: Every trade is publicly recorded on the blockchain, ensuring full auditability.
Challenges
High volatility, lack of regulation, and scalability limitations still pose obstacles to mainstream adoption.
8. Blockchain in Energy and Carbon Credit Trading
The rise of sustainability-focused finance has introduced new markets like carbon credits and renewable energy certificates. Blockchain ensures authenticity and prevents double-counting in these emerging asset classes.
Applications
Tokenized Energy Certificates: Renewable energy output (solar, wind, hydro) can be tokenized and traded on blockchain platforms.
Carbon Credit Trading: Blockchain ensures each credit is unique, traceable, and not resold multiple times.
Peer-to-Peer Energy Trading: Consumers with solar panels can directly sell surplus energy to others through blockchain-enabled microgrids.
Example
Power Ledger (Australia) uses blockchain to enable P2P renewable energy trading, giving consumers control over energy distribution and pricing.
9. Blockchain in Real Estate and Asset Tokenization
Although not traditionally viewed as a “trading” sector, real estate is rapidly evolving into a digital trading marketplace through blockchain tokenization.
Benefits
Fractional Ownership: High-value properties can be divided into digital tokens, allowing small investors to participate.
Instant Liquidity: Instead of lengthy paperwork, property tokens can be traded instantly on secondary markets.
Transparency and Authenticity: Land titles and ownership histories recorded on blockchain reduce fraud.
Example
Platforms like RealT and Propy are pioneering blockchain-based real estate trading with tokenized assets.
10. Blockchain’s Role in Regulatory Compliance and Risk Management
Beyond execution and settlement, blockchain plays a crucial role in compliance, auditing, and risk management.
Regulatory Advantages
Real-Time Monitoring: Regulators can access immutable records of trades in real-time.
KYC/AML Integration: Blockchain-based identity systems simplify customer verification while maintaining data privacy.
Reduced Fraud and Errors: Tamper-proof records and automated reconciliations enhance overall market integrity.
Example
The European Securities and Markets Authority (ESMA) has studied blockchain-based trade reporting to enhance transparency across the EU markets.
11. Challenges and Limitations
Despite its immense potential, blockchain adoption in trading faces practical and regulatory hurdles:
Scalability Issues: Large exchanges process millions of transactions daily; most blockchains still struggle with high throughput.
Regulatory Uncertainty: Many governments have yet to create clear frameworks for blockchain-based trading systems.
Integration Complexity: Legacy financial infrastructure is deeply entrenched, making transition costly and time-consuming.
Privacy Concerns: While transparency is valuable, full data visibility may conflict with confidentiality requirements in institutional trading.
Energy Consumption: Proof-of-work systems like Bitcoin consume significant power, though newer consensus models (e.g., proof-of-stake) are more efficient.
12. The Future of Blockchain in Global Trading
As the technology matures, blockchain is expected to become the backbone of next-generation trading infrastructure. The future may see:
Fully tokenized stock exchanges, where equities, bonds, and derivatives exist as digital assets.
Interoperable blockchains, allowing seamless transfers between different networks and asset classes.
AI and blockchain integration, combining data-driven trading strategies with transparent execution.
Central Bank Digital Currencies (CBDCs) simplifying settlement between global financial institutions.
The convergence of blockchain, AI, and IoT will lead to hyper-efficient, transparent, and inclusive trading ecosystems — reshaping how capital, commodities, and data flow across borders.
13. Conclusion
Blockchain’s entry into the trading world represents a paradigm shift — from trust-based intermediaries to trustless digital verification. Whether in stock markets, forex, commodities, or emerging asset classes like carbon credits, blockchain introduces unmatched levels of transparency, efficiency, and inclusiveness.
While challenges persist, the direction is clear: blockchain is not just a supporting technology; it is the new foundation of global trading architecture. The world’s markets are moving steadily toward an era where every trade, every asset, and every participant is digitally connected in a decentralized, verifiable, and borderless network of trust.
SPX500 On the way to the upside! BUY NOWSPX500 is in a clear upwards channel and has broken the last bit of resistance (white line shown) - this is a clear confirmation that the next target will be the next resistance zone to the upside shown above (this is a great buy trade opportunity)
S&P500 - best three-day gain since MayThe S&P 500 heads into today’s session on firm footing after posting its best three-day gain since May (+2.62%), buoyed by optimism around a potential Trump–Xi trade breakthrough and upbeat momentum across tech and semiconductor stocks.
Investor focus is turning to a pivotal week packed with catalysts: four major central bank meetings, a wave of big-tech earnings (starting tomorrow with Microsoft, Meta, and Alphabet), and the anticipated Trump–Xi meeting on Thursday. Market sentiment was bolstered by Trump’s comments suggesting progress toward a deal and even a possible resolution on TikTok, reviving hopes of easing US–China tensions.
The S&P 500 (+1.23%) and Nasdaq Composite (+1.86%) both hit new highs yesterday, driven by strong performance in trade-sensitive and AI-linked names. The Philadelphia Semiconductor Index (+2.74%) led gains, helped by Qualcomm’s +11% surge on new chip news and reports of a $1bn AI partnership between the US Department of Energy and AMD. Nvidia and other mega-cap tech stocks also rallied, pushing the Mag-7 index up +2.6%, its best single-day gain in five months.
On the rates side, the front end of the Treasury curve sold off (2yr +1.0bps) amid risk-on sentiment, while longer maturities rallied (10yr -2.2bps, 30yr -4.1bps), suggesting markets still expect monetary easing ahead. US equity futures are flat this morning, indicating a pause as traders await consumer confidence data and more corporate earnings before the next leg higher.
Bottom line:
Momentum in the S&P 500 remains positive, supported by AI and trade optimism, but with major catalysts still ahead this week, near-term direction will likely hinge on upcoming tech earnings and central bank guidance.
Key Support and Resistance Levels
Resistance Level 1: 6904
Resistance Level 2: 6924
Resistance Level 3: 6950
Support Level 1: 6832
Support Level 2: 6806
Support Level 3: 6784
This communication is for informational purposes only and should not be viewed as any form of recommendation as to a particular course of action or as investment advice. It is not intended as an offer or solicitation for the purchase or sale of any financial instrument or as an official confirmation of any transaction. Opinions, estimates and assumptions expressed herein are made as of the date of this communication and are subject to change without notice. This communication has been prepared based upon information, including market prices, data and other information, believed to be reliable; however, Trade Nation does not warrant its completeness or accuracy. All market prices and market data contained in or attached to this communication are indicative and subject to change without notice.

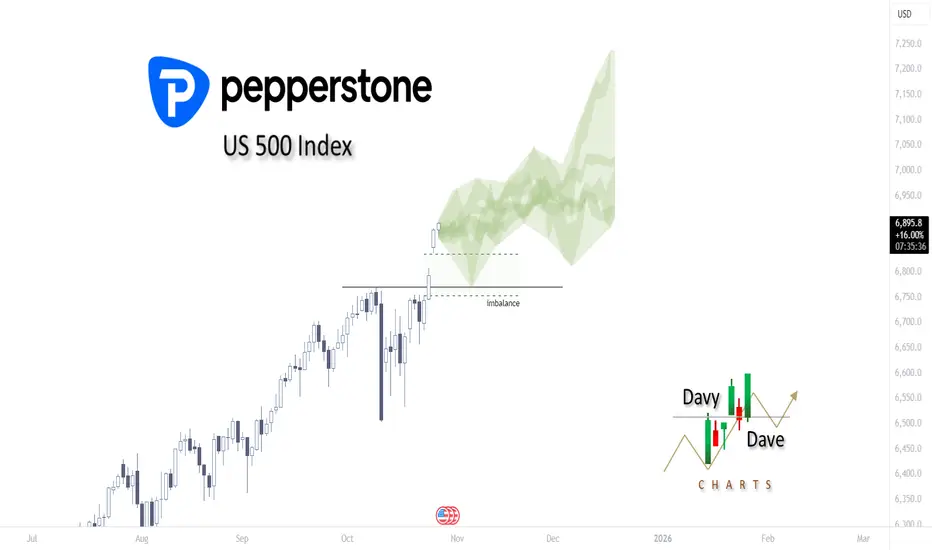
What does history say about the rest of this year?Taking a look at the US 500 Index and plotting the Late October to mid-December highs and lows on post-election year performances, the next two months are looking very bullish. PEPPERSTONE:US500 AMEX:SPY SP:SPX AMEX:VOO
SPX500 ShortElite Analysis
Short on spx500, price gave us the reversal after liquidation of asia high on 1m tf
Targeting lower liquidity pools

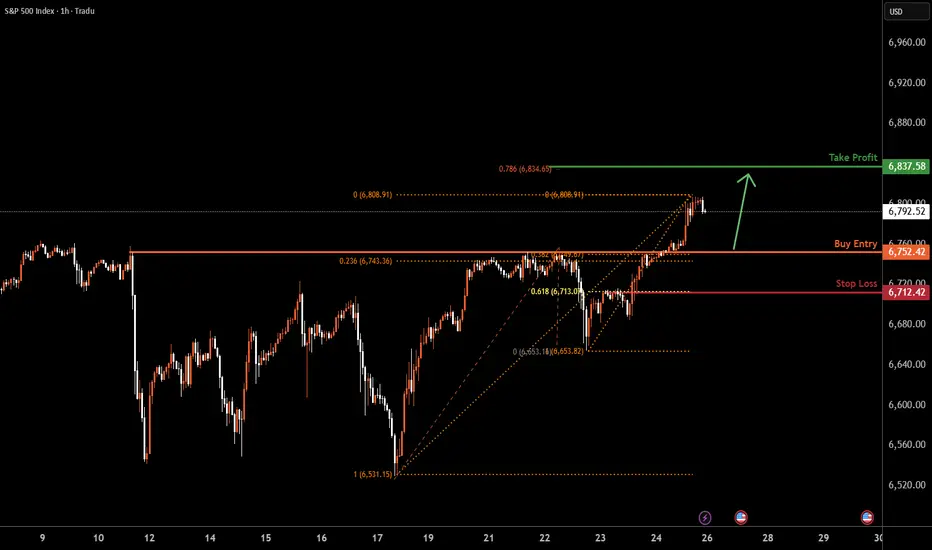
SPX500 | Price Falling Toward Key Pullback SupportS&P500 is falling towards the buy entry at 6,752.42, which is a pullback support that aligns with the 23.6% and the 38.2% Fibonacci retracement and could bounce from this level to the upside.
Stop loss is at 6,712.42, which is a pullback support that lines up with the 61.8% Fibonacci retracement.
Take profit is at 6,837.58, which aligns with the 78.6% Fibonacci projection.
Stratos Markets Limited (tradu.com ):
CFDs are complex instruments and come with a high risk of losing money rapidly due to leverage. 68% of retail investor accounts lose money when trading CFDs with this provider. You should consider whether you understand how CFDs work and whether you can afford to take the high risk of losing your money.
Stratos Europe Ltd (tradu.com ):
CFDs are complex instruments and come with a high risk of losing money rapidly due to leverage. 70% of retail investor accounts lose money when trading CFDs with this provider. You should consider whether you understand how CFDs work and whether you can afford to take the high risk of losing your money.
Trust and Release – 4 Times to LET Your Trade GoEvery trader knows the feeling.
You’ve done all the homework, lined up every signal, and double-checked your risk. It’s like preparing to jump out of a plane with your parachute strapped on – exhilarating, but just a little nerve-wracking.
When you’ve put in the work, planned the trade, and set it in motion, there’s only one thing left to do:
Let it go.
Trust the process and release the trade.
Here are four clear-cut signs it’s time to step back and trust your strategy.
SIGN #1: The System Lined Up Perfectly
You’ve got a strategy for a reason.
You trust it, you’ve backtested it, and it’s made it through countless simulations and reviews.
Whether you’re trading Forex, JSE Top 40 or even the Dow Jones Index.
When all the indicators in your system align, it’s time to act, not hesitate.
Remember, the market rewards action, not perfection.
If your system says “go,” then go. No second-guessing.
J.T.T.T – Just Take The Trade
SIGN #2: Your Entry Orders Are All in Place
You’ve placed your entry orders and planned each move with the same precision as a grandmaster in chess.
So why keep checking every tick?
If you’ve calculated your entry points and set them with intention, then you’ve done your job.
This is your chance to let the market do the rest.
Obsessing over every micro-move will only drag you into a rabbit hole of doubt.
Set it and step away.
SIGN #3: It Matches Your Risk & Reward Criteria
Your trade has a purpose, and you’ve defined it by setting your risk and reward limits.
When your setup meets these criteria, there’s no reason to stick around second-guessing the play.
You know your max loss, and you know your target profit. You’ve thought it through rationally, and now it’s time to trust that process.
You’re here to be a professional, not a perfectionist.
SIGN #4: You’ve Nailed Down Your Trade Size
Position sizing is a science in itself, and you’ve already done the math.
You’re not risking more than you’re willing to lose, and you’re confident in the upside.
If you’ve set your trade size according to your plan, you’ve already protected your capital.
The last thing you need is to add or subtract impulsively. Let the size stay as it is and let the market move.
Conclusion: Trust and Release
Trading is as much about discipline as it is about analysis.
If you’ve done the work, checked off every box, and know your limits, the best thing you can do is walk away and let your trade breathe.
Micromanaging won’t make you money; it’ll just wear you out.
The market is like a river – you can’t force it to flow your way. You can only guide your boat down the path you’ve chosen and let the current do its thing.
When you’ve planned the trade, trust yourself enough to leave it alone.
So let’s sum up the FOUR signs to let your trade go.
SIGN #1: The System Lined Up Perfectly
SIGN #2: Your Entry Orders Are All in Place
SIGN #3: It Matches Your Risk & Reward Criteria
SIGN #4: You’ve Nailed Down Your Trade Size

SPX | Daily Analysis #8 - 29 October 2025Hello and welcome back to DP
Market Review:
Over the past two days, as mentioned in our #7 analysis, “a sustained move above 6,860 may signal further bullish momentum toward the upside.”
This scenario played out as expected, with price reaching the 6,900 area for the first time. However, short sellers are now stepping in, attempting to fade the rally and fill the gap.
Currently, all eyes are on the upcoming Federal Reserve interest rate decision and Chairman Powell’s comments. Both China and the U.S. have remained relatively quiet, keeping market attention focused on monetary policy.
Meanwhile, President Trump stated yesterday that he intends to replace Powell in the coming months. Powell has previously clarified that the President does not have direct authority to remove the Fed Chair, so this statement adds a layer of political uncertainty.
According to CME FedWatch, there is about a 95% probability of a 25 bps rate cut being announced.
1H–4H Technical Analysis:
The 6,900 area is currently acting as a strong resistance zone, followed by the 6,878 support area.
• Bears have entered around 6,900–6,917, attempting to push prices lower.
• Bulls, however, are showing resilience and defending the zone.
If price fails to hold above 6,900, we could see a pullback toward 6,878.
Should 6,878 fail to hold, a sharper decline toward the gap zone could occur.
Given the interest rate decision, expect high volatility — with sharp moves both up and down before and after the announcement.
If you’re planning to trade this event, manage your stop loss carefully and avoid overexposure.
Disclaimer:
This content is for informational purposes only and does not constitute financial or investment advice. © DIBAPRISM
Amir D.Kohn
Up again for SPX500USDHi traders,
Last week SPX500USD went up (making a Triangle invalid), made a correction down and went up again. It looks like the coreection was a running flat.
So now price could be in the next impulsive wave 5 (red) up and next week we could see more upside for this pair.
Let's see what the market does and react.
Trade idea: Wait for the finish of this bigger correction. Trading inside a Triangle is a sure way to lose.
This shared post is only my point of view on what could be the next move in this pair based on my technical analysis.
But I react and trade on what I see in the chart, not what I've predicted or expect.
Don't be emotional, just trade your plan!
Eduwave

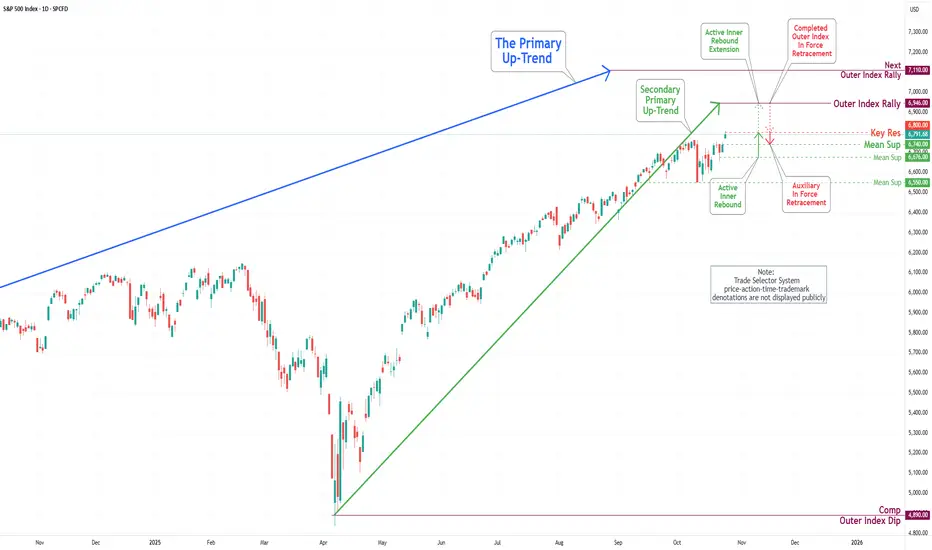
S&P 500 Daily Chart Analysis For Week of Oct 24, 2025Technical Analysis and Outlook:
The most recent trading session exhibited significant volatility in the S&P 500 Index, marked by pronounced price fluctuations between the Mean Resistance at 6671 and the Key Resistance at 6753. This range served as a crucial threshold for market participants, prompting a series of rapid buying and selling that influenced the index's overall wild movement. Ultimately, this price action culminated in a breakout above the completed Outer Index Rally at 6768.
At present, the index is situated at the newly established Key Resistance level of 6800, which lies just below the historical high of 6807. This positioning indicates the potential for further upward momentum, as the prevailing trend suggests a well-structured Active Inner Rebound extension toward the Next Outer Index Rally target of 7110.
Conversely, it is imperative to acknowledge the possibility of a sustained, steady-to-lower pullback from the Key Resistance level of 6800 to Mean Support 6740 for the Secondary Primary Up-Trend to continue on its path.
SPX500 ShortElite analysis
2 Possibilities
Price reacted off 4h structural liquidity
targets, lower liquidity pools

SPX | Daily Analysis #7 - 27 October 2025Hello and welcome back to DP Weekly Market Review,
Past Week Overview:
The past week saw a strong inflow of volume from investors optimistic about a market rebound, following the sharp two-week decline driven by renewed U.S.–China trade tensions. The S&P 500 initially showed a K-shaped reaction, but buyers quickly stepped in, pushing prices higher. By Friday, the market not only recovered but also broke above the previous high, setting a new record.
On Sunday, Treasury Secretary Bessent announced that the U.S. and China are ready to reach a trade agreement. This news fueled bullish sentiment in the Asian session, causing a major gap-up in the markets, with the index opening around the 6,850 zone.
Week Ahead:
This week stands as one of the most critical of the quarter for global markets.
Federal Reserve Decision: All eyes are on the Fed’s rate announcement—whether they hike, cut, or hold. Every word from Chair Powell regarding “soft landing,” “inflation progress,” or “economic resilience” could move global markets sharply.
Tech Earnings Season: The “Tech Titans” — Apple, Microsoft, Meta, Amazon, and Google — report their earnings this week. These giants collectively account for around 35% of the Nasdaq’s total weight.
U.S.–China Relations: President Trump is expected to meet President Xi for the first time in his second term, with trade tensions still in the background.
1H – 4H Technical Outlook:
As shown on the chart, the market opened with a large bullish gap. Some short-term traders anticipate a pullback to fill the gap, which could push prices down toward the 6,800 area. However, a sustained move above 6,860 may signal further bullish momentum toward the upside.
Trading Strategy:
For now, patience is key — let the market reveal its reaction around key price zones before entering new positions.
Disclaimer:
This content is for informational purposes only and does not constitute financial or investment advice. © DIBAPRISM
Amir D.Kohn

S&P 500 made new all time highs of 6807- S&P 500 does not left behind, it also made new all time highs from Shocks of Tariffs to Market Recovery 📈
- The U.S. market witnessed a sharp 3% drop after Trump’s 100% tariff announcement on China, wiping off nearly $3 trillion in market cap.
- Yet, in just 15 days, the index bounced back, adding back those trillions and stabilizing near a $58 trillion market cap.
- Volatility remains high as trade tensions and election uncertainty drive investor sentiment. ⚖️
