Risks and Challenges of FII Dependence1. Market Volatility and Sensitivity
One of the primary risks of dependence on FIIs is the potential for heightened market volatility. FIIs are highly mobile investors who often chase short-term gains. Their investments can be withdrawn quickly in response to global economic changes, political events, or shifts in market sentiment. Such sudden inflows or outflows can cause sharp price fluctuations in equity and debt markets, leading to instability.
For instance, during global crises or periods of rising interest rates in developed markets like the U.S., FIIs may withdraw funds en masse from emerging markets, causing significant stock market crashes. In countries where domestic institutional investors and retail participation are relatively low, the volatility induced by FIIs can be particularly severe. This volatility not only affects investor confidence but can also have wider economic consequences, including reduced investment by domestic players and businesses.
2. Exchange Rate Risk
FIIs invest in local currency-denominated assets, but their base capital is often in foreign currency. This exposes countries to currency risk, as inflows and outflows of foreign capital influence exchange rates. When FIIs withdraw capital rapidly, it can lead to a depreciation of the local currency, raising the cost of imports and increasing inflationary pressures.
Moreover, currency depreciation can exacerbate the burden of external debt, as repayments become more expensive in local terms. Countries heavily reliant on FII inflows are therefore vulnerable to speculative attacks on their currency, especially during periods of global financial instability.
3. Short-Term Focus and Herd Behavior
FIIs often prioritize short-term returns over long-term investment. This short-term orientation can distort market functioning. During periods of market euphoria, FIIs tend to drive up stock prices, inflating asset bubbles. Conversely, during periods of uncertainty, they may withdraw investments abruptly, triggering sharp corrections.
The herd behavior of FIIs—where multiple institutional investors move in and out of markets simultaneously—can amplify market swings. For example, when FIIs collectively reduce exposure to emerging markets due to global risk aversion, it can result in panic selling, impacting domestic investors and businesses disproportionately. Such behavior makes financial markets more vulnerable to external shocks and reduces the effectiveness of domestic monetary policies aimed at stabilizing markets.
4. Dependency on Global Economic Conditions
Countries dependent on FII inflows are inherently exposed to global economic conditions beyond their control. Factors such as interest rate hikes in developed countries, geopolitical tensions, or changes in global liquidity conditions can influence FII behavior. For instance, if U.S. interest rates rise, FIIs might prefer to invest in U.S. assets, leading to capital outflows from emerging markets.
This dependence on global conditions creates a situation where domestic markets may experience booms and busts irrespective of local economic fundamentals. Policymakers may find it challenging to implement effective economic policies when capital flows are driven primarily by external factors.
5. Impact on Domestic Investment Patterns
Heavy reliance on FIIs can crowd out domestic institutional investors. When markets are dominated by FII activity, domestic investors may feel sidelined or discouraged from investing, leading to underdeveloped domestic capital markets. This can reduce the diversity of investment sources and create an over-reliance on foreign capital for market functioning.
Additionally, FIIs often prefer large-cap, highly liquid stocks, leaving mid-cap and small-cap companies underserved. This selective investment behavior can distort capital allocation in the economy, favoring sectors and companies that may not necessarily contribute most effectively to long-term economic growth.
6. Regulatory Challenges and Market Manipulation
FIIs, while generally regulated by both home and host countries, operate across multiple jurisdictions, making regulatory oversight complex. This cross-border nature can pose challenges for authorities in monitoring and managing sudden capital inflows or outflows.
Moreover, the influence of FIIs on market prices can sometimes enable market manipulation or speculative practices that disadvantage domestic investors. Regulatory authorities often have limited tools to manage or moderate such behavior, increasing systemic risk. Excessive dependence on FIIs without a robust regulatory framework can therefore undermine market integrity.
7. Macroeconomic Vulnerabilities
Beyond financial markets, FII dependence can create broader macroeconomic vulnerabilities. Sudden capital outflows can disrupt the balance of payments, weaken foreign exchange reserves, and trigger inflationary pressures. Countries that rely heavily on FII inflows to finance fiscal deficits or fund infrastructure projects are particularly exposed to these risks.
Additionally, overdependence on FIIs can reduce the incentive for countries to develop sustainable domestic savings and investment mechanisms. This structural weakness can hinder long-term economic stability and growth.
8. Political and Policy Risks
FIIs are sensitive not only to market conditions but also to political and policy developments in host countries. Changes in taxation, regulatory frameworks, or government policies can influence FII behavior. For example, increased capital gains taxes or stricter investment regulations may prompt FIIs to reduce exposure to a country, triggering capital outflows.
This interdependence can make domestic policy formulation challenging. Policymakers might feel constrained in pursuing reforms that are essential for long-term growth due to fear of scaring away foreign investors. Such a scenario can limit the sovereignty and flexibility of economic management.
9. Strategies to Mitigate FII Dependence
To reduce the risks associated with FII dependence, countries can adopt multiple strategies:
Diversification of Investors: Encouraging participation from domestic institutional investors, retail investors, and pension funds can reduce reliance on FIIs.
Strengthening Regulatory Frameworks: Improved oversight and regulation can mitigate the risks of speculative inflows and outflows.
Capital Flow Management: Tools such as prudential limits, taxes on short-term inflows, and macroprudential measures can moderate excessive volatility.
Developing Domestic Financial Markets: Building deeper and more liquid domestic markets attracts long-term investors and reduces vulnerability to FII behavior.
By balancing foreign capital with strong domestic investment participation, countries can enjoy the benefits of FIIs while minimizing the associated risks.
10. Conclusion
While Foreign Institutional Investors bring substantial benefits to emerging markets in terms of liquidity, capital inflows, and investment expertise, overdependence on their participation exposes economies to several risks. These include market volatility, exchange rate pressures, short-term investment biases, herd behavior, and macroeconomic vulnerabilities. Additionally, FIIs’ sensitivity to global and political conditions can constrain domestic policymaking and market stability.
Mitigating these challenges requires a multi-pronged approach, focusing on strengthening domestic investment, regulatory oversight, and financial market development. A well-balanced approach ensures that FIIs remain a source of growth rather than a potential source of instability. Ultimately, the goal is to harness foreign investment for sustainable economic development while safeguarding the domestic economy from external shocks and speculative risks.
Trade ideas
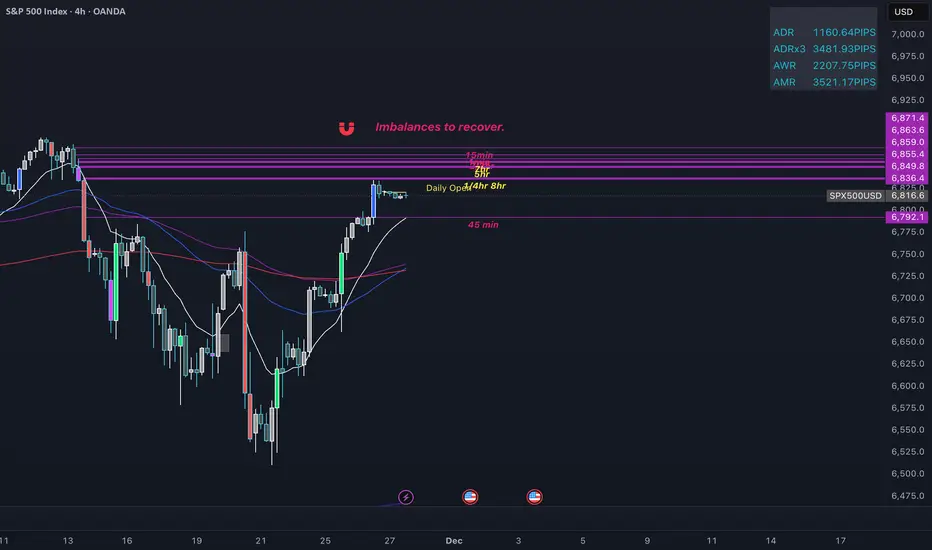
SPX500 Coiling Below Imbalance Cluster — Liquidity Buildup Befor🧠 Update:
SPX500 has pushed higher since the last update and is now consolidating just below a significant cluster of unfilled imbalances (vector candles) spanning multiple timeframes — 5min, 15min, 1hr, 2hr, 4hr, and 8hr.
This confluence of inefficiencies above is acting like a liquidity magnet. Price is currently hovering beneath this stack, potentially accumulating liquidity through sideways action. This type of coiling behavior often precedes a sharp expansion, especially when price respects support levels (e.g., Daily Open, 45min imbalance) without closing below.
Key Insight:
If price remains supported and continues ranging under this cluster, it's likely creating inducement (liquidity) above. Once enough buy-side liquidity is built up, a breakout targeting the imbalance zones becomes a high-probability scenario.
📍 Levels of Interest:
✅ Imbalance Zones:
5min / 15min / 1hr / 2hr / 4hr / 8hr vectors (magenta)
🟡 Daily Open Holding as Support
🔮 Projected Move: Coiling → Liquidity Grab → Imbalance Fill
Keep an eye on any sweep of local highs followed by bullish delta or volume confirmation — that could be the trigger.
Idea will be updated as structure develops further.
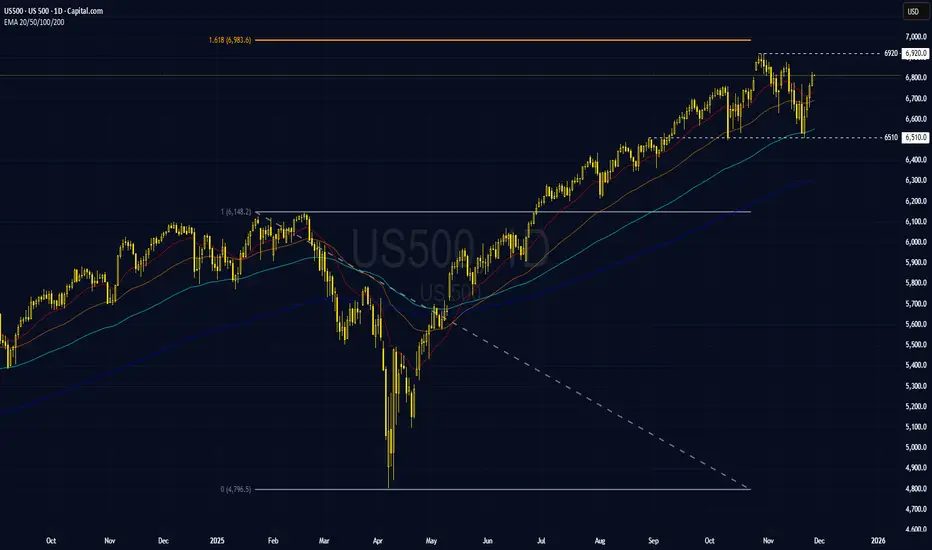
US500: Balancing Rate-Cut Optimism, AI Hype, and Growth RisksUS500: Balancing Rate-Cut Optimism, AI Hype, and Growth Risks
Technical Analysts
1. US500 bounced off EMA100 for the first time in six months, flagging a weak upside momentum and raising the potential of a corrective phase, with price likely to consolidate within the 6,510–6,920 range.
2. That said, the EMA stack remains positively aligned, keeping the broader bias to the upside.
3. A decisive break above the prior high near 6,920 would confirm uptrend continuation, opening the door to further gains.
4. Conversely, the 6,920–6,980 area is a key resistance zone; failure to clear this area would increase the odds of a pullback toward support around 6,510.
Fundamental analysis
The US500 is being driven by a mix of supportive and negative factors.
5. On the supportive side, expectations of a Fed rate cut in December help boost risky assets, while lower bond yields encourage investors to seek higher-yielding assets.
6. On the negative side, US economic data have shown signs of weakness, including labor market indicators and economic activities, alongside stretched valuations in tech stocks and concerns over AI-related spending.
7. All of these factors are likely to keep the US500 trading within a range and volatile, amid shifting fundamentals and an index that has already risen significantly since the start of the year. Any further rallies could be followed by profit-taking.
8. Key points to watch are major data releases such as labor market figures, inflation, and evolving expectations for a Fed rate cut in December.
Analysis by: Krisada Yoonaisil, Financial Markets Strategist at Exness
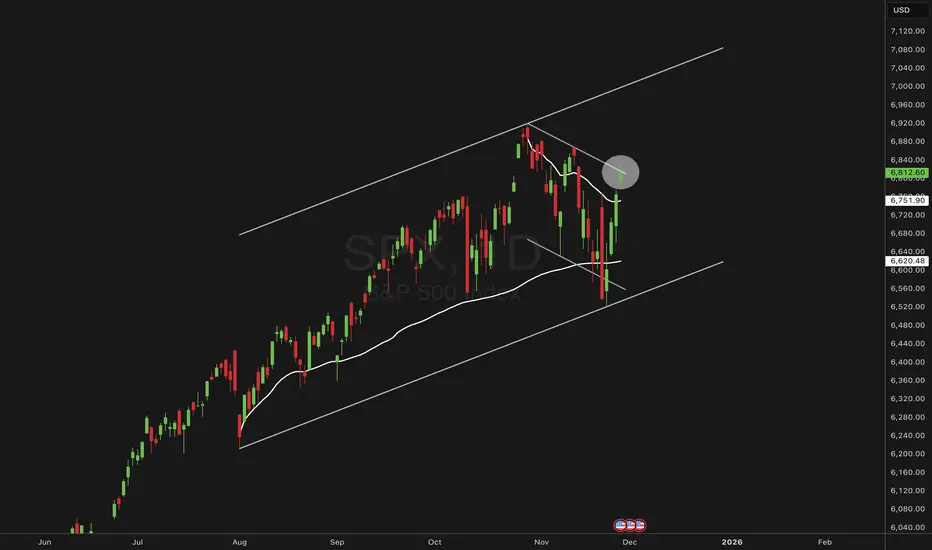
SPX | Testing the Upper Flag Line After AVWAP Shifts The index has steadied as broader sentiment firms, with markets leaning on softer inflation trends and a more patient Federal Reserve tone. That backdrop has helped risk appetite rotate back into equities after the recent pullback.
Technical Lens:
The chart shows SPX rebounding cleanly from the lower boundary of its broader bullish channel, which also aligns with the anchored VWAP drawn from the August 2025 swing low. That confluence provided a strong reaction zone. Price has since pushed through the anchored
VWAP set from the 29 October high, suggesting momentum is shifting back towards the upper side of the structure. The index now sits just beneath the upper boundary of the short-term bull flag, and this zone becomes an important area to monitor as it acts as the immediate ceiling.
Scenarios:
If the upper flag line gives way, the move could open room for continuation along the channel towards the next structural resistance zones.
If the flag line holds, the market may consolidate or retest the mid-channel levels, with the prior AVWAPs acting as nearby reference points.
Catalysts:
US GDP revisions, PCE inflation data and major tech earnings later this week may be the triggers that decide whether the index pushes through or pauses here.
Takeaway:
This upper flag boundary is the key inflection point for SPX, with the anchored VWAP shifts helping define the directional bias.
S&P500 - US markets closed, liquidity thinUS Thanksgiving Holiday
US markets closed, liquidity thin globally.
Expect muted volumes, potential for exaggerated moves in FX and rates due to reduced participation.
Key Support and Resistance Levels
Resistance Level 1: 6830
Resistance Level 2: 6848
Resistance Level 3: 6866
Support Level 1: 6770
Support Level 2: 6756
Support Level 3: 6735
This communication is for informational purposes only and should not be viewed as any form of recommendation as to a particular course of action or as investment advice. It is not intended as an offer or solicitation for the purchase or sale of any financial instrument or as an official confirmation of any transaction. Opinions, estimates and assumptions expressed herein are made as of the date of this communication and are subject to change without notice. This communication has been prepared based upon information, including market prices, data and other information, believed to be reliable; however, Trade Nation does not warrant its completeness or accuracy. All market prices and market data contained in or attached to this communication are indicative and subject to change without notice.

Don’t Let Panic Drive Your Decisions, The Market Reward PatienceDon’t Let Panic Drive Your Decisions — Because The Market Rewards Patience
The last few days in the S&P 500 were the perfect reminder of how quickly sentiment swings — and how dangerous emotional trading can be.
* Nov 20: Headlines screamed about an “AI Bubble Burst,” triggering panic selling.
* By Nov 21: Market declined +3.5%, wiping over $2 trillion in market value.
* By Nov 26: The same market recovered $2.6 trillion, pushing the S&P 500 back above 6800
* S&P 500 is now just 1.6% away from all-time highs (6921).
Anyone who sold in fear on Nov 20–21 is now sitting on regret, while disciplined investors who stayed calm are comfortably in profit.

The World Economy’s Journey in the Trading Market1. Early Foundations: The Birth of Global Trade
Modern world trade began centuries ago with land routes, maritime exchanges, and colonial expansions. However, true economic globalization began after the Industrial Revolution.
Factories produced goods at scale, and countries required raw materials, capital, and new markets. This interdependence set the foundation for a global trading web.
Key Features of Early Global Trade
Simple Trading Infrastructure: Telegraphs, ships, and railways connected markets but at slow speeds by today’s standards.
Commodity Dominance: Coal, textiles, metals, and agricultural products drove trade volumes.
Gold Standard: Most countries pegged their currencies to gold, stabilizing international trade.
Though primitive compared to today, these early systems planted the seeds for a unified world economy.
2. Post-War Growth and the Era of Financial Globalization
After World War II, nations realized that economic cooperation was essential for peace and progress. This launched institutions like:
IMF (International Monetary Fund)
World Bank
GATT → WTO (World Trade Organization)
These bodies shaped trade rules, stabilized currencies, and opened markets.
The Bretton Woods System
The global economy operated under a fixed exchange-rate regime led by the U.S. dollar pegged to gold. This stable environment helped:
Facilitate international trade
Increase capital flows
Rebuild war-torn economies
When the system collapsed in 1971, floating exchange rates emerged, giving birth to modern currency trading.
3. Rise of Capital Markets: Stocks, Commodities, and Currencies Go Global
From the 1980s onward, deregulation and technology transformed world markets.
Key Milestones
Electronic trading platforms replaced floor trading.
Multinational corporations expanded production globally.
Derivatives markets (futures, options, swaps) exploded in size.
Hedge funds, investment banks, and pension funds became major market players.
Oil, gold, and commodity futures shaped inflation and energy policies.
This period marked a fundamental shift:
Trade was no longer limited to goods; money itself became the most traded commodity.
Foreign exchange (forex) grew into a $7-trillion-a-day market, making it the largest financial market in the world.
4. Digital Revolution: The 21st Century Trading Landscape
With the rise of the internet and high-speed computing, the early 2000s launched the digital trading era.
What changed?
Algorithmic trading (algo trading) began executing trades in milliseconds.
Online brokerages democratized market access.
Financial information became instant and global.
High-frequency trading (HFT) reshaped liquidity and market volatility.
Cryptocurrencies emerged as a parallel financial system.
Mobile trading apps made stock participation mainstream.
The world economy became deeply connected: A policy change in China or a tweet from a global leader could move markets worldwide.
Key Drivers of Modern Global Trade
Technology
Capital mobility
Global supply chains
Central bank policies
Cross-border investments
This phase also brought unprecedented speed—capital could fly across continents in seconds, impacting currencies, equities, commodities, and bond markets simultaneously.
5. The Shockwaves: Crises That Reshaped Global Markets
Major global events redefined the world economy’s trading journey:
2008 Global Financial Crisis
Triggered by U.S. mortgage collapse
Nearly crashed global banking
Led to quantitative easing (QE) era
Pushed interest rates to near zero
This event emphasized how interconnected global markets had become.
COVID-19 Pandemic (2020)
Disrupted supply chains
Crashed global demand initially
Fuelled the greatest monetary stimulus in history
Caused inflation waves across the world
Financial markets experienced extreme volatility, while digital and retail trading boomed.
Russia–Ukraine Conflict
Massive impact on energy, oil, natural gas, and wheat prices
Reshaped Europe’s energy landscape
Elevated geopolitical risk across global markets
Each crisis reshaped trading behavior, capital flows, risk perception, and investor psychology.
6. The Shift to Multipolar Trading: De-globalization Begins
From 2020 onwards, a new phase began: geoeconomic fragmentation.
The world is slowly drifting away from a U.S.-centric model into a multipolar system with major players like:
United States
China
India
European Union
Middle East (as energy and investment hubs)
Emerging Trends
Friend-shoring and reshoring of supply chains
Rise of regional trade blocs
Energy transition reshaping commodity markets
Local currency trade agreements (INR, yuan, ruble)
Digital currency experimentation by central banks (CBDCs)
Countries are building self-reliance while still operating within global markets—a hybrid model of globalization.
7. The Future: Where the World Economy and Trading Market Are Heading
The journey continues as new forces redefine global trade:
A. Rise of AI-Driven Markets
Artificial Intelligence is changing how markets function:
Real-time market prediction
Automated portfolio rebalancing
Sentiment analysis through big data
Algorithmic hedging strategies
Ultra-fast execution
Trading is becoming more data-driven, precise, and automated.
B. Green Energy and Commodity Supercycles
The global shift toward renewable energy is reshaping:
Lithium
Copper
Nickel
Rare earth metals
Natural gas
These commodities are becoming the new strategic assets of the 21st century.
C. Battle of Currencies: USD vs New Regional Powers
The U.S. dollar still dominates global trade, but new challenges are rising:
China promoting yuan settlement
India increasing INR trade agreements
Middle East exploring oil trade in non-USD currencies
Digital currencies becoming part of financial networks
While the dollar remains strong, the future will likely see multiple important currencies power trade.
D. Digital Assets and Blockchain
Crypto, tokenization, and blockchain-based systems are reshaping:
Settlement speed
Transparency
Cross-border payments
Decentralized finance (DeFi)
Tokenized commodities and real-world assets
This could become the next major phase of global trading.
Conclusion: A Journey That Never Stops
The world economy’s journey in the trading market is a story of continuous evolution—driven by technology, politics, crises, and the collective ambitions of nations and markets.
From simple trade routes to AI-based trading desks, from gold-backed currencies to digital assets, and from regional markets to global interdependence—the world of trade has expanded beyond imagination.
Today’s global economy is:
Faster
More interconnected
More competitive
More volatile
More data-driven
And the journey ahead promises even greater transformation as nations redefine alliances, technology reshapes markets, and investors navigate an increasingly complex global landscape.
$SPX next move higherSP:SPX 5510 is my short TP level and level to go long. It hit perfectly on Friday and now we are 200 points higher. Price action is still bullish (despite the bearish weekly candle last week). 5826 is next magnetic level. And a break above the trendline will see ATH before next of year.

Bulls don't get too comfortable....fundamentals still not goodHave been tracking the swings recently and macros and it's worth noting that the fundamentals of the economy are still weak. The upcoming rate reduction is already priced in, and it won't change the employment / defaults / private credit environment and inflation. Expect a dip very very soon and red across the board. The economy is being propped up with hot air and it's just not sustainable. All the macros are screaming red and people are ignoring until it's too late.
#SQQQ could be an interesting hedge, but would pull out now from any long positions as the AI bubble is showing big cracks and people are deciding to look the other way until they get wiped out.
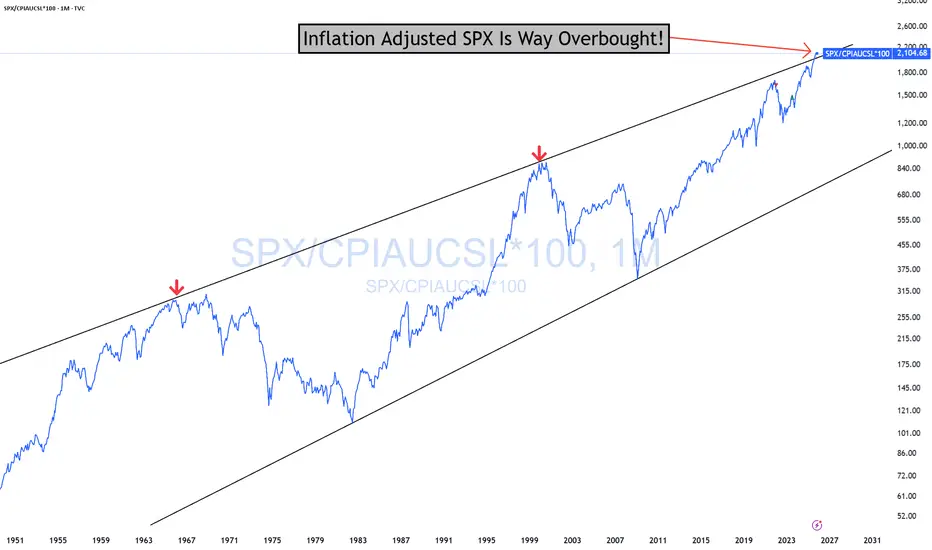
SPX Overbought In Real Terms WARNING!SPX Overbought In Real Terms (Inflation-adjusted) Stripping away inflation shows you the "real" value of SPX.
This is not something you will likely see again in your lifetime. We have only been this overbought twice before since 1947! Both times, what followed was a bear market. You are far more likely to see the price hit the bottom of the channel in your lifetime.
As is always the case, no one will want to touch stocks then. Rest assured, I, for one, will be buying up a storm then.
You have all been WARNED!
GTFO and STFO!
Risk Management is paramount!
THANK YOU for getting me to 5,000 followers! 🙏🔥
Let’s keep climbing.
If you enjoy the work:
👉 Boost
👉 Follow
👉 Drop a solid comment
Let’s push it to 6,000 and keep building a community grounded in truth, not hype.

Bearish Shark - Retest All time highs? Speculating on another run up to retest all time highs for OANDA:SPX500USD before capitulation or significant retracement event, depending on rate cuts and or QE news of course.

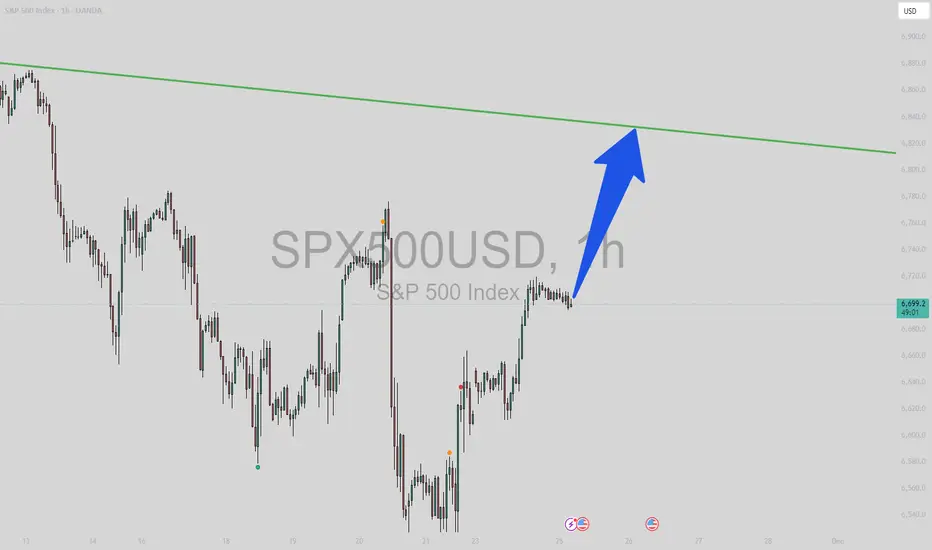
SPX - Setups for both Long and Short SPX is approaching a trendline that will give us direction is which way to trade. A break above this line we can look for longs, any type of rejection such as bearish engulfings on the line, is a good risk short trade. Feel free to drop opinions!

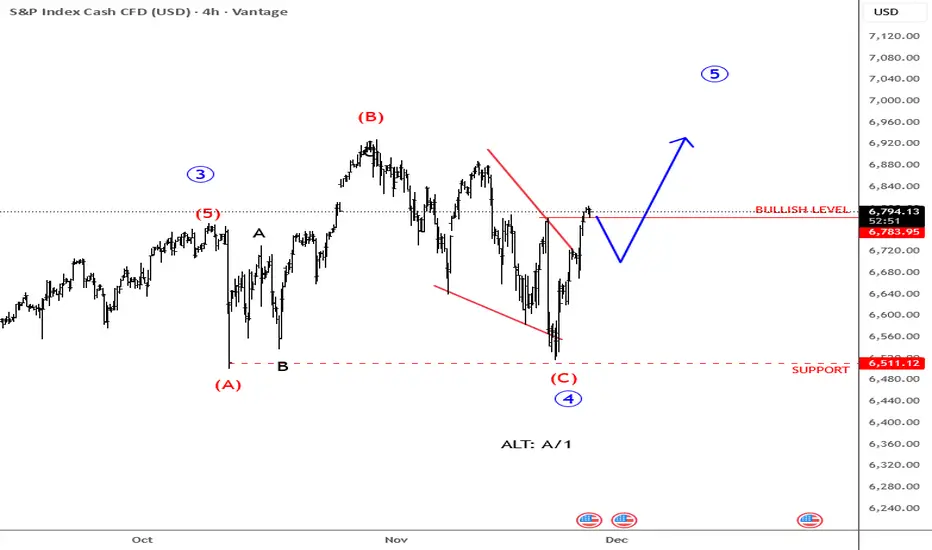
SP500 Resumes The Uptrend After Bears Stops At Key LevelUS stock market moved lower recently, and we’ve seen one of the biggest declines in the last few months, with lower highs and lower swing lows for the last couple of weeks, but there is still a chance that this is basically a diagonal formation on SP500, either in wave C or alternatively already in wave A or wave 1. But so far looks more like a completed C wave of a flat due to the current strong rebound, which can be the beginning of a new wave 5 headed towards new highs; What’s important in the near future, in our opinion, is that as long as the market trades above 6512 support, there is a real chance that there will be more upside in the near-term. At least three wave rally is what I would be looking for.
GH
The Bears last standThis level and slightly higher needs to hold otherwise we're going to test the highs and possibly go much further. If there is no reversal today, we will be closing over the 18ma for two days in a row and that is certainly bullish. The Vix needs to get over 20 for a reversal to start having legs. Gold is just sideways. Oil is coiling up for a larger move - possibly down. BTC looks like it can go lower.

US500 Outlook: Upside Bias Persists.Fundamental Analysis: Macro Drivers
Market participants are currently expressing renewed confidence in Federal Reserve rate cuts, driving a risk-on sentiment that is the primary support for US equity valuations and the US500. Lower interest rates decrease discount rates for future earnings, which benefits growth-oriented sectors like technology and consumer discretionary.
The US500’s rally benefits from the prevailing market view that the Fed will cut interest rates, a primary factor reducing the discount rate and lifting asset valuations. Additionally, earnings strength from mega-cap technology companies like Nvidia (NVDA), Meta Platforms (META), and others reinforces market optimism and risk appetite. Although US job growth softened, recent payrolls data exceeded expectations, and falling inflation supports the case for monetary easing. Focus turns to further US economic data to confirm growth risks
Technical Analysis: Breakout and Targets
US500 recently broke above the psychological resistance at 6,770, indicating strong upward momentum. The price is currently consolidating gains near this former resistance. Should the rally continue, the next major upside target for US500 is the resistance at 6,830.
Conversely, falling below the 6630-6700 range could lead US500 to retest the subsequent support at 6,515. US500 will likely find initial support near 6630 if a minor pullback occurs
Outlook: Upside Bias Persists
With dovish Fed expectations and continued strong performance from the technology sector, the US500 outlook maintains an upside bias. Closing above 6,830 could prompt US500 to retest the following resistance at 6,925. However, volatility may increase as investors watch for any major shift in the economic environment or a change in the Fed's guidance.
Analysis by Terence Hove, Senior Financial Markets Strategist at Exness.

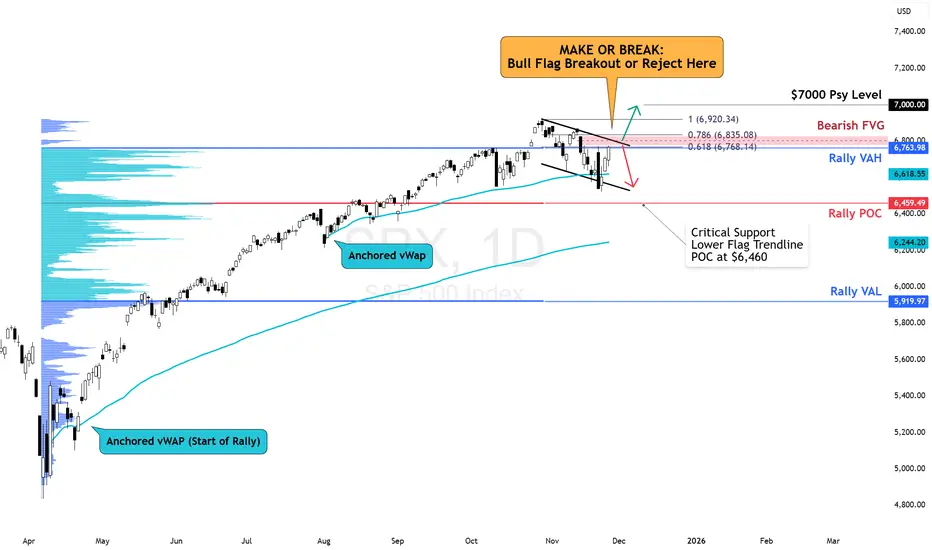
SPX Make or Break: Bull Flag or FVG RejectionSPX is in a make or break situation. Break this bull flag, and we could head header to touch the $7,000 psychological level. Reject here, and we could see lower at $6,500.
After reclaiming the anchored vWAP, SPX is pushing into a stacked zone of resistances:
Upper Bull Flag trendline
Bearish Fair Value Gap
0.618 Fib Retracement
Upside trigger:
– Break and hold above the FVG + 0.786 (≈ 6835–6920).
– Target = retest of highs / 7000.
Downside trigger:
– Failure at FVG
- Breakdown of bull flag
- Move towards Rally POC at 6459
SPX500: Risk-On Sentiment Builds as Bulls Eye 6733SPX500 | Technical Overview
Global markets are riding a risk-on wave after a sudden jump in U.S. rate-cut expectations, triggered by dovish comments from several Federal Reserve officials.
However, gains may cool in Europe as FX markets remain alert to possible Bank of Japan yen intervention.
Geopolitics also added to market sentiment:
U.S. President Donald Trump described relations with China as “extremely strong” after his call with President Xi — reinforcing a short-term risk-on environment.
Technical Outlook
SPX500 is expected to retest the pivot zone near 6670–6705 before attempting another bullish extension.
Bullish Scenario:
After retesting the pivot, the price may push upward toward 6733, and if momentum holds, extend to 6771 and 6800.
Bearish Scenario:
A 1H candle close below 6670 will activate bearish pressure toward 6635, with further downside potential toward 6578.
Overall structure remains bullish as long as the price trades above the pivot zone.
Support: 6670 · 6635 · 6578
Resistance: 6733 · 6771 · 6800

US500 Bullish: Entry: 6,700 – 6,720US500 – Institutional Intraday Analysis (Athena Protocol v7.3)
Exchange: IC Markets
Current Price: ~6,791.00
Current Time: 01:57 UTC-5
Timeframe: 90m
1. Market Bias: Bullish (but overstretched and vulnerable to a liquidity tap)
Bias Explanation
This chart screams: “Yes, we are bullish, but please… someone sweep me properly before I continue.”
Let’s break it down.
Goldbach Levels
Strong PO3 clustering around 6561 and 6723–6804, but price is now far above these baselines.
– Algo signals on the 27 and 81 rows: BR → FV, RB → OB, -RB → -OB
These represent continuation patterns, not reversal ones.
– The 243 & 729 rows show FV → MB and LV → -LV, again supportive of continuation after retracement.
Conclusion: Goldbach models favor bullish continuation after a pullback.
They do not support longing at current highs.
Visible Range Volume Profile
– Major HVN at ~6,690–6,720
– Low-volume void above price → explains the straight-line rally.
– But current price at 6,791 is sitting in a thin-volume zone = susceptible to deep intraday pullbacks.
Session Volume Profile
– Sessions are printing higher Value Area Highs and Lows → trending structure.
– But today’s session POC is lagging behind price → inefficiency = retracement likely.
CVD
– CVD is flat-to-slightly declining despite price rising.
This is one of Athena’s biggest red flags:
Displacement not supported by real buy flow = engineered move.
COT (Non-Commercial USD positions)
Massively bearish sentiment:
– % Short = 73%
– Net positions = –14,933, worsening from –13,145
– Big players increased shorts, decreased longs.
This is why pullbacks on US500 have been savage lately.
Macro Snapshot
– FOMC cautious but not dovish; market pricing soft-landing narrative.
– Trump’s fiscal plans support equities short-term.
– But rising Middle East tensions + Treasury issuance linger as downside catalysts.
Overall Bias: Bullish trend, but the smarter long is taken after the sweep.
2. Key Interpretation
– Market is too high, too fast.
– CVD + COT warn that this pump is weak-handed.
– Volume profile signals a retest toward 6,720 or even 6,660 before further rally.
Bias: BUY ONLY — but only after liquidity raids.
Not at the highs. Never at the highs. Not even if you’re feeling lucky.
3. Smart Money Buy Levels
A. Aggressive Buy Limit
Entry: 6,745 – 6,755
SL: 6,708
TP1: 6,793
TP2: 6,820
TP3: 6,855
Rationale:
– First micro-inefficiency beneath current structure.
– Will likely fill on the first intraday pullback.
– Partial mitigation of the OB at the current high.
Win Probability: ~58%
Works if momentum continues without deep sweep.
B. Conservative Buy Limit (Primary Institutional Level)
Entry: 6,700 – 6,720
SL: 6,660
TP1: 6,780
TP2: 6,815
TP3: 6,860
Rationale:
– This is the visible range HVN and prior volume shelf.
– The ideal level where algos reload.
– Matches Goldbach’s 81 PO3 level + session POC cluster.
Win Probability: ~72%
Most reliable for today’s trading.
C. Very Safe Buy Limit (Institutional Raid Zone)
Entry: 6,645 – 6,660
SL: 6,588
TP1: 6,720
TP2: 6,780
TP3: 6,840
Rationale:
– Deep sweep of equal intraday lows.
– Cleans out all short-term long stops.
– Aligns with Goldbach 729 and 243 baseline structures.
– Best RR, but may not fill unless NY session gets heavy liquidity injection.
Win Probability: ~81%
The highest-probability setup but lowest fill probability.
4. Why These Plays Work
Technical Confluence
– US500 is extended into low-volume weeds.
– CVD shows buyers exhausted.
– Goldbach signals agree with continuation but ONLY after the retrace.
– Volume profiles indicate untested demand zones below.
Macro Confluence
– Equities remain favored but heavily crowded.
– Short-term short squeeze may have just finished.
– COT data screams: “Market too high. Needs a flush.”
So we wait… and buy the flush.
5. Best Trading Session
– London AM → NY Opening Range
These sessions consistently deliver the retracements US500 refuses to give in Asia.
6. Athena’s Final Words
US500 right now is like a caffeinated intern: sprinting full-speed without checking whether their shoelaces are tied.
Spoiler: they’re not.
Let the kid trip, scoop up the dip, and ride the rebound.
This is educational analysis, not financial advice.

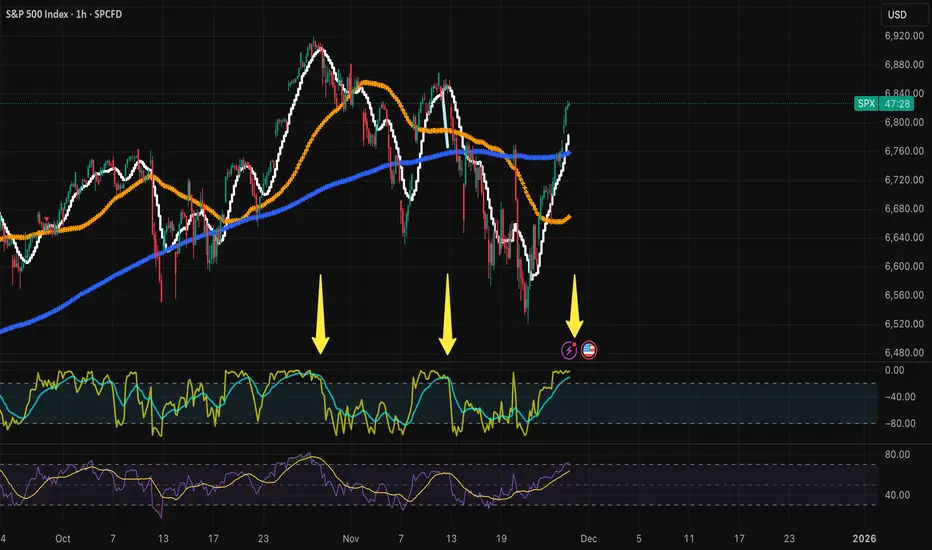
Hindenburg Omen Is Flashing AgainThe Hindenburg Omen has triggered, and it’s lining up with what the market breadth data has been whispering for months. If you look at the bottom pane, you’ll see the percentage of stocks above their major moving averages has been sliding for about six months.
So even though the index has kept pushing to new highs, fewer stocks are moving with it. A small group of mega-caps is doing all the heavy lifting, while the broader market slowly weakens underneath.
Historically, that’s exactly the kind of environment where the Hindenburg Omen becomes relevant. It doesn’t promise a crash, but it flags when internal conditions have deteriorated enough to allow one. Several past signals have occurred before meaningful corrections.
Why This Matters Now
The next couple of weeks are important. CPI, PPI and labour data between now and 10 December will shape expectations heading into the FOMC meeting. If the Fed changes tone on monetary policy, liquidity, or the path of rates, it will feed directly into sector rotation and capital flows.
That’s why I’m not committing to any major trades right now. The signals are mixed, breadth is weakening, leadership is narrow and policy risk is rising. Capital preservation comes first until we get a clear direction from the data and the Fed.
Sometimes the smartest move is patience. Let the data confirm the story. The market isn’t going anywhere.

Sell US500 – Clear Signs of Bearish Smart-Money Flow1. Bearish structure confirmed
The previous bullish Order Block has been completely broken with a sharp displacement and high volume.
When an OB fails this decisively, it signals a clear shift in market structure from bullish to bearish as buyers lose control.
2. New Bearish Order Block formed at the break of structure
After the breakdown, price retraced back into the zone above the break and created a new VNShark-OB:
Strong breakout volume → footprint of Smart Money stepping in
Wide Imbalance (IMB) → liquidity gap left unfilled
Initial reaction from the zone → sellers defending the area
This is a typical smart-money pattern before the next bearish leg.
3. Trade Plan – Two Sell Limits
Sell Limit 1
First touch of the new OB
50% position size
Sell Limit 2
Higher liquidity sweep
100% position size
Expectation: Smart Money may push price higher to hunt liquidity before sending it lower.
4. Risk Management & Notes
No chasing if price drops without a retest
Position size according to strict risk management
Avoid trading near major news releases
Setup becomes invalid if price closes above the entire OB zone
Do not hold trades over the weekend
Signature
Follow VNShark to understand how Smart Money leaves footprints — and how you can follow them with precision.

