AUDUSD Potential DownsidesHey Traders, in today's trading session we are monitoring AUDUSD for a selling opportunity around 0.65100 zone, AUDUSD is trading in a downtrend and currently is in a correction phase in which it is approaching the trend at 0.65100 support and resistance area.
Trade safe, Joe.
Trade ideas

AUDUSD Breakout and Potential Retrace!Hey Traders, in today's trading session we are monitoring AUDUSD for a selling opportunity around 0.65800 zone, AUDUSD was trading in an uptrend and currently is in a correction phase in which it is approaching the retrace area at 0.65800 support and resistance area.
Trade safe, Joe.

AUD/USD Slips: Heading Towards 0.64400?AUD/USD is currently in a downtrend after failing to break through the resistance at 0.65000. Latest data from the RBA and the weakening of the USD have created resistance for the AUD. With the Federal Reserve not planning to cut interest rates immediately, the stronger USD is putting pressure on the AUD.
With the next support level at 0.64400, this pair could continue its decline in the short term. If this support level is broken, the downtrend may extend further.
Traders should closely monitor these support and resistance levels to optimize trading opportunities, especially with the market being influenced by interest rate policies and global economic factors.

AUDUSD in a falling wedge: ready for a strong bullish breakoutThe AUDUSD chart looks particularly intriguing right now. Recently, the pair has taken on a new, more confident character, shaping into a structure that radiates optimism.
The latest market interaction is especially eye-catching; it reveals the first hints of a potential rebound, while the previous bearish momentum is slowly fading away. Low-volume candles suggest market exhaustion, often the calm before a fresh upward move.
My target stands around 0.65450. If this scenario unfolds, we could witness a stunning price evolution, almost like a dramatic scene building after weeks of anticipation.
The setup is both elegant and promising, a story being written in real time, one that demands patience and confirmation before revealing its full potential.
While a bearish scenario remains possible, given the solid support below, I continue to lean bullish. The current structure exudes confidence, balance, and the quiet strength of a market preparing to rise again.

AUDUSD Potential DownsidesHey Traders, in today's trading session we are monitoring AUDUSD for a selling opportunity around 0.65300 zone, AUDUSD is trading in a downtrend and currently is in a correction phase in which it is approaching the trend at 0.65300 support and resistance area.
Trade safe, Joe.

AUDUSD resistance breakout indicative of a trend change?The AUDUSD remains in a neutral trend, with recent price action indicating a potential resistance retest within the broader uptrend.
Resistance Zone: 0.6560 – a key level from previous consolidation. Price is currently testing or approaching this level.
A bearish rebound from 0.6560 would confirm ongoing downside momentum, with potential targets at:
0.6500 – initial support
0.6490 – psychological and structural level
0.64800 – extended support on the longer-term chart
Bullish Scenario:
A confirmed break and daily close above 0.6560 would weaken the bullish outlook and suggest deeper downside risk toward:
0.6576 – minor resistance
0.6590 – stronger resistance and potential supply zone
Outlook:
Neutral bias remains intact while the AUDUSD trades around the pivotal 0.6560 level. A sustained break below or above this level could shift momentum.
This communication is for informational purposes only and should not be viewed as any form of recommendation as to a particular course of action or as investment advice. It is not intended as an offer or solicitation for the purchase or sale of any financial instrument or as an official confirmation of any transaction. Opinions, estimates and assumptions expressed herein are made as of the date of this communication and are subject to change without notice. This communication has been prepared based upon information, including market prices, data and other information, believed to be reliable; however, Trade Nation does not warrant its completeness or accuracy. All market prices and market data contained in or attached to this communication are indicative and subject to change without notice.

Buy AUD/USD 0.6519 — Fibo Confluence Setup, Uptrend ContinuationBuy AUD/USD 0.6519 — Fibo Confluence Setup, Uptrend Continuation.
Condition 1: The setup aligns with the uptrend; price still has room to continue moving higher, confirming trend continuation.
Condition 2: Draw a Fibonacci retracement in the direction of the trend. The strongest confluence zone (0.5–0.618) overlaps with the key level.
Based on this, we have a buy setup at 0.6519.
Stop loss: below the 0.5–0.618 Fibonacci zone at 0.6505.
Targets:
* Profit 1: 0.6560
* Profit 2: 0.6600
Analysis by: Analysis by: Hung Minsk Fibo Trung

AUD/USD) Bullish trend analysis Read The captionSMC Trading point update
technical analysis of AUD/USD, expecting a short-term corrective move upward toward the 0.6528–0.6530 target zone before potential continuation or rejection.
Here’s the breakdown 👇
---
Overall Idea
The analysis shows a potential bullish correction after a recent downtrend.
The market is expected to retest a key Fibonacci + EMA confluence area before deciding the next major move — so it’s a buy setup toward resistance (target zone).
---
Key Components
1. Market Structure
Price formed a clear swing low (0), showing early signs of buyer activity.
A break of the descending trendline is projected, suggesting momentum shifting upward.
The short-term plan is a retracement to previous supply (0.6528 zone).
2. Fibonacci Retracement Zone
The retracement area between 0.62 – 0.79 levels represents the target zone.
This blue zone aligns with the previous structure resistance, making it a logical take-profit area for short-term buyers or a potential sell zone for continuation traders.
3. EMA Confluence
50 EMA (0.65024) and 200 EMA (0.65287) sit inside or near the target zone — strong dynamic resistance levels.
The projected price path suggests the market will retest these EMAs before possibly facing rejection.
4. Projected Path
Price expected to break minor resistance, then pull back to form a higher low, and finally push upward to the target zone (0.6530).
The target point aligns perfectly with the 0.79 Fibonacci level and EMA confluence, marking it as a high-probability reaction area.
Mr SMC Trading point
---
Summary
Market bias: Short-term bullish (retracement move)
Entry idea: Look for minor pullback and bullish continuation after trendline break
Target zone: 0.6528 – 0.6530
Confirmation: Break of descending structure and retest of minor support
Invalidation: Break below 0.6460 (previous swing low)
---
Please support boost 🚀 this analysis

AUDUSD FRGNT Weekly Forecast -Q4 | W46 | Y25 |📅 Q4 | W46 | Y25 |
📊 AUDUSD FRGNT Weekly Forecast
🔍 Analysis Approach:
I’m applying Smart Money Concepts, focusing on:
Identifying Points of Interest on the Higher Time Frames (HTFs) 🕰️
Using those POIs to define a clear trading range 📐
Refining those zones on Lower Time Frames (LTFs) 🔎
Waiting for a Break of Structure (BoS) for confirmation ✅
This method allows me to stay precise, disciplined, and aligned with the market narrative, rather than chasing price.
💡 My Motto:
"Capital management, discipline, and consistency in your trading edge."
A positive risk-to-reward ratio, paired with a high win rate, is the backbone of any solid trading plan 📈🔐
⚠️ Losses?
They’re part of the mathematical game of trading 🎲
They don’t define you — they’re necessary, they happen, and we move forward 📊➡️
🙏 I appreciate you taking the time to review my Daily Forecast.
Stay sharp, stay consistent, and protect your capital
— FRNGT 🚀
OANDA:AUDUSD

AUDUSD loadingAUDUSD is loading — and most people are asleep at the wheel. ⚙️
The setup’s too clean to ignore. Pressure’s building where no one’s looking.
Every candle’s a clue… if you can read it.
This isn’t noise — it’s a tell.
If you don’t see it yet, you will. 📈
Don’t wait till it’s obvious.
If you know, you know. 📈👁️

FRGNT FUN COUPON FRIDAY -Q4 | W45 | D7| Y25 | AUDUSD📅 Q4 | W45 | D7| Y25 |
📊 AUDUSD FRGNT Daily Forecast
FRGNT FUN COUPON FRIDAY
🔍 Analysis Approach:
I’m applying Smart Money Concepts, focusing on:
Identifying Points of Interest on the Higher Time Frames (HTFs) 🕰️
Using those POIs to define a clear trading range 📐
Refining those zones on Lower Time Frames (LTFs) 🔎
Waiting for a Break of Structure (BoS) for confirmation ✅
This method allows me to stay precise, disciplined, and aligned with the market narrative, rather than chasing price.
💡 My Motto:
"Capital management, discipline, and consistency in your trading edge."
A positive risk-to-reward ratio, paired with a high win rate, is the backbone of any solid trading plan 📈🔐
⚠️ Losses?
They’re part of the mathematical game of trading 🎲
They don’t define you — they’re necessary, they happen, and we move forward 📊➡️
🙏 I appreciate you taking the time to review my Daily Forecast.
Stay sharp, stay consistent, and protect your capital
— FRNGT 🚀
OANDA:AUDUSD

AUDUSD FRGNT Daily Forecast Full Chart Analysis -Q4 | W45 | D7| 📅 Q4 | W45 | D7| Y25 |
📊 AUDUSD FRGNT Daily Forecast Full Chart Analysis
FRGNT FUN COUPON FRIDAY
🔍 Analysis Approach:
I’m applying Smart Money Concepts, focusing on:
Identifying Points of Interest on the Higher Time Frames (HTFs) 🕰️
Using those POIs to define a clear trading range 📐
Refining those zones on Lower Time Frames (LTFs) 🔎
Waiting for a Break of Structure (BoS) for confirmation ✅
This method allows me to stay precise, disciplined, and aligned with the market narrative, rather than chasing price.
💡 My Motto:
"Capital management, discipline, and consistency in your trading edge."
A positive risk-to-reward ratio, paired with a high win rate, is the backbone of any solid trading plan 📈🔐
⚠️ Losses?
They’re part of the mathematical game of trading 🎲
They don’t define you — they’re necessary, they happen, and we move forward 📊➡️
🙏 I appreciate you taking the time to review my Daily Forecast.
Stay sharp, stay consistent, and protect your capital
— FRNGT 🚀

AUDUSD Trading Opportunity! BUY!
My dear followers,
This is my opinion on the AUDUSD next move:
The asset is approaching an important pivot point 0.6496
Bias - Bullish
Technical Indicators: Supper Trend generates a clear long signal while Pivot Point HL is currently determining the overall Bullish trend of the market.
Goal - 0.6533
About Used Indicators:
For more efficient signals, super-trend is used in combination with other indicators like Pivot Points.
Disclosure: I am part of Trade Nation's Influencer program and receive a monthly fee for using their TradingView charts in my analysis.
———————————
WISH YOU ALL LUCK

AUD/USD 4H – Market Outlook and Trade ThesisFOREXCOM:AUDUSD AUD/USD is currently trading around 0.6495, sitting just above a prior minor liquidity pocket and approaching a broader demand zone centered around 0.64407. Price action has been steadily retracing from the recent swing highs, and the structure suggests a potential liquidity sweep into the 0.64407 demand zone, which aligns with the base of my marked region.
Bullish Scenario
My projection is that price will drop into 0.64407, tap the demand zone, reject strongly, and then rotate higher toward the previous major swing high.
My target aligns with the upper green zone toward 0.67065, which corresponds to a high-value inefficiency zone and a prior rejection level. This creates a logical buy-to-sell profile: liquidity grabs at the lows followed by a drive into a premium zone where sellers were previously active.
Stop-Loss Structure
Your stop loss should be placed at the red line below 0.64140, which strategically sits outside the deeper liquidity shelf. If hit, it would invalidate the entire bullish structure and confirm that buyers are not defending the zone.
This placement is logical because:
1. It protects you from minor stop hunts inside the redistribution wick cluster.
2. A break below 0.64140 would confirm bearish continuation rather than a corrective pullback.
⸻
Devil’s Advocate: What Could Break This Setup?
To avoid bias, here are the key threats to this bullish idea:
1. AUD remains fundamentally weak
If risk sentiment worsens or USD strength accelerates on macro data, price may not respect the 0.64407 zone at all.

AUDUSD 15M analysisIf price takes IDM we can buy in OB .
or we can buy in extreme OB.
Also we can sell in D POI .
Pay attention: Use low timeframe confirmation and risk management .
We are not responsible for your losses or profits.

Will AUD/USD Continue Its Downswing?AUD/USD 1-hour chart - My Trade (Do NOT take this trade. It's only a report on my current position)
Trade Direction: SELL
Current Price: 0.6490
Entry Price: 0.6508 (sell limit at broken support → resistance band 0.6505–0.6512)
Stop Loss: 0.6532 (above recent H1 lower-high cluster; includes ~2-pip spread)
Take Profit: 0.6448 (return to October swing-low liquidity zone 0.6445–0.6450)
Risk/Reward Ratio: 2.50
Confidence: 9.1/10
Invalidation / Abandon: Stand down if an H1 candle closes above 0.6535 or if price prints a clear higher high above 0.6560 (structure shifts to bullish).
Justification: On H1, AUD/USD is in a clean downswing of lower highs and lower lows from ~0.662, with fresh breakdowns through 0.6510 and only shallow bounces. Selling a pullback to 0.6508 fades the S→R retest while aligning with session dynamics into NY close/Asia open. The SL 0.6532 sits beyond the last H1 LH stack to reduce stop-outs; TP 0.6448 targets the visible demand pocket around prior October lows. Confluence: bearish structure, S→R retest near the round number (0.6500), and volatility-fit distances (≈24-pip risk for ≈60-pip reward, ≥2R)

AUDUSD-LONG IDEAAUDUSD is in bullish trend according to higher time frame. I have market the structure on the chart. it took a deep retracement of 0.79 fib level according to daily time frame.1h structure is also broken to the upside. Now it is retracing back according to 1 hour time frame. There is a gap in between the recent leg up which will most probably be filled so mark your entries at the given point using the buy limit order. Do your own research and analysis before taking any trade.

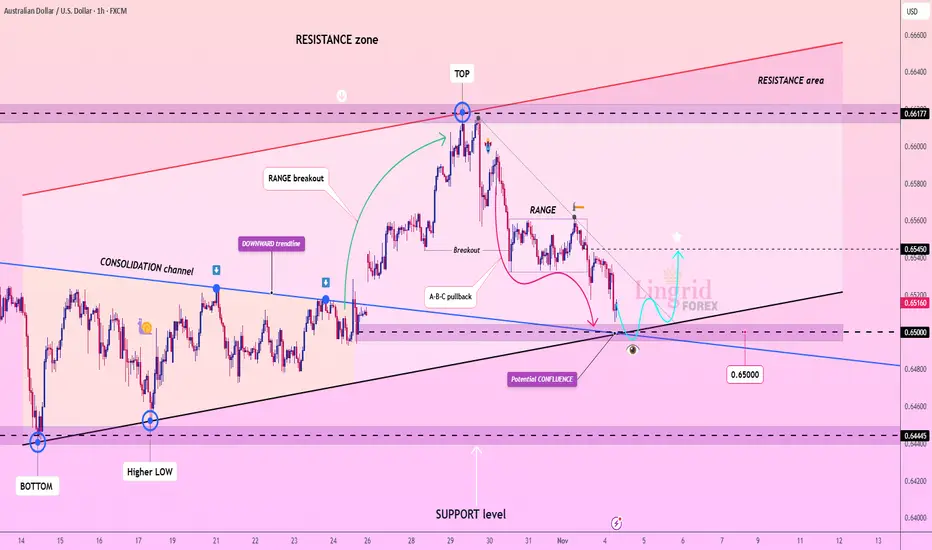
Lingrid | AUDUSD Psychological Support Long OpportunityThe price perfectly fulfilled my previous idea . FX:AUDUSD is testing the confluence support near 0.6500 after retracing from the 0.6617 resistance zone. Price action forms an A-B-C pullback pattern within a consolidation channel, suggesting the potential for a short-term rebound. Holding above 0.6500 could attract buyers aiming for 0.6545 resistance. Broader momentum supports a mild bullish recovery as long as this level remains intact.
⚠️ Risks:
Unexpected hawkish tone from the Federal Reserve could strengthen USD and cap recovery.
Weak Australian trade or employment data may renew downside pressure.
A sharp drop in commodity prices could undermine AUD sentiment.
If this idea resonates with you or you have your own opinion, traders, hit the comments. I’m excited to read your thoughts!
AUDUSD - 4H - Downtrend - SELL SET UPTrend Direction
AUDUSD is currently in a downtrend.
Price made a lower high and lower low, confirming bearish structure.
The recent push up is just a correction (pullback), not a trend reversal.
Stochastic is rising from oversold → confirming a pullback move in progress.
This means we do NOT buy here.
The correct move is to SELL the pullback.
Key Levels
Level / Role
0.6545 – 0.6555 / Sell Zone (previous support → new resistance)
0.6500 / Current price (NO ENTRY here)
0.6445 – 0.6455 / First Take Profit zone
0.6400 / Second Take Profit zone
✅ High-Probability Trade Setup
We wait for price to pull back into resistance and then sell.
SELL LIMIT: 0.6545 – 0.6555
STOP LOSS: 0.6590
TAKE PROFIT 1: 0.6450
TAKE PROFIT 2: 0.6400
Why This Works
Structure is bearish, so we trade with the trend.
Selling after retracement = institutional entry level.
SL is placed above structure → safe from stop hunts.
TP zones align with recent swing lows and liquidity zones.
This trade gives 1:3 to 1:4 Risk/Reward = Excellent.
Optional: If Price Doesn’t Pull Back
If price drops straight down, do NOT chase.
Wait again for another retracement before selling.
Discipline is where profits come from.

Market Analysis: AUD/USD SoftensMarket Analysis: AUD/USD Softens
AUD/USD is consolidating gains near 0.6550.
Important Takeaways for AUD/USD Analysis Today
- The Aussie Dollar started a downside correction from 0.6620 against the US Dollar.
- There was a break below a key bullish trend line with support at 0.6570 on the hourly chart of AUD/USD.
AUD/USD Technical Analysis
On the hourly chart of AUD/USD, the pair started a fresh increase from 0.6480. The Aussie Dollar was able to clear 0.6550 to move into a positive zone against the US Dollar.
There was also a move above 0.6580 and the 50-hour simple moving average. Finally, the pair tested 0.6600. A high was formed near 0.6617 and the pair is now correcting gains. There was a move below 0.6600 and a key bullish trend line with support at 0.6570.
The pair declined below the 50% Fib retracement level of the upward move from the 0.6478 swing low to the 0.6617 high. On the downside, initial support is near the 61.8% Fib retracement at 0.6530.
The next key area to watch could be 0.6510. If there is a downside break below 0.6510, the pair could extend its decline toward 0.6480. Any more losses might signal a move toward 0.6420.
On the upside, the AUD/USD chart indicates that the pair is now facing hurdles near 0.6560. The first key breakout zone might be 0.6595. An upside break above 0.6595 might send the pair further higher. The next stop for the bulls could be 0.6620. Any more gains could clear the path for a move toward 0.6720.
This article represents the opinion of the Companies operating under the FXOpen brand only. It is not to be construed as an offer, solicitation, or recommendation with respect to products and services provided by the Companies operating under the FXOpen brand, nor is it to be considered financial advice.

AUDUSD H4 | Bearish Reaction Off Key ResistanceAUDUSD is rising towards our sell entry, which is a pullback resistance level that aligns with the H4 Fair Value Gap and 38.2% Fibonacci retracement.
The stop loss a multi-swing high resistance level, at 0.6561, while the take profit is a swing low support level at 0.64662.
Stratos Markets Limited (tradu.com/uk ):
CFDs are complex instruments and come with a high risk of losing money rapidly due to leverage. 68% of retail investor accounts lose money when trading CFDs with this provider. You should consider whether you understand how CFDs work and whether you can afford to take the high risk of losing your money.
Stratos Europe Ltd (tradu.com/eu ):
CFDs are complex instruments and come with a high risk of losing money rapidly due to leverage. 70% of retail investor accounts lose money when trading CFDs with this provider. You should consider whether you understand how CFDs work and whether you can afford to take the high risk of losing your money.

AUD/USD 1-Hour Technical & Fundamental AnalysisAUD/USD 1-Hour Technical & Fundamental Analysis
The U.S. dollar gained strength as expectations for rate cuts by the Federal Reserve (Fed) were reduced, boosting demand for the greenback and putting pressure on the Australian dollar (AUD).
Meanwhile, softer Australian economic data and slowing growth expectations have weighed further on the AUD, creating a bearish bias for AUD/USD in the short term. Analysts also noted that the pair recently lost a key support level near 0.6500, signaling potential for continued downside momentum.
Technical Outlook
On the 1-hour timeframe, price clearly broke below the major support level at 0.65200, which has now turned into a major resistance zone.
As price continued to move lower, it also broke the next minor support at 0.65000, suggesting strong bearish pressure and liquidity hunting above that level.
However, after retesting the broken support, price failed to break above the previous major level, consolidating between the major and minor zones. Following this range movement, the market surged back below 0.65000, signaling renewed seller control.
Currently, price appears to be accumulating sell positions below the key level, with a potential liquidity grab above 0.6500 before resuming its downward move.
Trading Plan
🎯 Sell Stop: 0.64820
🛑 Stop Loss (SL): 0.64960
💰 Take Profit (TP): 0.64400
Risk–Reward Ratio: approximately 1:2
This setup requires patience and confirmation, ideally waiting for a liquidity hunt above the 0.6500 key level before triggering the sell stop order.
Alternative Scenario
On the flip side, Australia’s trade surplus widened significantly recently (exports up), which is a positive for AUD. If price breaks and sustains above the major resistance zone at 0.65200, it may invalidate the short setup and suggest a possible retracement toward higher liquidity areas near 0.65400–0.65500.
⚠️ Disclaimer
This analysis is provided for educational and informational purposes only and does not constitute financial advice. Trading involves risk, and past performance does not guarantee future results. Always conduct your own research and apply proper risk management.

AUDUSD-BUY-RangeMarket-TP 0.66055Hello,
AUDUSD will pull back in Range Market.
TP : 0.66055
SL : 0.647771
Good Luck
