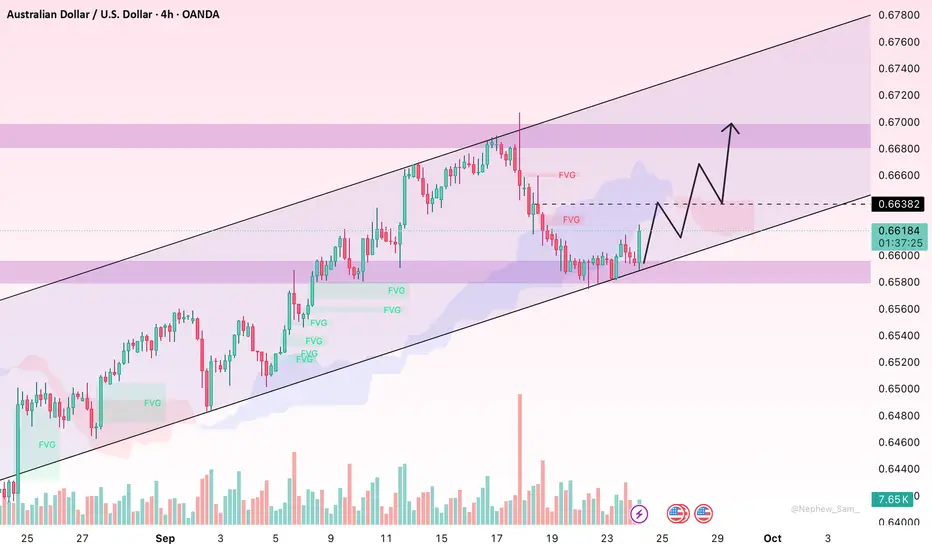
AUDUSD Is Going Up! Long!
Take a look at our analysis for AUDUSD.
Time Frame: 9h
Current Trend: Bullish
Sentiment: Oversold (based on 7-period RSI)
Forecast: Bullish
The market is approaching a key horizontal level 0.658.
Considering the today's price action, probabilities will be high to see a movement to 0.668.
P.S
Overbought describes a period of time where there has been a significant and consistent upward move in price over a period of time without much pullback.
Like and subscribe and comment my ideas if you enjoy them!
Trade ideas

AUDUSD BUY SCENARIOAfter of almost 2% falling from last week price start to fight back. It is possible the price reject the strong supply zone and rise to the next supply zone from last week.

AUDUSD Daily Forecast -Q3 | W39 | D25 | Y25|
📅 Q3 | W39 | D25 | Y25|
📊 AUDUSD Daily Forecast
🔍 Analysis Approach:
I’m applying Smart Money Concepts, focusing on:
Identifying Points of Interest on the Higher Time Frames (HTFs) 🕰️
Using those POIs to define a clear trading range 📐
Refining those zones on Lower Time Frames (LTFs) 🔎
Waiting for a Break of Structure (BoS) for confirmation ✅
This method allows me to stay precise, disciplined, and aligned with the market narrative, rather than chasing price.
💡 My Motto:
"Capital management, discipline, and consistency in your trading edge."
A positive risk-to-reward ratio, paired with a high win rate, is the backbone of any solid trading plan 📈🔐
⚠️ Losses?
They’re part of the mathematical game of trading 🎲
They don’t define you — they’re necessary, they happen, and we move forward 📊➡️
🙏 I appreciate you taking the time to review my Daily Forecast.
Stay sharp, stay consistent, and protect your capital
— FRNGT 🚀
FX:AUDUSD

AUDUSD(20250925)Today's AnalysisMarket News:
Chicago Fed President Goolsbee, a voting member of the FOMC this year, warned against a series of rate cuts, stating that he remains concerned about inflation and is unwilling to support a rate cut at the next meeting. San Francisco Fed President Mary Daly, however, believes that slowing economic growth and labor force growth, coupled with lower-than-expected inflation, may warrant further rate cuts.
Technical Analysis:
Today's Buy/Sell Levels:
0.6593
Support and Resistance Levels:
0.6646
0.6626
0.6614
0.6573
0.6560
0.6540
Trading Strategy:
If the market breaks above 0.6593, consider entering a buy position, with the first target price at 0.6614.
If the market breaks below 0.6573, consider entering a sell position, with the first target price at 0.6560

AUD/USD Bullish Reversal Setup – Support Bounce & Target 0.6706air & Timeframe
Pair: AUD/USD (Australian Dollar vs. US Dollar)
Timeframe: 2H (2-hour chart)
This means each candle represents 2 hours of price movement.
2. Market Structure
Trend Before Setup:
Price was in a downtrend, shown by the descending channel (red parallel lines).
Current Price: Around 0.6598
3. Key Levels
Support Zone:
0.6555 – 0.6583 (highlighted blue/grey box)
This is where price has been bouncing multiple times, showing demand (buyers).
Resistance / Target Zone:
0.6706 (blue line labeled “TARGET POINT”)
This is the next significant resistance, where traders may take profit.
4. Setup Explanation
This looks like a long (buy) setup:
Entry Zone: Near 0.6583 (support level).
Stop-Loss: Slightly below 0.6555 (to avoid fake breakouts).
Take-Profit Target: Around 0.6706
This gives a risk-reward ratio of about 3:1, which is a good setup.
5. Technical Pattern
Price seems to be breaking out of the downtrend channel, or at least testing the upper side of it.
If it successfully holds above the support and bounces, it signals a bullish reversal.
6. Trade Idea
📌 Bias: Bullish (Buy setup)
✅ Confirmation: Wait for price to respect the support zone (0.6583) and start moving upward with bullish candles.
🚫 Invalidation: If price breaks below 0.6555 and closes there, the setup fails (downtrend continues).
Summary
Scenario 1 (Bullish): Price respects support → move toward 0.6706 target.
Scenario 2 (Bearish): Price closes below 0.6555 → expect further downside toward 0.6520 or lower.

AUDUSD InsightHello subscribers, welcome back!
Please share your personal opinions in the comments. Don’t forget to boost and subscribe.
Key Points
- Fed Chair Jerome Powell stated that “in the short term, inflation risks are tilted to the upside while employment risks are tilted to the downside,” adding that “this is a difficult situation as risks exist on both sides, meaning there is no risk-free path.”
- U.S. Treasury Secretary Scott Bessent criticized Powell’s hawkish remarks, saying “Powell should have sent a signal of a 100–150bp rate cut.”
- Australia’s August CPI rose 3.0% YoY, accelerating from July’s 2.8%. Markets expect the RBA to hold rates at its September 30 policy meeting, followed by rate cuts in November and February next year.
Major Economic Events This Week
+September 25: U.S. GDP (Q2)
+September 26: U.S. PCE Price Index (August)
AUDUSD Chart Analysis
After a sharp rally, AUDUSD is experiencing a minor pullback around the 0.67000 level. A decline toward 0.65000 is anticipated during this correction, but the pair is expected to resume its upward momentum afterward. On a rebound, the projected peak is seen near the 0.69000 level.

AUDUSD OUTLOOKPrice closed below Wednesday low with consecutive candle moving in the same direction. making the down close candle that was supposed to send price higher an inversion order block. I expect price to open tomorrow in the London session and run higher inside the FVG then I will be selling in the US session to send price lower.

AUDUSD OUTLOOKPrice closed below Wednesday low with consecutive candle moving in the same direction. making the down close candle that was supposed to send price higher an inversion order block. I expect price to open tomorrow in the London session and run higher inside the FVG then I will be selling in the US session to send price lower.

AUDUSD — Bearish Flag Breakdown Points Lower📉 AUDUSD — Bearish Flag Breakdown Points Lower
AUDUSD has been trading inside a corrective flag after the strong selloff from the 0.6650s. Price has now broken down from that smaller rising channel, suggesting sellers may be regaining momentum.
Currently sitting at 0.6585, structure points to potential continuation toward the 0.6500 handle, with the recent flag breakdown adding confluence.
🔎 Technical Breakdown (2H timeframe):
Larger rising channel broke earlier in September ✅
Bearish flag formed as corrective pullback ✅
Breakdown confirms sellers stepping in ✅
Next downside liquidity sits around 0.6500–0.6510
🎯 Trade Setup:
Sell Zone: 0.6580–0.6600
Stop Loss: 0.6625 (above flag)
Take Profit: 0.6500 (next demand)
Risk-to-Reward: ≈ 1:3
⚠️ This reflects my personal view on AUDUSD, not financial advice.
💭 Do you think AUDUSD pushes cleanly into 0.6500, or will buyers defend the handle first? Let me know your view 👇
#AUDUSD #Forex #TradingView #PriceAction

AUDUSDAUDUSD is currently moving within a corrective wave structure. Price action suggests that Wave 4 correction may be nearing completion, setting up the potential for a bullish continuation into Wave 5. Traders should watch support zones closely and wait for a confirmed BUY signal before entering.

AUDUSD BuyDaily cycle and LIT cycle going hand in hand. Also, Currrent market structure is looking like accumulation and price has came into a supply/demand zone.

BUY AUDUSD 24.9.2025Confluence order: BUY at M15
Type of order: Limit order
Reason:
- The current top is not touching anything, expected to rise to the TOP of its.
Note:
- Management of money carefully at the that point (0,66012)
Set up entry:
- Entry buy at 0,65939
- SL at 0,65866
- TP1: 0,66012 (~1R)
- TP2: 0,66152 (~3R)
Trading Method: Price action (No indicator, only trend and candles)

Australian Dollar Strengthens Following Inflation DataAustralian Dollar Strengthens Following Inflation Data
According to Forex Factory, Australia’s CPI index came in higher than expected: analysts had forecast an annual rate of 2.9%, while the actual figure was 3.0% (previous value: 2.8%).
This led to a strengthening of the Australian dollar, as the Reserve Bank of Australia (RBA) may adopt a more cautious stance in its monetary policy easing process (in August it cut the cash rate from 3.85% to 3.60%, following a peak of 4.35% in 2024).
On the other hand, traders are weighing the impact of yesterday’s remarks from the Chair of the Federal Reserve, who adopted a cautious tone. According to Powell, the Fed must strike a balance between persistent inflation and a weakening labour market, describing the situation as “challenging”.
AUD/USD Technical Analysis
Since the end of last month, AUD/USD has been trading within an ascending channel (shown in blue).
From a bearish perspective:
→ the AUD/USD chart shows signs of aggressive selling above the 0.66700 level — the price fell on wide candlesticks with long upper wicks;
→ if the move from A→B is considered the dominant impulse, the current rise in AUD/USD appears to be an interim recovery — resistance may come from the 50% level and other Fibonacci retracement levels;
→ as shown in red, the chart provides (albeit not very clear) grounds for constructing a descending channel. It is possible that its upper boundary could act as resistance.
From a bullish perspective:
→ the ascending channel remains intact, and a drop to the lower boundary could be followed by a resumption of the upward trend;
→ former resistance at 0.65600 now acts as support;
→ if the move from 0→A is considered the dominant impulse, the fall from A→B could be viewed as a normal correction.
Taking the above into account, both perspectives appear justified, so a consolidation around current levels can be considered the baseline scenario. At the same time, upcoming news from the United States may significantly influence further market dynamics:
→ tomorrow at 15:30 (GMT+3) — GDP and jobless claims data;
→ the day after tomorrow at the same time — Core PCE Price Index.
This article represents the opinion of the Companies operating under the FXOpen brand only. It is not to be construed as an offer, solicitation, or recommendation with respect to products and services provided by the Companies operating under the FXOpen brand, nor is it to be considered financial advice.

AUDUSD strengthens rebound from support following Aus. CPI dataFollowing stronger-than-expected inflation data overnight, the AUD/USD received a reasonably strong bid. As shown from the chart below, the recent upside move came on the heels of a rebound from 1M support at US$0.6578 in the shape of a bullish hammer pattern.
Bolstered by a nearby 1Y support level at US$0.6548, and the underlying trend pointing higher, further buying from current support could be seen. This may prompt a test of 6M resistance at US$0.6679, with a subsequent break opening the door to a 1Y resistance from US$0.6808.
Ultimately, then, this remains a buyers’ market for the time being with room to push north.
Written by the FP Markets Research Team

AUDUSD H1 | Bullish bounceThe Aussie (AUD/USD) is falling towards the buy entry which is a pullback support and could bounce from this level to the upside.
Buy entry is at 0.6607, which is a pullback support.
Stop loss is at 0.6582, which is a pullback support.
Take profit is at 0.6654, which is an overlap resistance that lines up with the 61.8% Fibonacci retracement.
High Risk Investment Warning
Trading Forex/CFDs on margin carries a high level of risk and may not be suitable for all investors. Leverage can work against you.
Stratos Markets Limited (tradu.com ):
CFDs are complex instruments and come with a high risk of losing money rapidly due to leverage. 65% of retail investor accounts lose money when trading CFDs with this provider. You should consider whether you understand how CFDs work and whether you can afford to take the high risk of losing your money.
Stratos Europe Ltd (tradu.com ):
CFDs are complex instruments and come with a high risk of losing money rapidly due to leverage. 66% of retail investor accounts lose money when trading CFDs with this provider. You should consider whether you understand how CFDs work and whether you can afford to take the high risk of losing your money.
Stratos Global LLC (tradu.com ):
Losses can exceed deposits.
Please be advised that the information presented on TradingView is provided to Tradu (‘Company’, ‘we’) by a third-party provider (‘TFA Global Pte Ltd’). Please be reminded that you are solely responsible for the trading decisions on your account. There is a very high degree of risk involved in trading. Any information and/or content is intended entirely for research, educational and informational purposes only and does not constitute investment or consultation advice or investment strategy. The information is not tailored to the investment needs of any specific person and therefore does not involve a consideration of any of the investment objectives, financial situation or needs of any viewer that may receive it. Kindly also note that past performance is not a reliable indicator of future results. Actual results may differ materially from those anticipated in forward-looking or past performance statements. We assume no liability as to the accuracy or completeness of any of the information and/or content provided herein and the Company cannot be held responsible for any omission, mistake nor for any loss or damage including without limitation to any loss of profit which may arise from reliance on any information supplied by TFA Global Pte Ltd.
The speaker(s) is neither an employee, agent nor representative of Tradu and is therefore acting independently. The opinions given are their own, constitute general market commentary, and do not constitute the opinion or advice of Tradu or any form of personal or investment advice. Tradu neither endorses nor guarantees offerings of third-party speakers, nor is Tradu responsible for the content, veracity or opinions of third-party speakers, presenters or participants.

AUDUSD Daily Forecast -Q3 | W39 | D24 | Y25|📅 Q3 | W39 | D24 | Y25|
📊 AUDUSD Daily Forecast
🔍 Analysis Approach:
I’m applying Smart Money Concepts, focusing on:
Identifying Points of Interest on the Higher Time Frames (HTFs) 🕰️
Using those POIs to define a clear trading range 📐
Refining those zones on Lower Time Frames (LTFs) 🔎
Waiting for a Break of Structure (BoS) for confirmation ✅
This method allows me to stay precise, disciplined, and aligned with the market narrative, rather than chasing price.
💡 My Motto:
"Capital management, discipline, and consistency in your trading edge."
A positive risk-to-reward ratio, paired with a high win rate, is the backbone of any solid trading plan 📈🔐
⚠️ Losses?
They’re part of the mathematical game of trading 🎲
They don’t define you — they’re necessary, they happen, and we move forward 📊➡️
🙏 I appreciate you taking the time to review my Daily Forecast.
Stay sharp, stay consistent, and protect your capital
— FRNGT 🚀
FX:AUDUSD

AUDUSD Daily Forecast -Q3 | W39 | D23 | Y25|📅 Q3 | W39 | D23 | Y25|
📊 AUDUSD Daily Forecast
🔍 Analysis Approach:
I’m applying Smart Money Concepts, focusing on:
Identifying Points of Interest on the Higher Time Frames (HTFs) 🕰️
Using those POIs to define a clear trading range 📐
Refining those zones on Lower Time Frames (LTFs) 🔎
Waiting for a Break of Structure (BoS) for confirmation ✅
This method allows me to stay precise, disciplined, and aligned with the market narrative, rather than chasing price.
💡 My Motto:
"Capital management, discipline, and consistency in your trading edge."
A positive risk-to-reward ratio, paired with a high win rate, is the backbone of any solid trading plan 📈🔐
⚠️ Losses?
They’re part of the mathematical game of trading 🎲
They don’t define you — they’re necessary, they happen, and we move forward 📊➡️
🙏 I appreciate you taking the time to review my Daily Forecast.
Stay sharp, stay consistent, and protect your capital
— FRNGT 🚀
FX:AUDUSD

AUD/USD: Mild Uptrend and Key Levels to WatchHello everyone,
AUD/USD is currently maintaining a mild uptrend after breaking above 0.6590 and holding steady above 0.6600. On the chart, Fair Value Gaps (FVGs) appear as imbalances in price, which could act as areas where the market may revisit before resuming the trend.
From a technical standpoint, price is trading above the Ichimoku cloud, suggesting that the bullish bias remains intact. When price stays above the cloud, the market typically continues higher, with the cloud acting as dynamic support during pullbacks. Immediate support is seen at 0.6600 and 0.6580, while nearby resistance sits at 0.6620–0.6630. A breakout above this zone could open the way towards 0.6650 and potentially 0.6700. Trading volume has also increased during upward moves, signalling that buying momentum is still dominant.
On the news side, the Reserve Bank of Australia (RBA) recently kept interest rates unchanged, though markets anticipate potential adjustments in the coming months. This remains a key driver for the AUD. Meanwhile, US CPI data and the Federal Reserve’s policy stance are still the primary factors shaping USD direction. In addition, global economic conditions and trade tensions could contribute to further volatility in this pair.
Given the current picture, the preferred scenario is still to the upside. If AUD/USD breaks above 0.6630, the next targets could be 0.6650 and 0.6700. On the other hand, if price pulls back to test 0.6600–0.6580, it could provide a solid buying opportunity as long as supportive factors remain in place.
Wishing you successful trades and effective risk management!
AUDUSD SELL OPPORTUNITY A selling opportunity waiting at the key level above.
Entry: 1. 66400
SL: 1.66600
Tp: 1.65800
Comment your opinion pls


i am going for Long ( BUY) AUD USD on monthly timeframe (Vihaan)i am going for Long ( BUY) AUD USD on monthly timeframe because of strong Support on monthly

Is the Aussie Dollar Ready to Jump?The Australian Dollar has been grinding higher since April, and some traders may think it’s ready to start jumping.
The first pattern on today’s chart is the July highs between roughly 0.658 and 0.66. AUDUSD began September by rallying above that price zone and is now trying to hold it. That may suggest old resistance has become new support.
Second, Monday’s session ended higher after probing lower. The resulting “hammer” candlestick is a potentially bullish pattern. The currency also held its rising 21-day exponential moving average (EMA).
Third, the 8-day EMA is above the 21-day EMA and MACD recently surged. Those signals may reflect increased short-term bullishness.
Finally, the 50-day simple moving average (SMA) crossed above the 200-day SMA in June. The 100-day crossed above the 200-day SMA in July. That configuration, with faster SMAs above slower SMAs, is potentially consistent with an emerging uptrend.
TradeStation has, for decades, advanced the trading industry, providing access to stocks, options and futures. If you're born to trade, we could be for you. See our Overview for more.
Past performance, whether actual or indicated by historical tests of strategies, is no guarantee of future performance or success. There is a possibility that you may sustain a loss equal to or greater than your entire investment regardless of which asset class you trade (equities, options or futures); therefore, you should not invest or risk money that you cannot afford to lose. Online trading is not suitable for all investors. View the document titled Characteristics and Risks of Standardized Options at www.TradeStation.com . Before trading any asset class, customers must read the relevant risk disclosure statements on www.TradeStation.com . System access and trade placement and execution may be delayed or fail due to market volatility and volume, quote delays, system and software errors, Internet traffic, outages and other factors.
Securities and futures trading is offered to self-directed customers by TradeStation Securities, Inc., a broker-dealer registered with the Securities and Exchange Commission and a futures commission merchant licensed with the Commodity Futures Trading Commission). TradeStation Securities is a member of the Financial Industry Regulatory Authority, the National Futures Association, and a number of exchanges.
TradeStation Securities, Inc. and TradeStation Technologies, Inc. are each wholly owned subsidiaries of TradeStation Group, Inc., both operating, and providing products and services, under the TradeStation brand and trademark. When applying for, or purchasing, accounts, subscriptions, products and services, it is important that you know which company you will be dealing with. Visit www.TradeStation.com for further important information explaining what this means.

AUDUSD Is Going Down! Sell!
Here is our detailed technical review for AUDUSD.
Time Frame: 1D
Current Trend: Bearish
Sentiment: Overbought (based on 7-period RSI)
Forecast: Bearish
The market is on a crucial zone of supply 0.661.
The above-mentioned technicals clearly indicate the dominance of sellers on the market. I recommend shorting the instrument, aiming at 0.648 level.
P.S
Overbought describes a period of time where there has been a significant and consistent upward move in price over a period of time without much pullback.
Like and subscribe and comment my ideas if you enjoy them!
