AUDUSD H4 | Reversal signal at swing high resistanceThe Aussie (AUD/USD) is rising towards the sell entry, which acts as a swing high resistance that aligns with the 78.6% Fibonacci projection and could reverse from this level to the downside.
Sell entry is at 0.6620, which is a swing high resistance that lines up with the 78.6% Fibonacci projection.
Stop loss is at 0.6638, a resistance that aligns with the 100% Fibonacci projection.
Take profit is at 0.6558, which is a pullback support.
High Risk Investment Warning
Trading Forex/CFDs on margin carries a high level of risk and may not be suitable for all investors. Leverage can work against you.
Stratos Markets Limited (tradu.com ):
CFDs are complex instruments and come with a high risk of losing money rapidly due to leverage. 65% of retail investor accounts lose money when trading CFDs with this provider. You should consider whether you understand how CFDs work and whether you can afford to take the high risk of losing your money.
Stratos Europe Ltd (tradu.com ):
CFDs are complex instruments and come with a high risk of losing money rapidly due to leverage. 66% of retail investor accounts lose money when trading CFDs with this provider. You should consider whether you understand how CFDs work and whether you can afford to take the high risk of losing your money.
Stratos Global LLC (tradu.com ):
Losses can exceed deposits.
Please be advised that the information presented on TradingView is provided to Tradu (‘Company’, ‘we’) by a third-party provider (‘TFA Global Pte Ltd’). Please be reminded that you are solely responsible for the trading decisions on your account. There is a very high degree of risk involved in trading. Any information and/or content is intended entirely for research, educational and informational purposes only and does not constitute investment or consultation advice or investment strategy. The information is not tailored to the investment needs of any specific person and therefore does not involve a consideration of any of the investment objectives, financial situation or needs of any viewer that may receive it. Kindly also note that past performance is not a reliable indicator of future results. Actual results may differ materially from those anticipated in forward-looking or past performance statements. We assume no liability as to the accuracy or completeness of any of the information and/or content provided herein and the Company cannot be held responsible for any omission, mistake nor for any loss or damage including without limitation to any loss of profit which may arise from reliance on any information supplied by TFA Global Pte Ltd.
The speaker(s) is neither an employee, agent nor representative of Tradu and is therefore acting independently. The opinions given are their own, constitute general market commentary, and do not constitute the opinion or advice of Tradu or any form of personal or investment advice. Tradu neither endorses nor guarantees offerings of third-party speakers, nor is Tradu responsible for the content, veracity or opinions of third-party speakers, presenters or participants.
Trade ideas

AUDUSD Daily Forecast Q3 | W37 | D9 | Y25📊 AUDUSD Daily Forecast Q3 | W37 | D9 | Y25
🔎 AUDUSD Focus:
Watching for a bearish 4H close at our POI. Eyes are on shorts — but only when timing aligns.
Plan: wait for the 4H bearish close → pullback into POI above → 1M break of structure to confirm entry.
Discipline first, execution second.
🔍 Analysis Approach:
I’m applying Smart Money Concepts, focusing on:
Identifying Points of Interest on the Higher Time Frames (HTFs) 🕰️
Using those POIs to define a clear trading range 📐
Refining those zones on Lower Time Frames (LTFs) 🔎
Waiting for a Break of Structure (BoS) for confirmation ✅
This method allows me to stay precise, disciplined, and aligned with the market narrative, rather than chasing price.
💡 My Motto:
"Capital management, discipline, and consistency in your trading edge."
A positive risk-to-reward ratio, paired with a high win rate, is the backbone of any solid trading plan 📈🔐
⚠️ Losses?
They’re part of the mathematical game of trading 🎲
They don’t define you — they’re necessary, they happen, and we move forward 📊➡️
🙏 I appreciate you taking the time to review my Daily Forecast.
Stay sharp, stay consistent, and protect your capital
— FRNGT 🚀
FX:AUDUSD

AUD/USDI think the price will make another double bottom then start to sell from resistance 0.66253 once price pulls back from the green trendline I am buying .

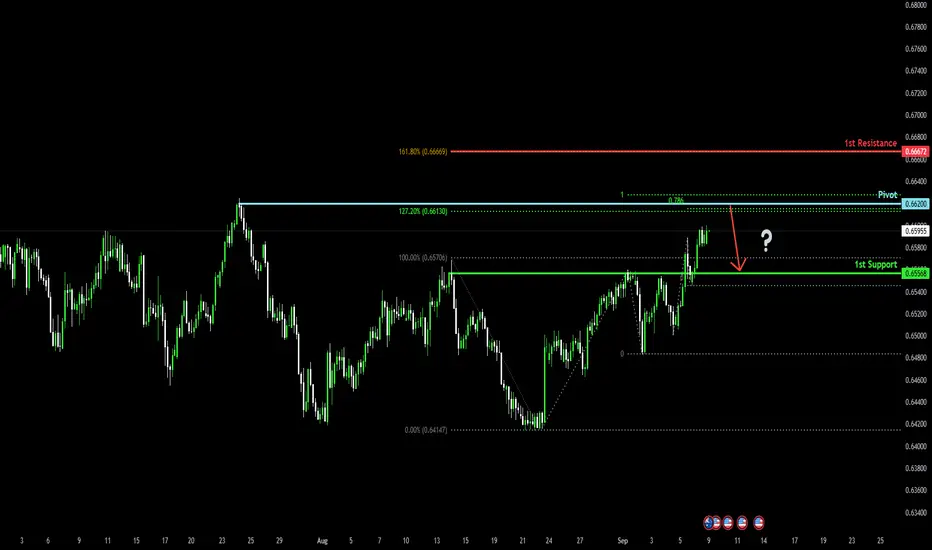
Approaching Fibonacci confluence level?The Aussie (AUD/USD) is rising towards the pivot, which acts as a swing high resistance and could reverse to the overlap support.
Pivot: 0.6620
1st Support: 0.6556
1st Resistance: 0.6667
Disclaimer:
The above opinions given constitute general market commentary and do not constitute the opinion or advice of IC Markets or any form of personal or investment advice.
Any opinions, news, research, analyses, prices, other information, or links to third-party sites contained on this website are provided on an "as-is" basis, are intended only to be informative, is not an advice nor a recommendation, nor research, or a record of our trading prices, or an offer of, or solicitation for a transaction in any financial instrument and thus should not be treated as such. The information provided does not involve any specific investment objectives, financial situation and needs of any specific person who may receive it. Please be aware, that past performance is not a reliable indicator of future performance and/or results. Past Performance or Forward-looking scenarios based upon the reasonable beliefs of the third-party provider are not a guarantee of future performance. Actual results may differ materially from those anticipated in forward-looking or past performance statements. IC Markets makes no representation or warranty and assumes no liability as to the accuracy or completeness of the information provided, nor any loss arising from any investment based on a recommendation, forecast or any information supplied by any third-party.
AUDUSD long to 0.66500soft U.S. economic data and heightened expectations of Federal Reserve rate cuts, which have weakened the dollar and supported the Australian currency.
Australian economic resilience highlighted by stronger-than-expected Q2 GDP and improving market sentiment ahead of key domestic surveys are reinforcing the buying momentum.

AUD USD H1A long opportunity has occurred on AUDUSD as price is pulling back to a nice support which happens to be the 0.382 fib level as well.
Confluences for the trade:
- Price in an uptrend making higher highs and higher lows.
- Price pulling back to the 0.382 fib
- Price reacting off a previous support
- Price above 50 EMA
- Price in sync with RSI

$AUDUSD Buyers are regrouping about to push the pair to the .664The buyers are on the move, about to push the pair higher. Supported by stronger commodities and a softer U.S. dollar, the pair created a new support area around .06565. Any pullback to this area will confirm further buying, pushing the pair to the .6640 area, then back down to the new support area.

AudUsd Trade IdeaIts been a minute since I posted one of these. I just took some shorts on AU with price respecting the previous high and price shifting to the downside. If all goes well we could expect price to crash back below to the major support level where price could potentially continue ranging. Looking for a 1:3rr on this set up. We'll see how it goes.

Evening Forecasting on AUD/USD 8/9/2025Hello, this is my evening forecasting on AUDUSD. Curious for your feedback

AUDUSDConsider entering long positions as the trend continues upwards, but monitor the resistance level near 0.65926. Place a stop-loss below recent support around 0.65640 to manage downside risk. Watch for volatility spikes that could indicate a change in the current trend. If momentum fades, consider reversing to short positions if bearish patterns form around resistance levels.

AUDUSD uptrend resistance at 0.6600The AUDUSD remains in a bullish trend, with recent price action showing signs of a breakout within the broader uptrend.
Support Zone: 0.6500 – a key level from previous consolidation. Price is currently testing or approaching this level.
A bullish rebound from 0.6500 would confirm ongoing upside momentum, with potential targets at:
0.6600 – initial resistance
0.6625 – psychological and structural level
0.6650 – extended resistance on the longer-term chart
Bearish Scenario:
A confirmed break and daily close below 0.6500 would weaken the bullish outlook and suggest deeper downside risk toward:
0.6485 – minor support
0.6460 – stronger support and potential demand zone
Outlook:
Bullish bias remains intact while the AUDUSD holds above 0.6500. A sustained break below this level could shift momentum to the downside in the short term.
This communication is for informational purposes only and should not be viewed as any form of recommendation as to a particular course of action or as investment advice. It is not intended as an offer or solicitation for the purchase or sale of any financial instrument or as an official confirmation of any transaction. Opinions, estimates and assumptions expressed herein are made as of the date of this communication and are subject to change without notice. This communication has been prepared based upon information, including market prices, data and other information, believed to be reliable; however, Trade Nation does not warrant its completeness or accuracy. All market prices and market data contained in or attached to this communication are indicative and subject to change without notice.

Sharp Rejection+Fair Value Gap = Strong AUD/USD Support (0.6493)On AUD/USD, a sharp rejection of lower prices has formed a significant support at 0.6493. The Volume Profile shows a clear volume cluster inside the rejection, where buyers became active and turned the sell-off around.The plan is to wait for a pullback to 0.6493 and look for a long entry from there.

AUDUSD: Expecting Bearish Movement! Here is Why:
Balance of buyers and sellers on the AUDUSD pair, that is best felt when all the timeframes are analyzed properly is shifting in favor of the sellers, therefore is it only natural that we go short on the pair.
Disclosure: I am part of Trade Nation's Influencer program and receive a monthly fee for using their TradingView charts in my analysis.
❤️ Please, support our work with like & comment! ❤️

AUD/USD Rally Attempts, Will Buyers Stay in Charge?Market Analysis: AUD/USD Rally Attempts, Will Buyers Stay in Charge?
AUD/USD started a decent increase above 0.6580.
Important Takeaways for AUD USD Analysis Today
- The Aussie Dollar started a decent increase above 0.6545 against the US Dollar.
- There was a break above a contracting triangle with resistance at 0.6530 on the hourly chart of AUD/USD.
AUD/USD Technical Analysis
On the hourly chart of AUD/USD at FXOpen, the pair started a fresh increase from 0.6500. The Aussie Dollar was able to clear 0.6520 to move into a positive zone against the US Dollar.
The bulls cleared a contracting triangle with resistance at 0.6530. There was a close above the 0.6550 resistance and the 50-hour simple moving average. Finally, the pair tested 0.6585. A high was formed near 0.6588 and the pair recently started a consolidation phase.
There was a move below the 23.6% Fib retracement level of the upward move from the 0.6501 swing low to the 0.6588 high. On the upside, the AUD/USD chart indicates that the pair is now facing resistance near 0.6585.
An upside break above 0.6585 might send the pair further higher. The next stop is near 0.6640. Any more gains could clear the path for a move toward the 0.6700 handle.
On the downside, initial support is near the 50% Fib retracement at 0.6545. The next area of interest could be near the 50-hour simple moving average at 0.6535.
If there is a downside break below 0.6535, the pair could extend its decline toward the 0.6500 zone. Any more losses might signal a move toward 0.6485.
This article represents the opinion of the Companies operating under the FXOpen brand only. It is not to be construed as an offer, solicitation, or recommendation with respect to products and services provided by the Companies operating under the FXOpen brand, nor is it to be considered financial advice.

AUDUSD Daily Forecast Q3 | W37 | D8 | Y25📊 AUDUSD Daily Forecast Q3 | W37 | D8 | Y25
🔍 Analysis Approach:
I’m applying Smart Money Concepts, focusing on:
Identifying Points of Interest on the Higher Time Frames (HTFs) 🕰️
Using those POIs to define a clear trading range 📐
Refining those zones on Lower Time Frames (LTFs) 🔎
Waiting for a Break of Structure (BoS) for confirmation ✅
This method allows me to stay precise, disciplined, and aligned with the market narrative, rather than chasing price.
💡 My Motto:
"Capital management, discipline, and consistency in your trading edge."
A positive risk-to-reward ratio, paired with a high win rate, is the backbone of any solid trading plan 📈🔐
⚠️ Losses?
They’re part of the mathematical game of trading 🎲
They don’t define you — they’re necessary, they happen, and we move forward 📊➡️
🙏 I appreciate you taking the time to review my Daily Forecast.
Stay sharp, stay consistent, and protect your capital
— FRNGT 🚀

AUDUSD longFundamentals
Still looking for longs on AU
AUD on trade surplus showing resilience even as commodity demands drop
USD still under pressure as cut's being priced in
Technical
AU can reach target 0.66, 0.67. as of now I'm targeting 0.665
There are two important levels to look for buys
@ 0.6540 and @ 0.6518

AUDUSD Given the current range-bound movement, a trader could capitalize by exploiting the price oscillations within this zone. Enter long positions near the lower boundary of the range around 0.6415 to 0.6388 and consider short positions as price approaches the upper boundary around 0.6625. A tight stop-loss just outside the entry levels can help mitigate risk, aiming for a favorable risk-reward ratio. Monitor for a breakout to adjust strategies accordingly, as breakouts could signify the beginning of a new trend.

check the trend Considering the price behavior in the current resistance range, possible scenarios have been identified. It is expected that the upward trend will continue.

Audusd As we can see we have price on a uptrend on a weekly daily and 4h so we are waiting for a retracment to buy

Lingrid | AUDUSD Bullish Continuation Potential The price perfectly fulfilled my previous idea . OANDA:AUDUSD is consolidating inside an upward channel after rejecting resistance near 0.6600. The structure shows a corrective pullback into the 0.6515–0.6520 zone while holding above the rising support trendline. If buyers defend this zone, price could extend back toward 0.6560. Momentum remains bullish as long as the higher-low structure is respected.
📉 Key Levels
Buy trigger: Rebound from 0.6520 support
Buy zone: 0.6515–0.6520
Target: 0.6560
Invalidation: Break below 0.6482
💡 Risks
A breakdown below 0.6482 would signal bearish reversal against the channel.
USD macro data surprises may trigger volatility against the bias.
Global risk sentiment shifts could weaken AUD momentum.
If this idea resonates with you or you have your own opinion, traders, hit the comments. I’m excited to read your thoughts!

Strong buy audusdFirst possible strong buy when Reached at our selling area then sell with confirmation

AUDUSD Will Move Higher! Buy!
Here is our detailed technical review for AUDUSD.
Time Frame: 1D
Current Trend: Bullish
Sentiment: Oversold (based on 7-period RSI)
Forecast: Bullish
The market is testing a major horizontal structure 0.655.
Taking into consideration the structure & trend analysis, I believe that the market will reach 0.662 level soon.
P.S
Please, note that an oversold/overbought condition can last for a long time, and therefore being oversold/overbought doesn't mean a price rally will come soon, or at all.
Disclosure: I am part of Trade Nation's Influencer program and receive a monthly fee for using their TradingView charts in my analysis.
Like and subscribe and comment my ideas if you enjoy them!

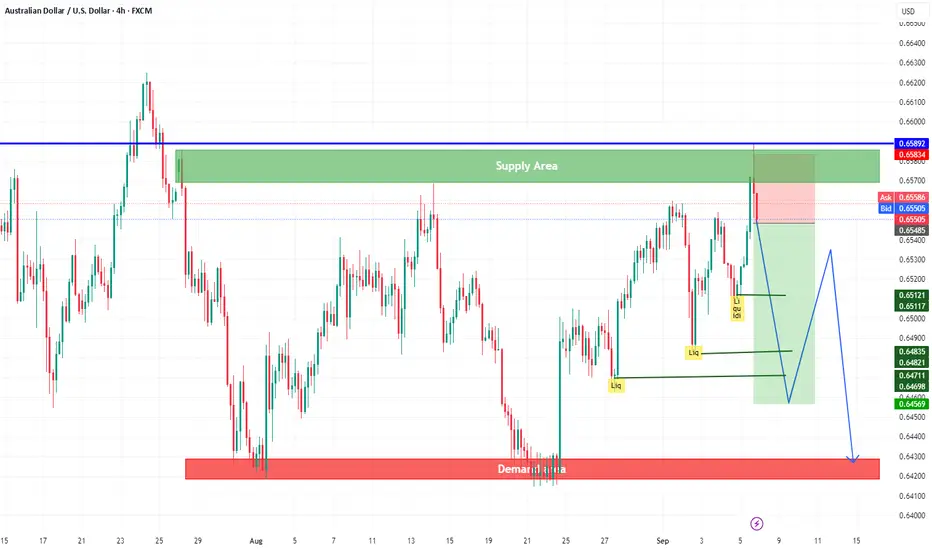
AUDUSD bearishWe have 3 liquidity areas, not sweep, and the price rebounds from the supply area to continue bearish and sweep the liquidity.