AUDUSD: Uptrend SupportedCurrently, AUDUSD is showing a steady uptrend, with the price staying above important support levels and gradually moving towards the next resistance levels. The chart shows a break of the 0.64700 resistance, which opens up further growth potential. The nearest target for this pair is 0.65600, and if the trend continues, AUDUSD may push further upwards.
Fundamental Analysis: After Fed Chairman Jerome Powell's remarks, the weakening of the USD has given more strength to the AUD. If the core PCE index on August 29 comes in lower than expected, this could result in a less aggressive rate hike, weakening the USD, while both gold and AUD continue to rise.
Trading Strategy: If the price of AUDUSD breaks through the 0.64700 resistance zone, consider opening a buy position with a target at 0.65600. To protect the trade, set a stop-loss below the 0.64700 support level. In case of a price correction, the 0.64700 level remains an important point to monitor for a continuation of the uptrend.
With supporting technical and fundamental factors, the uptrend of AUDUSD is likely to continue in the near future. Keep an eye on economic news and adjust strategies accordingly to take advantage of this upward momentum.
Trade ideas


Australian CPI To Keep The RBA Cautious On RatesAustralia's monthly headline inflation metrics were all above expectations. While the basing effect and likely one-off electricity costs are a factor, it doesn't explain everything. I look at some of the CPI report's internals and outline what I think this means for AUD/USD.
Matt Simpson, Market Analyst at Forex.com and City Index

Long AUDUSD- AUD/USD – Buy
- Why: AUD boosted by hot CPI & strong construction data; RBA cut repricing; USD pressured by Fed cut bets & political risk.
- Macro/futures bias: AUD → short-term bullish, USD moderate bearish.

AUDUSD H4 | Bearish dropThe Aussie (AUD/USD) is reacting off the sell entry which is a pullback resistance and could drop from this level to the take profit.
Sell entry is at 0.6492, which is a pullback resistance.
Stop loss is at 0.6531, which is a pullback resistance that is slightly below the 78.6% Fibonacci retracement.
Take profit is at 0.6452, which is a pullback support that aligns with the 61.8% Fibonacci retracement.
High Risk Investment Warning
Trading Forex/CFDs on margin carries a high level of risk and may not be suitable for all investors. Leverage can work against you.
Stratos Markets Limited (tradu.com ):
CFDs are complex instruments and come with a high risk of losing money rapidly due to leverage. 65% of retail investor accounts lose money when trading CFDs with this provider. You should consider whether you understand how CFDs work and whether you can afford to take the high risk of losing your money.
Stratos Europe Ltd (tradu.com ):
CFDs are complex instruments and come with a high risk of losing money rapidly due to leverage. 66% of retail investor accounts lose money when trading CFDs with this provider. You should consider whether you understand how CFDs work and whether you can afford to take the high risk of losing your money.
Stratos Global LLC (tradu.com ):
Losses can exceed deposits.
Please be advised that the information presented on TradingView is provided to Tradu (‘Company’, ‘we’) by a third-party provider (‘TFA Global Pte Ltd’). Please be reminded that you are solely responsible for the trading decisions on your account. There is a very high degree of risk involved in trading. Any information and/or content is intended entirely for research, educational and informational purposes only and does not constitute investment or consultation advice or investment strategy. The information is not tailored to the investment needs of any specific person and therefore does not involve a consideration of any of the investment objectives, financial situation or needs of any viewer that may receive it. Kindly also note that past performance is not a reliable indicator of future results. Actual results may differ materially from those anticipated in forward-looking or past performance statements. We assume no liability as to the accuracy or completeness of any of the information and/or content provided herein and the Company cannot be held responsible for any omission, mistake nor for any loss or damage including without limitation to any loss of profit which may arise from reliance on any information supplied by TFA Global Pte Ltd.
The speaker(s) is neither an employee, agent nor representative of Tradu and is therefore acting independently. The opinions given are their own, constitute general market commentary, and do not constitute the opinion or advice of Tradu or any form of personal or investment advice. Tradu neither endorses nor guarantees offerings of third-party speakers, nor is Tradu responsible for the content, veracity or opinions of third-party speakers, presenters or participants.

AUDUSD InsightHello to all subscribers,
Please share your personal opinions in the comments. Don’t forget to like and subscribe.
Key Points
- U.S. President Donald Trump sent a dismissal notice to Federal Reserve Governor Lisa Cook. In response, Cook stated that “there is no legal basis for this, and he does not have such authority,” announcing legal action. The Federal Reserve also issued a statement indirectly supporting Cook.
- French Prime Minister François Bayrou announced that he will request a confidence vote in parliament on September 8 to secure momentum for fiscal tightening. However, with major opposition parties declaring no confidence, the prevailing view is that the government is likely to collapse.
This Week’s Major Economic Events
+ August 28: U.S. Q2 GDP
+ August 29: Germany August Consumer Price Index, U.S. July Personal Consumption Expenditures (PCE) Price Index
AUDUSD Chart Analysis
The pair is still showing a gradual upward trend within the channel. As long as it does not break below the previous low at the 0.64000 level, the bullish outlook remains intact, with long-term potential to rise toward the 0.69000 level. However, if it breaks below 0.64000, there is a high possibility of a decline toward the 0.62000 level.

AUDUSD Wave Analysis – 26 August 2025- AUDUSD reversed from key support level 0.6400
- Likely to rise to resistance level 0.6565
AUDUSD currency pair recently reversed up from the key support level 0.6400 (which has been reversing the price from May) standing near the lower daily Bollinger Band.
The upward reversal from the support level 0.6400 created the daily Japanese candlesticks reversal pattern Morning Star Doji.
AUDUSD currency pair can be expected to rise to the next resistance level 0.6565 (top of the previous minor correction ii).

AUD/USD Weekly Outlook: RBA Minutes Weigh on Rate ForecastTrend: Bearish correction after RBA dovish signals
Current Price: 0.6500
⸻
Bearish Scenario
• Entry: SELL STOP 0.6435
• Targets: 0.6348, 0.6287
• Stop-Loss: 0.6500
Bullish Scenario
• Entry: BUY STOP 0.6555
• Targets: 0.6622, 0.6653
• Stop-Loss: 0.6410
⸻
Key Levels
• Resistance: 0.6550, 0.6622, 0.6653
• Support: 0.6439, 0.6348, 0.6287
⸻
Indicators
• Bollinger Bands: turning down
• MACD: negative zone
• Stochastic: moving up, nearing overbought
⸻
📌 Break below 0.6439 confirms continuation to 0.6348 → 0.6287.
Recovery above 0.6550 shifts focus to 0.6622 → 0.6653.
⸻

AUDUSD Strong sell opportunity above he 1D MA50.The AUDUSD pair is rebounding after almost touching the 3-month Higher Lows trend-line and is about to break above the 0.618 Fibonacci retracement level.
Any long-term upside attempt is restricted by the presence of the Lower Highs trend-line, with the last sell signal coming above the 1D MA50.
As a result, we are waiting to sell this and target the Inner Lower Lows at 0.64150.
Pay close attention also to the 1D RSI's top Channel for a sell.
-------------------------------------------------------------------------------
** Please LIKE 👍, FOLLOW ✅, SHARE 🙌 and COMMENT ✍ if you enjoy this idea! Also share your ideas and charts in the comments section below! This is best way to keep it relevant, support us, keep the content here free and allow the idea to reach as many people as possible. **
-------------------------------------------------------------------------------
Disclosure: I am part of Trade Nation's Influencer program and receive a monthly fee for using their TradingView charts in my analysis.
💸💸💸💸💸💸
👇 👇 👇 👇 👇 👇

Australian CPI expected to jump, Aussie steadyThe Australian dollar is showing limited movement on Tuesday. In the European session, AUD/USD is trading at 0.6482, down 0.01% on the day.
The markets are bracing for an acceleration in Australian CPI on Wednesday. The market estimate stands at 2.3% y/y, compared to 1.9% on June which was the lowest level in over three years. The 1.9% gain was below the Reserve Bank of Australia's 2-3% target range and enabled the RBA to lower rates earlier this month.
If inflation does rise as expected, it would complicate the central bank's plans to continue lowering rates in order to boost economic growth. The RBA minutes from the August meeting noted that inflation remains a concern with risks to inflation in "both directions".
The minutes indicated that members were in agreement that further rate cuts were needed this year but were unclear as to the extent of the easing. Members said that a faster pace of cuts would be appropriate if the labor market softened more quickly than expected or if there were negative developments in the global economy.
The minutes said that upcoming rate decisions would be data-dependent. Investors will be keeping a close eye on employment and inflation data, which are the most critical factors for the central bank in determining its rate path.
The Federal Reserve is widely expected to lower rates at the September meeting, after holding rates since December 2024. Federal Chair Powell's speech at Jackson Hole essentially confirmed a September cut and the US dollar responded with sharp losses against the major currencies. The key question is whether the Fed will cut again in December - that decision will be heavily influenced by the employment and inflation reports.
There is resistance at 0.6524 and 0.6555
0.6469 and 0.6438 are providing support

AUD/USD BEARISH BIAS RIGHT NOW| SHORT
Hello, Friends!
AUD/USD pair is in the downtrend because previous week’s candle is red, while the price is clearly rising on the 4H timeframe. And after the retest of the resistance line above I believe we will see a move down towards the target below at 0.644 because the pair is overbought due to its proximity to the upper BB band and a bearish correction is likely.
Disclosure: I am part of Trade Nation's Influencer program and receive a monthly fee for using their TradingView charts in my analysis.
✅LIKE AND COMMENT MY IDEAS✅

AUDUSD Technical Analysis! SELL!
My dear subscribers,
My technical analysis for AUDUSD is below:
The price is coiling around a solid key level - 0.6490
Bias - Bearish
Technical Indicators: Pivot Points Low anticipates a potential price reversal.
Super trend shows a clear sell, giving a perfect indicators' convergence.
Goal - 0.6459
About Used Indicators:
By the very nature of the supertrend indicator, it offers firm support and resistance levels for traders to enter and exit trades. Additionally, it also provides signals for setting stop losses
Disclosure: I am part of Trade Nation's Influencer program and receive a monthly fee for using their TradingView charts in my analysis.
———————————
WISH YOU ALL LUCK

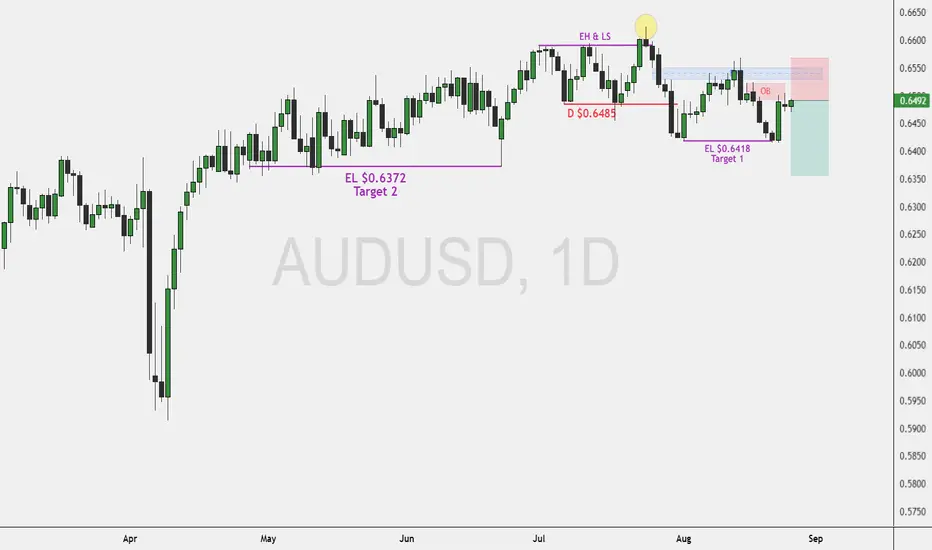
AUD/USD Bearish Setup with Targets ExplainedFenzoFx—AUD/USD formed new lower lows and lower highs after it was displaced by closing below $0.6485. Interestingly, the pair created equal lows at $0.6418. This indicates the trend should be considered bearish, and liquidity is present below $0.6418.
Currently, AUD/USD is consolidating by tapping into the bearish order block. From a technical perspective, we expect the downtrend to resume.
Targets: $0.6418 followed by $0.6372.
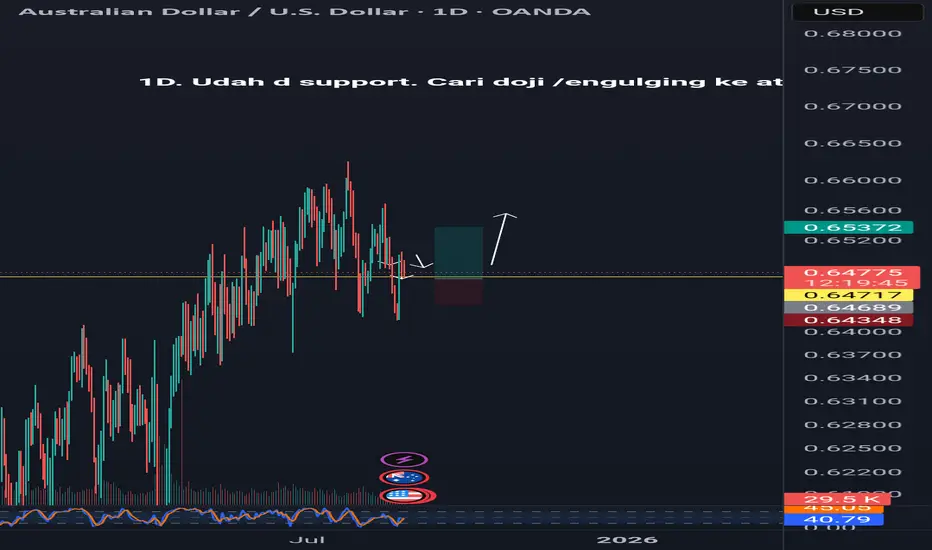
Daily EngulfingThere's a daily engulfing within the uptrend retracement. Enter with the 4-hour price action and wait for support.

26.08.25 Morning ForecastPairs on Watch -
FX:AUDUSD
FX:GBPCAD
FX:GBPAUD
A short overview of the instruments I am looking at for today, multi-timeframe analysis down to what I will be looking at for an entry. Enjoy!

AUDUSD – Trading the Technicals Around Inflation UpdatesFor much of last week AUDUSD was struggling for any upside momentum at all, as an initial fall from a high at 0.6524 on Monday kicked off 4 straight down days in a row, eventually hitting a low of 0.6414 on Thursday, and again on Friday, pre–Federal Reserve Chairman Jerome Powell’s speech at Jackson Hole.
Then, on Friday afternoon it all changed. Powell was more dovish than many FX traders expected which initiated a rush to resell dollars in the hope of the Fed being prepared to cut interest rates as soon as their meeting on September 17th. This led to AUDUSD rebounding strongly into the weekend, eventually closing the week right back where it started around 0.6500.
Yesterday, in a quiet day’s trading AUDUSD managed to consolidate these gains, but this morning with the RBA minutes from the Australian central bank’s last meeting in early August indicating a willingness to cut interest rates again in 2025, as and when the economic data allows, prices have started to edge back to the downside again with a drop to a low of 0.6470 at the time of writing (0700 BST).
Now, looking forward, traders need to consider preparing for 2 key pieces of inflation data, the first from Australia, when the monthly CPI is released at 0230 BST Wednesday (August 27th), then the second on Friday from the US, when the Fed’s preferred inflation gauge, the PCE Index is released at 1330 BST (August 29th). Both inflation updates have the potential to shift trader thinking on where AUDUSD may move next.
The technical outlook could also have an important influence on trader decision making.
Technical Update: Powell Confirms 0.6419 as Support
Much of last week’s AUDUSD activity saw continued price weakness, although Chairman Powell’s testimony on Friday always remained the key focus for FX traders. However, with the initial decline testing the August 1st low at 0.6419, this may have been viewed by some as a support level, at least for the short term.
As the chart above shows, Powell’s Jackson Hole speech did help to reinforce this support at 0.6419, triggering a price rally to end the week. This may now leave traders questioning the directional risks for AUDUSD in the week ahead.
With this in mind, it may help to identify the key support and resistance levels which could influence AUDUSD next price moves.
Potential Resistance Levels:
Following the latest recovery in price, the August 25th session high at 0.6505 could now mark initial resistance this week. How prices behave around this level, particularly on a closing basis, may indicate whether the rally has further upside momentum.
A closing break above 0.6505 may prove to be a potentially positive development. While not a guarantee of continued price strength, it could open scope for a move towards 0.6569 (August 14th high), even 0.6625 (July 24th extreme).
Potential Support Levels:
Initial support remains between the 0.6414/19 band (August lows) which helped fuel Friday’s rally. A closing break below this zone may lead to a further period of price weakness.
If a closing break below 0.6414/19 occurs, further weakness may follow, with potential for tests of 0.6355 (38% Fibonacci retracement), even then declines towards 0.6271 (50% retracement), if this level was to break.
The material provided here has not been prepared accordance with legal requirements designed to promote the independence of investment research and as such is considered to be a marketing communication. Whilst it is not subject to any prohibition on dealing ahead of the dissemination of investment research, we will not seek to take any advantage before providing it to our clients.
Pepperstone doesn’t represent that the material provided here is accurate, current or complete, and therefore shouldn’t be relied upon as such. The information, whether from a third party or not, isn’t to be considered as a recommendation; or an offer to buy or sell; or the solicitation of an offer to buy or sell any security, financial product or instrument; or to participate in any particular trading strategy. It does not take into account readers’ financial situation or investment objectives. We advise any readers of this content to seek their own advice. Without the approval of Pepperstone, reproduction or redistribution of this information isn’t permitted.

AUD/USD: Recovery After a Sharp DeclineAUD/USD fell sharply to a two-month low around 0.6410 after the USD strengthened significantly, driven by reduced market expectations of a Fed rate cut in September, while the RBA kept interest rates unchanged, providing no additional support for the Aussie. However, following the heavy selling pressure, the pair staged a technical rebound toward 0.6490, mainly supported by USD profit-taking, though this is not yet a signal of a sustainable bullish trend.
On the chart, the 0.6480 support level is still holding, and price is now moving toward the 0.6520 resistance zone. A breakout above this level could reinforce short-term bullish momentum and extend the recovery. Conversely, failure to break higher may lead to a pullback toward 0.6445, or even a retest of the 0.6414 low.
In the current context, this is viewed as an important technical rebound after a steep drop, but not yet enough to confirm a long-term uptrend. Traders should carefully watch the market’s reaction around the 0.6520 resistance before deciding on their next strategy.

Could the price reverse from here?The Aussie (AUD/USD) is reacting off the pivot that lines up with the 50% Fibonacci retracement and could drop to the 1st support.
Pivot: 0.6492
1st Support: 0.6451
1st Resistance: 0.6530
Risk Warning:
Trading Forex and CFDs carries a high level of risk to your capital and you should only trade with money you can afford to lose. Trading Forex and CFDs may not be suitable for all investors, so please ensure that you fully understand the risks involved and seek independent advice if necessary.
Disclaimer:
The above opinions given constitute general market commentary, and do not constitute the opinion or advice of IC Markets or any form of personal or investment advice.
Any opinions, news, research, analyses, prices, other information, or links to third-party sites contained on this website are provided on an "as-is" basis, are intended only to be informative, is not an advice nor a recommendation, nor research, or a record of our trading prices, or an offer of, or solicitation for a transaction in any financial instrument and thus should not be treated as such. The information provided does not involve any specific investment objectives, financial situation and needs of any specific person who may receive it. Please be aware, that past performance is not a reliable indicator of future performance and/or results. Past Performance or Forward-looking scenarios based upon the reasonable beliefs of the third-party provider are not a guarantee of future performance. Actual results may differ materially from those anticipated in forward-looking or past performance statements. IC Markets makes no representation or warranty and assumes no liability as to the accuracy or completeness of the information provided, nor any loss arising from any investment based on a recommendation, forecast or any information supplied by any third-party.

Potential bearish drop?AUD/USD is reacting off the resistance lev which is a pullback resistance that aligns with the 50% Fibonacci retracement and could drop from this levle to our take profit.
Entry: 0.6491
Why we like it:
There is a pullback resistance that aligns with the 50% Fibonacci retracement.
Stop loss: 0.6519
Why we llike it:
There is a pullback resistance level.
Take profit: 0.6451
Why we like it:
There is a pullback support that lines up with the 61.8% Fibonacci retracement.
Enjoying your TradingView experience? Review us!
Please be advised that the information presented on TradingView is provided to Vantage (‘Vantage Global Limited’, ‘we’) by a third-party provider (‘Everest Fortune Group’). Please be reminded that you are solely responsible for the trading decisions on your account. There is a very high degree of risk involved in trading. Any information and/or content is intended entirely for research, educational and informational purposes only and does not constitute investment or consultation advice or investment strategy. The information is not tailored to the investment needs of any specific person and therefore does not involve a consideration of any of the investment objectives, financial situation or needs of any viewer that may receive it. Kindly also note that past performance is not a reliable indicator of future results. Actual results may differ materially from those anticipated in forward-looking or past performance statements. We assume no liability as to the accuracy or completeness of any of the information and/or content provided herein and the Company cannot be held responsible for any omission, mistake nor for any loss or damage including without limitation to any loss of profit which may arise from reliance on any information supplied by Everest Fortune Group.

AUD/USD LONG IDEAAUD/USD is testing a strong resistance around 0.6520 that has capped price for months. A breakout looks imminent, and if confirmed, it could open the door for a strong bullish rally towards 0.6650 and beyond.

AUD/USD – Possible Pullback Setup (VMS Strategy)AUD/USD is showing signs of a possible pullback. For me, the next step is simple: wait for all VMS rules (Volume, Momentum, and Structure) to line up before taking action.
I don’t chase trades — I prepare for them. If the next candle confirms with full alignment, we may have an A+ setup. Until then, patience is the edge.
👉 This is how I approach every chart: clarity, confidence, and consistency.
#AUDUSD #VMSStrategy #TradingDiscipline #ForexSetup #AlignedExecution

Who Will Ease More: The RBA or the Fed?Who Will Ease More: The RBA or the Fed?
Technical Factors AUDUSD is currently consolidating sideways within a narrowing triangle, with converging multi-period EMAs, signaling continued range-bound awaiting a breakout. Typically, such consolidation precede a strong momentum move once the range is broken.
A break below the 0.6400 support could trigger a downside extension toward 0.6200.
However, AUDUSD may continue to range between 0.6400 – 0.6600 until a fresh catalyst emerges to drive a decisive breakout.
Fundamental Factors
At present, USD is a key driver across global FX, including AUDUSD, with sentiment focused on Fed rate cut expectation following weaker-than-expected US data such as NFP and PPI.
On the other hand, weak Chinese economics data (e.g., slowing PMI), as Australia’s key trading partner, continues to weigh on commodity demand and in turn pressures the AUD.
Meanwhile, the RBA remains in its rate-cut cycle. Markets are watching closely whether further cuts are forthcoming, given easing inflationary pressures and slowing growth. If the RBA cuts more quickly, the AUD is likely to weaken further. Tomorrow RBA meeting will be in focus.
Therefore, the near-term direction of AUDUSD hinges on which central bank turns more dovish, the RBA, which has been cutting for some time, or the Fed, which may soon begin easing again.
Market sentiment also plays a key role as risk-off conditions favor safe-haven USD inflows and weigh on AUDUSD, while improved risk appetite could temporarily ease selling pressure on the AUD.
Analysis by: Krisada Yoonaisil, Financial Markets Strategist at Exness
