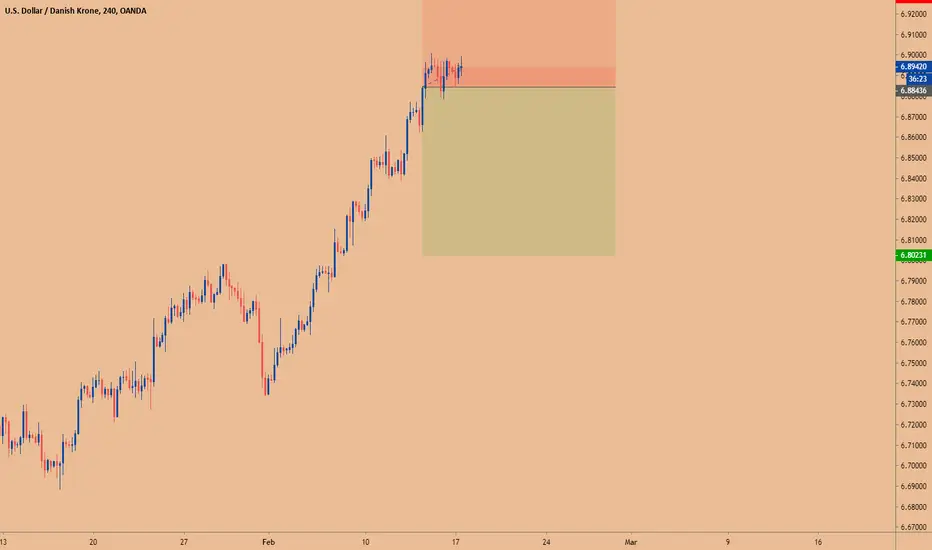
I currently have a SELL STOP at 6.88434I will update the idea id things change but for now we have a sell stop. Notice the rotation happening in the market now. Specifically EUR, USD and cough cough, Indexes. Idea for spy is coming later today or tomorrow.
USDDKK trade ideas
USDDKK SHORT CRABCrab PRZ lines up with Shark PRZ lines up with AB=CD PRZ, I'm pretty confident in a reversal occuring.

SELL USD/DKKWE ARE IN THE WAVE A DOWNWARD AS PER ELLIOTT WAVE PRINCIPLE, WE ARE EXPECTING THE PRICE TO REACH 6.7980.

SELL USD/DKKWE ARE IN THE END OF WAVE 5, EXPECTING A DOWNWARD MOVEMENT IN THE WAVE C TO REACH THE PRICE OF 6.7930 AS PER ELLIOTT WAVE PRINCIPLE.

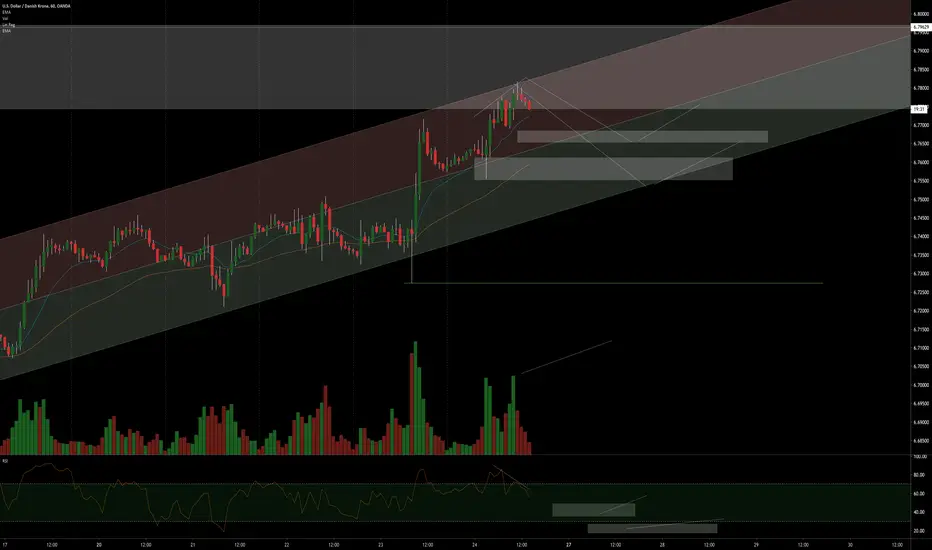
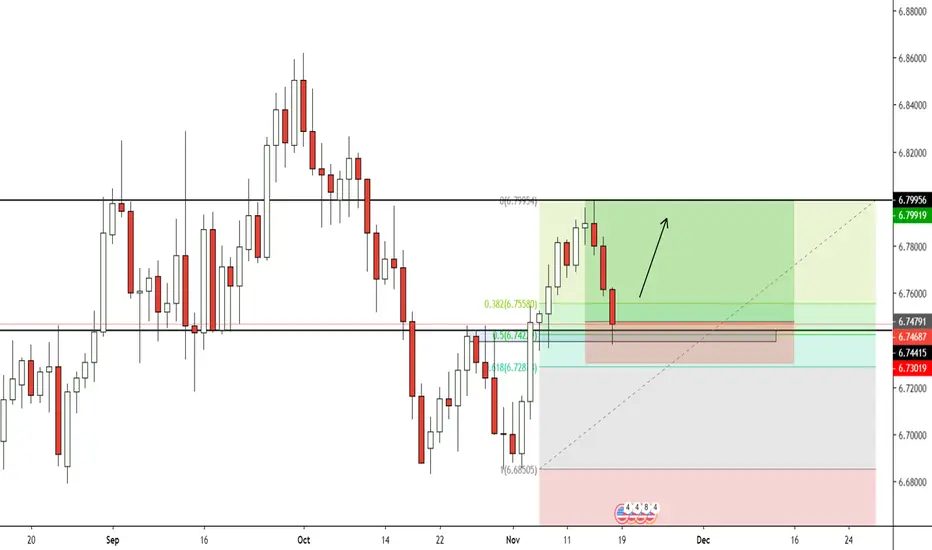
TRADING LOG ENTRY #66 USDDKK SHORTHead & shoulders forming right shoulder with MACD divergence, and on top of that it's in the PRZ of an AB=CD from the 4h chart, this is a high probability trade. I would enter the trade at the 0.50 fib retracement.


USDDK TGT practice 24 JAN 2020 1332 hrs. Background:
Uptrend
RSI negative divergence into new high ground with volume expansion
entering key resistance zone (clearly seen on the daily)
Volume (increasing supply pressure) expansion as it nears resistance
fairly weak uptrend (lack of buyers on re-accumulation, increased selling at each test of new high ground)
looking for volume expansion (demand pressure increase) at support and key fib zones with the intent of riding the uptrend.
Maybe a counter-trend possible but need to keep risk in check. Double top with a high volume upthrust would be a good counter trend.
Practice*
38.2% & POSSIBLE 61.8% Retracement SHORT GWAVE38.2% & POSSIBLE 61.8% Retracement SHORT GWAVE.
FIB Retracement Percentage is calculated in a Higher Cartesian and or Euclidean Dimension.
PLEASE ALWAYS WAIT FOR STOCHASTIC CONFIRMATION!!! THANKS

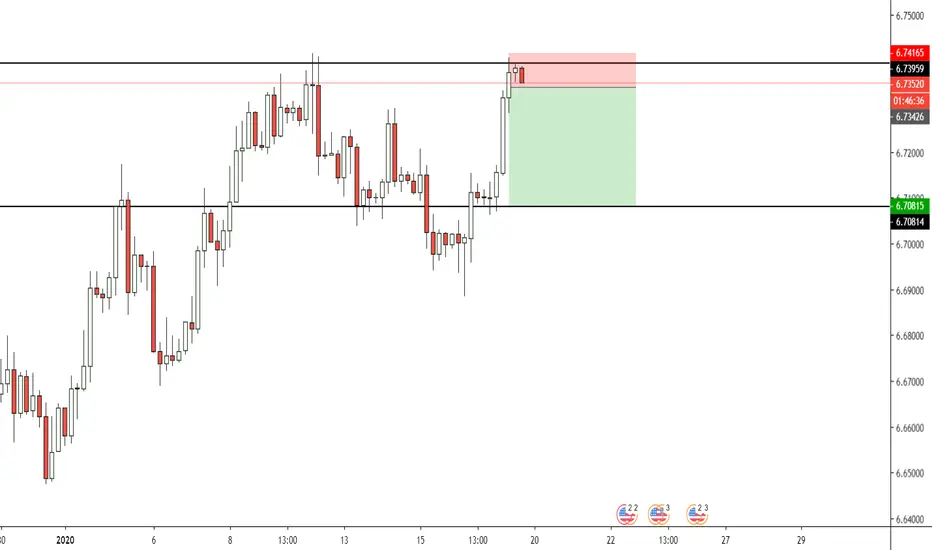
USDDKK Short Trade. Price testing resistancePrice is testing resistance on the USDDKK pair. Here on the 4 hour chart we see price testing a daily resistance level. On the 4 hour an inverted hammer was printed and on the 1 chart we see many small indecision candles showing buyers losing momentum so let's see if sellers take control.
USDDKK: Buy opportunity on the 1M Channel Up.The price is testing again the 1D MA50 (blue line) following a rebound on the Higher Low of the 1M Channel Up (RSI = 54.950, MACD = 0.046, ADX = 37.670, Highs/Lows = 0.0000) it has been trading on since mid 2018.
The MACD and RSI on the 1D chart are both waving the same bull flags they did when the price reached previous Higher Lows on the Channel. We treat this as a strong medium term buy opportunity with TP = 6.8000 and 6.8500.
** If you like our free content follow our profile (www.tradingview.com) to get more daily ideas. **
Comments and likes are greatly appreciated.

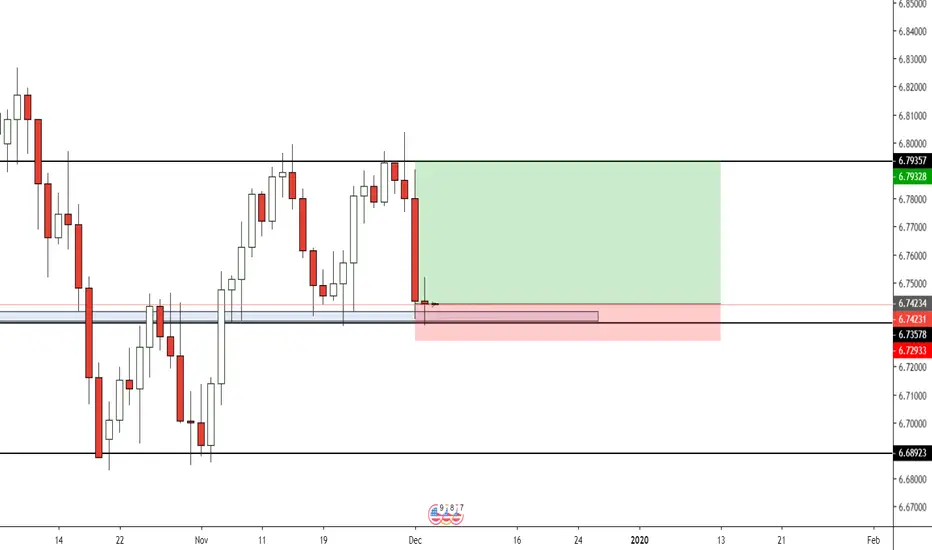
Retracement on MA50 in overall daily bearish trendDISCLAIMER and RISK WARNING: Trading has large potential rewards, but also large potential risk. You must be aware of the risks and be willing to accept them. Don't trade with money you can't afford to lose. The contents and information provided here are for information purposes only, and are neither a solicitation nor an offer to buy or sell forex, cryptocurrencies, futures , commodities or stocks.


USDDKK Buy SignalPattern: Channel Up on 1M.
Signal: Bullish as the price is on the Higher Low zone of the Channel Up, supported by the 1D MA200.
Target: 6.8500 (just below the 1W Resistance) and if the 1W R breaks 6.9300 (projected Higher High).

USDDKK LONG. Doji Formed at SupportA doji formed on the Daily chart for USDDKK. I will be going long on this pair and I will be targeting previous resistance.
USDDKK SHORT TRADE. After that inverted hammer formed on the Daily chart on the 25th, today the pair closed bearish so I am shorting this pair and targeting previous support.

38.2% & POSSIBLE 61.8% Retracement SHORT GWAVE38.2% & POSSIBLE 61.8% Retracement SHORT GWAVE.
FIB Retracement Percentage is calculated in a Higher Cartesian and or Euclidean Dimension.
PLEASE ALWAYS WAIT FOR STOCHASTIC CONFIRMATION!!! THANKS


USDDKK LONG. Rejecting Daily Support LevelThe USDDKK chart is now at support and testing it on the Daily chart. This level also happens to be a 50 FIB level as well. Going down to the 1 hour chart we see a bullish pin bar formed at this level. I will be going long and I will be targeting previous resistance as my take profit.


BUY Potential on USDDKKWait for the BUY signal on USDDKK as the price approach the 0.68 on FIB.
wait for it and ride it back up.
