Bitcoin - Starting a 20% correction! 69k soon.Bitcoin is probably starting a massive 20% correction - my target is 69k. Why? I have many reasons.
The first reason is that from a technical point of view, Bitcoin just finished an impulse wave 12345 from the bottom of the bull market. Elliott Wave theory tells us that after an impulse wave we sh
Compare with USDT/BTC
Bitcoin Price Update – Clean & Clear ExplanationBitcoin is currently trading around 83,330, consolidating above the 83,200–83,300 support zone after a strong rejection from the higher resistance area.
The key level to watch is 83,200–83,300. If this zone continues to hold and BTC forms a strong bullish reaction, the next move could target 84,00
Bitcoin Rejected at the Highs: A Deeper Retracement Could FollowHello traders! Here’s my technical outlook based on the current BTCUSDT (1H) chart structure. BTCUSDT previously rallied higher and formed a Rounding Top near the highs, where sellers rejected the upside and price turned around. Price then broke below the ascending structure and is now trading under
The Bear Market Is EndingA month away from the charts for family reasons, and I'm back. You sent a big batch of questions this week, so I'm answering them here with the chart in front of us.
All year I said this market would fall, and it did. Now the bear market is ending and a bull market is starting. That bull runs for y
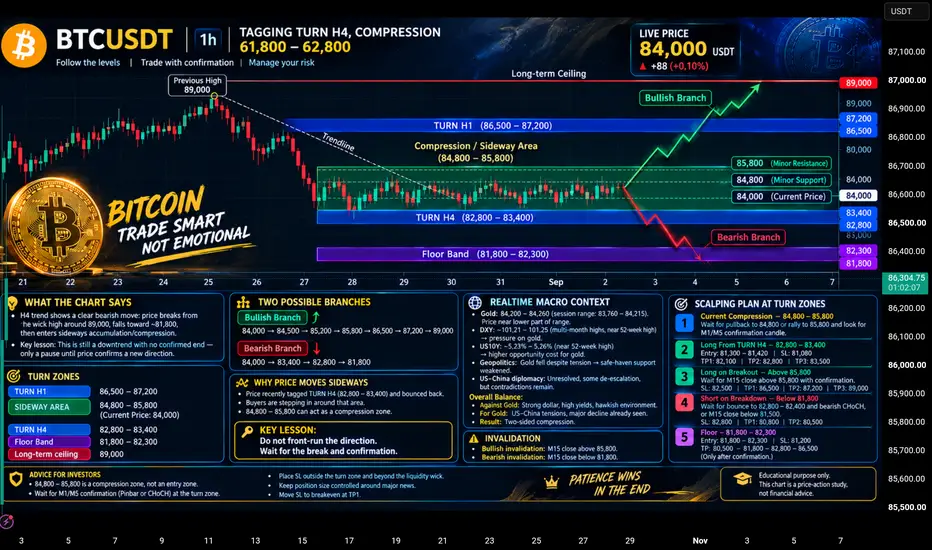
BTCUSD | Price Action • Market Structure • Liquidity • Breakout BTCUSD — THE 84K DECISION ZONE | Compression, Liquidity & The Next Big Move
BTCUSD | Price Action • Market Structure • Liquidity • Breakout Map
Bitcoin is currently around the 84,000 area, where price is showing a developing battle between buyers and sellers. Instead of forcing a bullish or bearis
BITCOIN - Long squeeze of the liquidity zone within an uptrendBINANCE:BTCUSDT.P maintains a local bullish trend; however, after strong growth, the market is entering a phase of consolidation and correction within the range.
Spot BTC ETF inflows continue but are slowing; however, the market is supported by emerging hype and relatively strong SP500 & NQ in
Bitcoin Trapped for 8 Days—Is the Range Finally About to Break?Bitcoin ( BINANCE:BTCUSDT ) has been trading between the Support and Resistance Zones for the past eight days, creating a range-bound market with no clear directional trend.
BTC is now testing the Support Zone, the Cumulative Long Liquidation Leverage($83,000-$82,140), and the Support Lines.
Can B
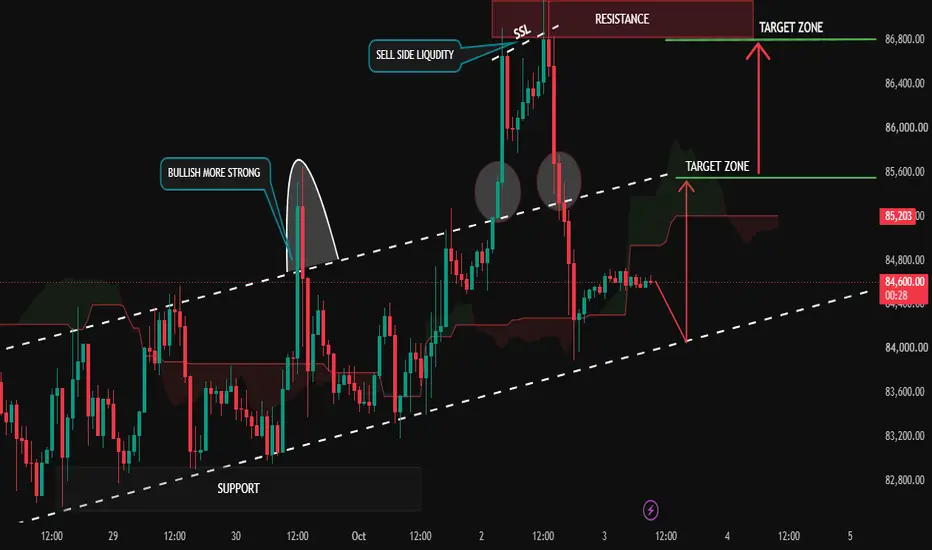
₿ BTCUSDT — BUY SETUP...₿ BTCUSDT — BUY SETUP
Buy Engagement Area: 84,450–84,650
🎯 Upside Objectives
T1: 85,600
T2: 86,800
🛡️ Structure Guard: 84,000
📊 Market Analysis
BTC is holding inside a rising channel after recovering from the lower channel boundary. Price is currently consolidating around 84,600, while the cha
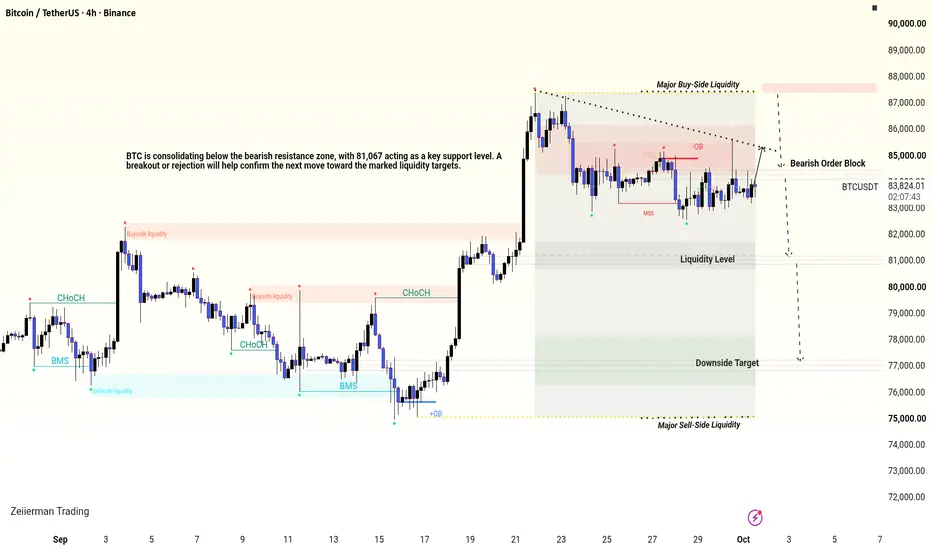
BTCUSDT 4H | Liquidity Sweep, Bearish Order Block & Key Support BTCUSDT — 4H Liquidity Structure, Compression & Potential Market Expansion
Market Overview
Bitcoin is currently trading around 83,736 USDT, following a strong bullish expansion from the 75,000–77,000 demand region toward the 87,380 liquidity zone.
After reaching the upper liquidity area, price ex
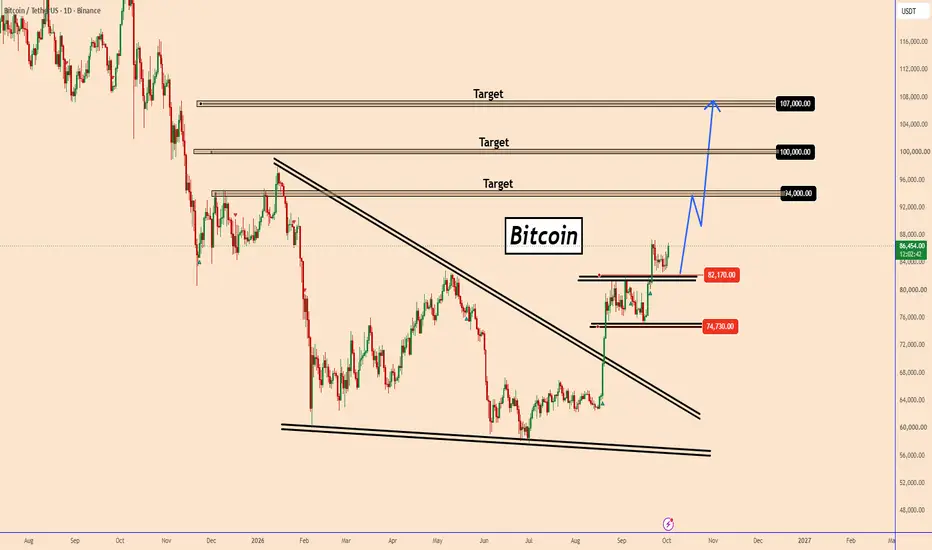
BTC:Breakout Above $87,360 Could Open the Path Toward $107KBTC:Breakout Above $87,360 Could Open the Path Toward $107K
From our previous analysis, Bitcoin broke out of the first accumulation above 82170.
Price started another accumulation on the daily chart and Bitcoin looks well positioned for a bigger move on the daily chart.
From the short-term analy
See all ideas
Summarizing what the indicators are suggesting.
Oscillators
Neutral
Oscillators
Neutral
Summary
Neutral
Summary
Neutral
Summary
Neutral
Moving Averages
Neutral
Moving Averages
Neutral
Displays a symbol's price movements over previous years to identify recurring trends.