SHIB/USDT Secondary trend. Channel. 14 months accumulation.Logarithm. Time frame 1 week for clarity of the channel range. 3 weeks ago, there was an exit of the price under the support of the accumulation channel by a large percentage. Many long positions were liquidated.
The chart shows the percentages from this reversal zone to the channel resistance, as well as the average profit percentage when exiting this accumulation channel from the average set price to the significant first resistance.
This is what the chart of this cryptocurrency looks like on a line chart without the “market noise” volatility.
Accumulation Zone. Pump/Dump and compliance with risk and money management.
Remember, this is a pamp/dump meme cryptocurrency, which even at -93% down from peak pumping and with a set zone of about 14 months (!) is at an inadequate profit. That's why follow risk management in your work.
It is more rational to work on such cryptocurrencies, not with stops (high volatility, slippage at high %, high probability of beaten out before price increase, the large value of stop is meaningless, they can beat out at -2% and -40%), and work from average buy/sell price (only spot!) with reasonable observance of money management.
USDTSHIB trade ideas

MACD are sell point are getting lightIt's almost on the trend resistant line with a higher volume.
Buy for intra day and hodling.
Be careful for holding it for 3 weeks or so.

SHIB/USDTSHIB is currently making bullish flag pattern on Weekly tf.
Still it is in range you can see how beaufifully it reject from mid range.
Last Target 0.00003.
ALTs Mini Bull Run Guys.
If you like my idea do like and follow me
if you have any queries write down i will assist you
Thank you

SHIB update! Time to buy for me!Not a financial advice! I see that SHIB hit my target so it will have a run up again! I see people analyze chart and use verbiages that makes it hard to understand so I try to explain the chart in the simplest way I see! Hope you share your thoughts on them too!

Update shib/usdt price prediction by ictShib filled vi gap successfully and reached to tp1.
Good luck dear traders 👋


SHIB: scalp in M15📊Analysis by AhmadArz:
🔍Entry: 3645
🛑Stop Loss: 3437
🎯Take Profit: 3955-4216-4455
🔗"Uncover new opportunities in the world of cryptocurrencies with AhmadArz.
💡Join us on TradingView and expand your investment knowledge with our five years of experience in financial markets."
🚀Please boost and💬 comment to share your thoughts with us!

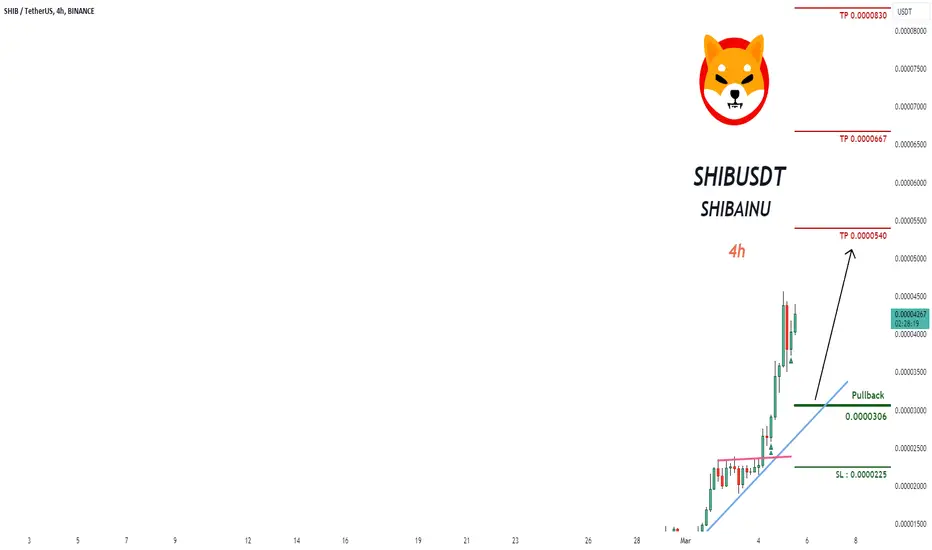
SHIBAINU It is likely to continue to rise - Reduce the risk!Trading Setup:
There is a Trading Signal to Buy in SHIBUSDT SHIBAINU (h4) (spot)
Traders can open their Buy Trades NOW
⬆️Buy now or Buy on 0.0000306
⭕️SL @ 0.0000225
🔵TP1 @ 0.0000540
🔵TP2 @ 0.0000667
🔵TP3 @ 0.0000830
What are these signals based on?
Classical Technical Analysis
Price Action Candlesticks Fibonacci
RSI, Moving Average , Ichimoku , Bollinger Bands
Risk Warning
Trading Forex, CFDs, Crypto, Futures, and Stocks involve a risk of loss. Please consider carefully if such trading is appropriate for you. Past performance is not indicative of future results.
If you liked our ideas, please support us with your likes 👍 and comments .
Alikze → SHIB | Completing ascending micro waves 3According to the analysis of the previous post, it climbed to the supply area after the exit of the density. In the 12h time, after the support in the green box area, it is completing the 2 out of 3 microwaves. This current wave, with the support of the green box, has the ability to reach the supply area, and then the 0.78 Fibo target, and then the 0.00001401 target. had
Note: Note that there is a double correction in the weekly time that has been completed and is in ascending guard, which I will send step by step updates.
Analysis invalidity: below the green box area
🟩Sup:Green box
⛳️Tp 1:0.00001060 - 0.00001089
⛳️ Tp2 :0.00001178
⛳️ Tp3 :0.00001401
------------------
Please support this idea with a LIKE and COMMENT if you find it useful and Click "Follow" on our profile if you'd like these trade ideas delivered straight to your email in the future.
Thanks for your continued support.
Sincerely.❤️

SHIB is On The Demand ZoneSHIB Is On The Demand Zone And Correction Candles Is Weak.
If Price Stablize Up 0.786 Fibo Is Good For SHIB

SHIB has a very good Investment opportunity Hi Everyone;
today we have a memes coin
it has more than 187 times the risk and the chart is look very promising.
I expect breaking the previous bear market key point will clear the way to the final target
I don't recommend investing too much money in memes coins because of the High volatility.

In SHIBUSDT , all signs are AscendingTrading Setup:
There is a Trading Signal to Buy in SHIBUSDT SHIBAINU
Traders can open their Buy Trades NOW
⬆️Buy now or Buy on 0.0000227
⭕️SL @ 0.0000178
🔵TP1 @ 0.0000373
🔵TP2 @ 0.0000470
🔵TP3 @ 0.0000580
What are these signals based on?
Classical Technical Analysis
Price Action Candlesticks Fibonacci
RSI, Moving Average , Ichimoku , Bollinger Bands
Risk Warning
Trading Forex, CFDs, Crypto, Futures, and Stocks involve a risk of loss. Please consider carefully if such trading is appropriate for you. Past performance is not indicative of future results.
If you liked our ideas, please support us with your likes 👍 and comments .

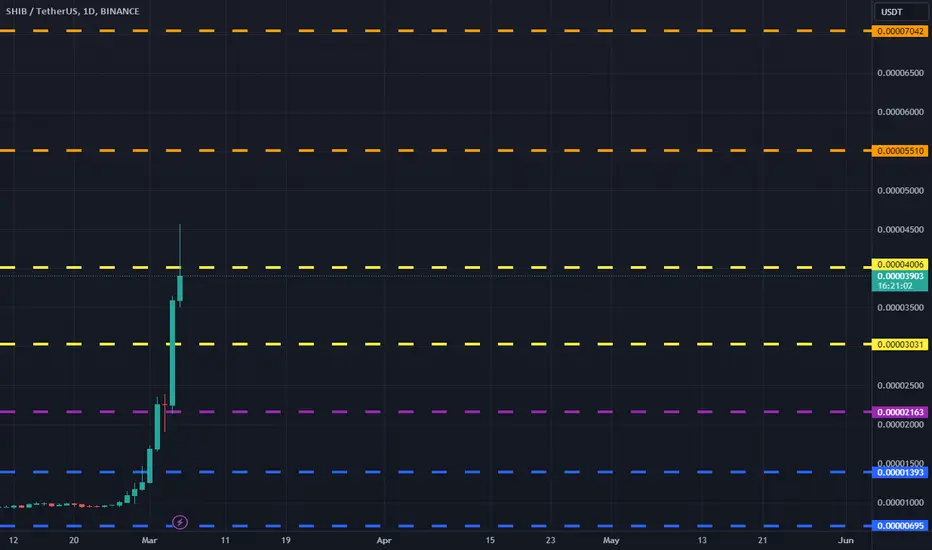
SHIBUSDT(Shiba Inu) Daily tf Range Updated till 05-03-24SHIBUSDT(Shiba Inu) Daily timeframe range. it had insane amount of continuous pump. outperforming many things at once. easiest profit one can made. now trying against 0.00004006 a retrace would not surprise me at this point but it still have enough fuel do more carnage.
Shiba/USDT Up to 20% profit waiting for new buyersThe attention of all users has been drawn to Shiba. According to the numerical patterns in the chart, I think we will grow by 20%. If this does not happen, I will shave my hair and post the video here

Buy signalHello my friends, an analysis for the long term and for the holders on Shiba currency.
As I specified in the daily chart, there are two targets for this currency, it was assumed that the price will reach them in the future.
Do not forget that this is my personal analysis and you should act according to your trading strategy and plan.
My method has no loss limit and you can visit the rest of my analysis for accuracy.
You can send a message to analyze the currency you want.
Good luck

✴️ Shiba Inu 6X Lev. Trade Numbers | Timing (822% Potential)I am still all set on timing... Timing can be a great tool for traders, say for beginners that are hard on patience, wait and planning.
Having great timing can mean anything when it comes to leverage trading, it surely makes things easier and potential is always so high, so fast, that having the right timing can make a huge difference, remove stress and anxiety, and produce results right away.
Here you have the full trade-numbers for SHIBUSDT
-------
LONG SHIBUSDT | 6X
Buy-in: $0.00000742 - $0.00000824
Targets:
1) $0.00000888
2) $0.00000945
3) $0.00001125
4) $0.00001285
5) $0.00001430
6) $0.00001610
7) $0.00001733
8) $0.00001890
Stop-loss: Close daily below $0.00000722
Potential profits: 822%
Capital allocation: 3%
------
Leveraged trading is high risk and for experienced traders only. You've been warned.
I am sharing these numbers as reference points and you are responsible for your own actions.
This is not financial advice.
I am wishing you tons of wealth, health and success.
Now and forever more.
Thank you for reading.
Namaste.

✴️ Shiba Inu Final Call Before Take Off, The Wait Is Over!Just as the title says, the wait is over!
Shiba Inu (SHIBUSDT) is moving now above EMA50 on the 3D timeframe after a major medium-term (October vs June 2023) and long-term (June 2023 vs September 2021) higher low.
In 2021 we had a short consolidation phase while in 2023 we have a long consolidation phase, works with Elliots alternation rule.
➖ Fast turns into slow.
➖ Simple turns into complex and vice versa.
👉 The targets can be seen on the chart but Shiba Inu can easily grow 215% in the coming weeks, within 1-3 months. Most likely to happen within 1.5 months.
This is not financial advice.
Thank you for reading.
Namaste.
P.S. Full trade-numbers available for this pair in the 'Related Ideas' below.

bull going DO NOT FORGET USING A STOP LOSS
Warning:
This is just a suggestion and we do not guarantee profits. We advise you analyze the chart before opening any position.
I hope you are always profitable


shiba full bull going to hit 0.00005price now : 0.000028500
target :
1 : 0.000047
2: 0.0001
3 : moon
please trade with stop loss : 0.00001825


SHIB bull flag breakout Shib have been consolidating in a downwards price action and it currently breakout if it mange to break pass .000011 you can expect .000015 in the next coming weeks.

SHIBUSDT UNIQUE IDEACRYPTOCAP:SHIB
UPDATE
CRYPTOCAP:SHIB has breaked the main resistance fib level 0.38. Now this is ready for another bullish wave. In this move we can see gain upto 80%+ soon✍
#SHIB #SHIBUSDT #SHIBBTC #CRYPTO #BNB #SIGNALS
