crude oilCrude oil is currently on main wave B of an A,B & C correction, pair has completed sub-wave A & now its currently on towards sub-wave B is about to be confirmed as pair is expected to breakout towards minor-wave 5 of sub-wave C on main wave B
USDWTI trade ideas

USOIL, dailyOil prices remained stable after a significant weekly decline, with attention on the upcoming OPEC+ meeting and the start of the US summer driving season. OPEC+ is expected to extend supply cuts into the second half of the year to counteract high U.S. output and support international crude prices. The decision to hold the OPEC+ meeting online suggests a continuation of existing policies without major changes, aiming to maintain current quotas and support crude prices. Strong US demand ahead of the Memorial Day weekend, indicated by record flight activity and robust gasoline demand, is expected to provide support to oil prices. Despite geopolitical risks and OPEC+ production cuts, oil futures have decreased since mid-April as concerns about Middle East conflicts disrupting oil flows have eased.
On the technical side, the price has re-entered the trading channel between the $77.50 - $79.50 area and is currently testing the area of the 20-day moving average. The scenery is kind of mixed since the Stochastic oscillator is not indicating any overbought or oversold levels while the moving averages are not pointing to any direction in the short term. The 50-day moving average is trading above the 100-day line while the 20-day has crossed below the 100-day in the previous week. On top of everything the Bollinger bands have contracted greatly in the last 5-6 sessions hinting that volatility is dried-up therefore the most probable scenario for the coming sessions is for the trading range to continue until there is a new catalyst in the market for crude oil.

WTI OIL Bullish Divergence aiming higher.WTI Oil (USOIL) has been consolidating within the 1D MA200 (orange trend-line) and the 1W MA200 (red trend-line) for a full month. We have previously seen the same king of consolidation in mid-2023 and then November 2023 - January 2024. On both occasions, the price then entered a medium-term Channel Up.
Also on all occasions, the 1D RSI was on Higher Lows, while the price has been on Lower Lows, which is an indication of a Bullish Divergence. It is the exact same formation that Oil is currently on. As a result, we turn bullish on Crude for the medium-term, targeting $84.00 (just above the 0.618 Fibonacci retracement level and on the Lower Highs trend-line).
-------------------------------------------------------------------------------
** Please LIKE 👍, FOLLOW ✅, SHARE 🙌 and COMMENT ✍ if you enjoy this idea! Also share your ideas and charts in the comments section below! This is best way to keep it relevant, support us, keep the content here free and allow the idea to reach as many people as possible. **
-------------------------------------------------------------------------------
💸💸💸💸💸💸
👇 👇 👇 👇 👇 👇

WTI TO GO BULLISH!Price may go bullish if we can get a price offer at 78.450. Following the upcoming U.S. pce news coming up, price surged higher today & made 0.25% increase. A buy opportunity is envisaged when price drops to 78.450
Target is 79.00

WTI Crude Oil Price Shows Bullish Trend Ahead of OPEC MeetingWTI Crude Oil Price Shows Bullish Trend Ahead of OPEC Meeting
As the chart indicates, on Monday, the price of WTI crude oil rose by approximately 1%.
Reuters reports that the bullish sentiment is driven by:
→ the upcoming OPEC+ meeting scheduled for 2 June;
→ expectations of high fuel demand with the start of the summer driving season and holiday season in the US.
Conducting a technical analysis of WTI crude oil on 10 May, we drew an ascending channel in blue and suggested a scenario of continued price growth within this channel.
Since then:
→ the price formed a low on 15 May at the level of 76.35, but quickly recovered from it. Thus, the bears' attempt to break the low of 8 May at the level of 76.68 quickly failed. In other words, there was a false breakout of the 8 May low.
→ A similar pattern occurred on 24 May – the price dropped below the 15 May low of 76.35, but quickly recovered.
Two false bearish breakouts are a bullish sign. And the strong behaviour of WTI crude oil prices on Monday confirms this.
Analysing the XTI/USD chart today, it is important to note that:
→ the price movement in April-May forms a descending channel (shown in red);
→ this decline since 5 April may be a correction within the larger ascending blue channel;
→ the price quickly returned to the blue channel, briefly dipping below its lower boundary;
→ the price is near the upper boundary of the descending channel.
Thus, conditions are being created for the end of the corrective movement. The bears' inability to hold the WTI oil price at new lows may be used by the bulls to resume the upward trend. It is also possible that news related to the OPEC+ meeting will contribute to this development.
Start trading commodity CFDs with tight spreads. Open your trading account now or learn more about trading commodity CFDs with FXOpen.
This article represents the opinion of the Companies operating under the FXOpen brand only. It is not to be construed as an offer, solicitation, or recommendation with respect to products and services provided by the Companies operating under the FXOpen brand, nor is it to be considered financial advice.

USOIL sell side Hey there on 2hTF the USOIL has looking today sell scenario can be retest from 79.00
79.50 can there again slip downside continue will looks for next support 77.50
USOIL: Short-term oil prices are on the way to recovering to $80USOIL: Short-time period oil fees are at the manner to convalescing to BSE:EIGHTY because the marketplace is presently watching for the subsequent OPEC+ meeting. However, the chance of a lower is fantastically excessive due to the fact OPEC+ nations have nearly all showed the growth in production. This will probably reason oil fees to drop even lower. Consider ready to promote with USOIL around BSE:EIGHTY with the anticipated goal to go back to $75-76

USOIL Resistance Rejection ? 27.05.2024- 1-hour USOIL chart shows resistance rejection.
- If rejection holds, price likely to go down.
- If rejection fails and breaks out to the upside, price likely to go up.
- Apply risk management.
Risk Warning: Trading in CFDs is highly speculative and carries a high level of risk. It is possible to lose all of your invested capital. These products may not be suitable for everyone, and you should ensure that you fully understand the risks taking into consideration your investment objectives, level of experience, personal circumstances as well as personal resources. Speculate only with funds that you can afford to lose. Seek independent advice if necessary. Please refer to our Risk Disclosure.
BDSwiss is a trading name of BDS Markets and BDS Ltd.
BDS Markets is a company incorporated under the laws of the Republic of Mauritius and is authorized and regulated by the Financial Services Commission of Mauritius ( FSC ) under license number C116016172, address: 6th Floor, Tower 1, Nexteracom Building 72201 Ebene.
BDS Ltd is authorized and regulated by the Financial Services Authority Seychelles (FSA) under license number SD047, address: Suite 3, Global Village, Jivan’s Complex, Mont Fleuri, Mahe, Seychelles. Payment transactions are managed by BDS Markets (Registration number: 143350)

UsOil longUsoil looks for more buy momentum use Stop-loss we have entered after confirmation only in this pair so it may slow process but sure process

Oil BoilAll ideas are strictly my interpretation of price action. I am not a professional trader nor is this
professional advice.
I will continually update all trades.


Crude Oil (WTI) may rise to 78.30 - 78.70Pivot
77.50
Our preference
Long positions above 77.50 with targets at 78.30 & 78.70 in extension.
Alternative scenario
Below 77.50 look for further downside with 77.15 & 76.60 as targets.
Comment
The RSI is bullish and calls for further advance.
Supports and resistances
79.00
78.70
78.30
78.02 Last
77.50
77.15
76.60
Number of asterisks represents the strength of support and resistance levels.

WTI Oil H4 | Pullback resistance at 50% Fib retracementWTI oil (USOIL) is rising towards a pullback resistance and could potentially reverse off this level to drop lower.
Sell entry is at 78.41 which is a pullback resistance that aligns with the 50.0% Fibonacci retracement level.
Stop loss is at 79.30 which is a level that sits above the 61.8% Fibonacci retracement level and a pullback resistance.
Take profit is at 76.59 which is a pullback support.
High Risk Investment Warning
Trading Forex/CFDs on margin carries a high level of risk and may not be suitable for all investors. Leverage can work against you.
Stratos Markets Limited (www.fxcm.com):
CFDs are complex instruments and come with a high risk of losing money rapidly due to leverage. 68% of retail investor accounts lose money when trading CFDs with this provider. You should consider whether you understand how CFDs work and whether you can afford to take the high risk of losing your money.
Stratos Europe Ltd, previously FXCM EU Ltd (www.fxcm.com):
CFDs are complex instruments and come with a high risk of losing money rapidly due to leverage. 70% of retail investor accounts lose money when trading CFDs with this provider. You should consider whether you understand how CFDs work and whether you can afford to take the high risk of losing your money.
Stratos Trading Pty. Limited (www.fxcm.com):
Trading FX/CFDs carries significant risks. FXCM AU (AFSL 309763), please read the Financial Services Guide, Product Disclosure Statement, Target Market Determination and Terms of Business at www.fxcm.com
Stratos Global LLC (www.fxcm.com):
Losses can exceed deposits.
Please be advised that the information presented on TradingView is provided to FXCM (‘Company’, ‘we’) by a third-party provider (‘TFA Global Pte Ltd’). Please be reminded that you are solely responsible for the trading decisions on your account. There is a very high degree of risk involved in trading. Any information and/or content is intended entirely for research, educational and informational purposes only and does not constitute investment or consultation advice or investment strategy. The information is not tailored to the investment needs of any specific person and therefore does not involve a consideration of any of the investment objectives, financial situation or needs of any viewer that may receive it. Kindly also note that past performance is not a reliable indicator of future results. Actual results may differ materially from those anticipated in forward-looking or past performance statements. We assume no liability as to the accuracy or completeness of any of the information and/or content provided herein and the Company cannot be held responsible for any omission, mistake nor for any loss or damage including without limitation to any loss of profit which may arise from reliance on any information supplied by TFA Global Pte Ltd.
The speaker(s) is neither an employee, agent nor representative of FXCM and is therefore acting independently. The opinions given are their own, constitute general market commentary, and do not constitute the opinion or advice of FXCM or any form of personal or investment advice. FXCM neither endorses nor guarantees offerings of third-party speakers, nor is FXCM responsible for the content, veracity or opinions of third-party speakers, presenters or participants.

Let's see if it can climb back above the 78-dollar markEASYMARKETS:OILUSD
Disclaimer:
easyMarkets Account on TradingView allows you to combine easyMarkets industry leading conditions, regulated trading and tight fixed spreads with TradingView's powerful social network for traders, advanced charting and analytics. Access no slippage on limit orders, tight fixed spreads, negative balance protection, no hidden fees or commission, and seamless integration.
Any opinions, news, research, analyses, prices, other information, or links to third-party sites contained on this website are provided on an "as-is" basis, are intended only to be informative, is not an advice nor a recommendation, nor research, or a record of our trading prices, or an offer of, or solicitation for a transaction in any financial instrument and thus should not be treated as such. The information provided does not involve any specific investment objectives, financial situation and needs of any specific person who may receive it. Please be aware, that past performance is not a reliable indicator of future performance and/or results. Past Performance or Forward-looking scenarios based upon the reasonable beliefs of the third-party provider are not a guarantee of future performance. Actual results may differ materially from those anticipated in forward-looking or past performance statements. easyMarkets makes no representation or warranty and assumes no liability as to the accuracy or completeness of the information provided, nor any loss arising from any investment based on a recommendation, forecast or any information supplied by any third-party.

The pros' next week analysis and strategy for crude oilMarket Analysis: Crude Oil Price Signal Bearish Acceleration
Crude oil prices declined steadily below the $80.00 support and moved into a bearish zone.
Important Takeaways for Oil Prices Analysis Today
Crude oil prices extended downsides below the $78.00 support zone.
A major bearish trend line is forming with resistance near $78.00 on the hourly chart of XTI/USD at FXOpen.
Oil Price Technical Analysis
On the hourly chart of WTI Crude Oil at FXOpen, the price struggled to continue higher above $80.00 against the US Dollar. The price formed a short-term top and started a fresh decline below $78.00.
There was a steady decline below the $77.40 pivot level. The bears even pushed the price below $76.50 and the 50-hour simple moving average. Finally, the price tested the $76.30 zone. The recent swing low was formed near $76.31, and the price is now consolidating losses.
Immediate support is near the $76.30 level. The next major support on the WTI crude oil chart is near $75.00. If there is a downside break, the price might decline toward $73.50. Any more losses may perhaps open the doors for a move toward the $72.00 support zone.
On the upside, immediate resistance is near the 23.6% Fib retracement level of the downward move from the $78.52 swing high to the $76.31 low at $76.80.
The next resistance is near the 50-hour simple moving average and the 50% Fib retracement level of the downward move from the $78.52 swing high to the $76.31 low at $77.40. The main resistance is near a trend line at $78.00.
A clear move above the trend line resistance could send the price toward $79.05. The next key resistance is near $79.90. If the price climbs further higher, it could face resistance near $81.20. Any more gains might send the price toward the $82.00 level.

WTI or USOhello everyone...
the price reach the main resistance area as well reached the resistance downtrend line...price will likely pull back to support area... with today news of crude oil show high number of oil inventories. based on fundamental and technical, we should see some pull back for now...
good luck

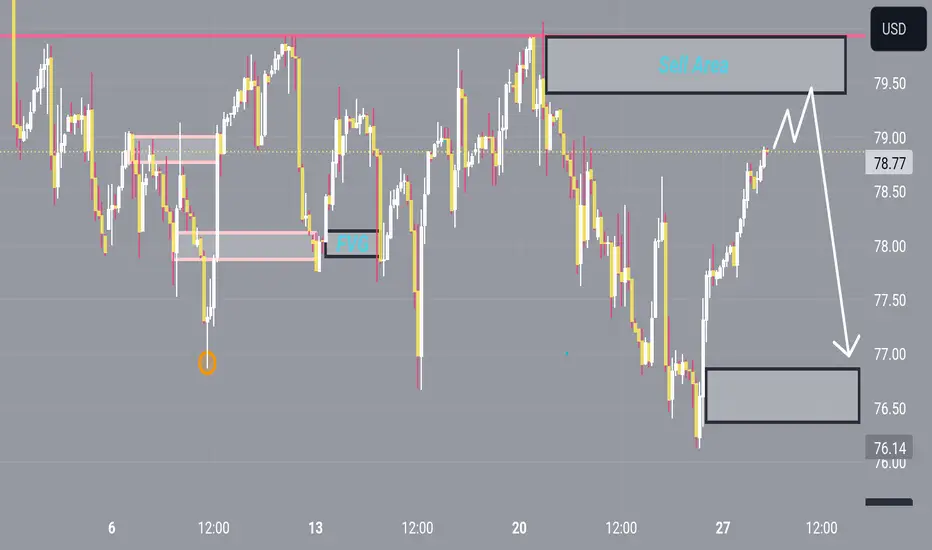
WTI (Crude) Price Action on 15m TimeframeThere is currently seeing bullish price action on the 15m timeframe which appears to be a pullback/retracement on the 4h timeframe which is now displaying bearish price action.
This appears to be preparation of lower timeframe re-alignment of the higher timeframe price action. The expectation is that price will "tap-in" at the 78.36 price point where there is identified bearish orderflow.
Price is currently in Premium so we are only interested in shorts at this time. We also are using internal range liquidity (FVGs, Trandline Liquidity) below the current support as confluence for downward price movement in the coming hours.

USoil will further push Down-side After Testing TrendlineHello Traders
In This Chart XTIUSD HOURLY Forex Forecast By FOREX PLANET
today XTIUSD analysis 👆
🟢This Chart includes_ (XTIUSD market update)
🟢What is The Next Opportunity on XTIUSD Market
🟢how to Enter to the Valid Entry With Assurance Profit
This CHART is For Trader's that Want to Improve Their Technical Analysis Skills and Their Trading By Understanding How To Analyze The Market Using Multiple Timeframes and Understanding The Bigger Picture on the Charts

USOIL: Crude oil trading strategy, Sell@78.2Looking at the hourly chart of crude oil, oil prices hit 76.70 to gain support. The price rebounded during the day and is now around 78.2. Judging from the strength of the two waves of decline and then rebound, the momentum of the bulls has strengthened. However, oil prices are still suppressed by the moving average system, and the current price is near the upper Bollinger Band. There is demand for a fall again in the short term. It is expected that the trend of crude oil will continue to be mainly downward.
Therefore, you can consider Sell near 78.2 today and set two goals.

USOIL: Bullish Continuation & Long Trade
USOIL
- Classic bullish formation
- Our team expects pullback
SUGGESTED TRADE:
Swing Trade
Long USOIL
Entry - 77.75
Sl - 76.34
Tp - 80.21
Our Risk - 1%
Start protection of your profits from lower levels
❤️ Please, support our work with like & comment! ❤️

USOIl ANAYLSISUSOIL Forecast --------------------------------------------------------
Dear Traders, USOIL is moving in downtrend channel, and rejected from the last support zone, we need breakout for the previous weekly low then the next oil target will be lower to 72/71 zone, or to go long we need to breakout the downtrend channel with more confirmations to be determined later.

USOIL Will Grow! Long!
Take a look at our analysis for USOIL.
Time Frame: 1D
Current Trend: Bullish
Sentiment: Oversold (based on 7-period RSI)
Forecast: Bullish
The price is testing a key support 78.14.
Current market trend & oversold RSI makes me think that buyers will push the price. I will anticipate a bullish movement at least to 82.95 level.
P.S
Overbought describes a period of time where there has been a significant and consistent upward move in price over a period of time without much pullback.
Like and subscribe and comment my ideas if you enjoy them!

USOil short term Bullish and long term Bearish**Monthly Chart**
USOil last monthly candle created a swing high with a Ring high formation which indicates a continuation of the bearish trend as it bounced from a key level at around 87.60. This month the price opened from the low of the previous candle and continues to move lower. The next level is around 70.00 and then 66.60.
**Weekly Chart**
The last weekly candle closed bearish which has created a different opinion on whether USOil price might continue moving lower after breaking the soft support level or bounce from it at around 75.90.
**Daily Chart**
I am seeing short-term bullish to break the equal highs above 80.00 level before continuing the move lower. Therefore, my long-term bias is still bearish for USOil.
The plan for this week. I will only react near the low and high of the levels that I marked. Plus I will look for a confirmation candle (some calls it insurance candle).
