USDWTI trade ideas


USOIL BEARISH BIAS RIGHT NOW| SHORT
Hello,Friends!
USOIL uptrend evident from the last 1W green candle makes short trades more risky, but the current set-up targeting 80.46 area still presents a good opportunity for us to sell the pair because the resistance line is nearby and the BB upper band is close which indicates the overbought state of the USOIL pair.
✅LIKE AND COMMENT MY IDEAS✅

WTI Oil H4 | Falling to 50% Fibonacci supportWTI oil (USOIL) is falling towards an overlap support and could potentially bounce off this level to climb higher.
Buy entry is at 82.33 which is an overlap support that aligns close to the 50.0% Fibonacci retracement level.
Stop loss is at 80.50 which is a level that lies underneath a pullback support.
Take profit is at 84.67 which is an overlap resistance.
High Risk Investment Warning
Trading Forex/CFDs on margin carries a high level of risk and may not be suitable for all investors. Leverage can work against you.
Stratos Markets Limited (www.fxcm.com):
CFDs are complex instruments and come with a high risk of losing money rapidly due to leverage. 68% of retail investor accounts lose money when trading CFDs with this provider. You should consider whether you understand how CFDs work and whether you can afford to take the high risk of losing your money.
Stratos Europe Ltd, previously FXCM EU Ltd (www.fxcm.com):
CFDs are complex instruments and come with a high risk of losing money rapidly due to leverage. 70% of retail investor accounts lose money when trading CFDs with this provider. You should consider whether you understand how CFDs work and whether you can afford to take the high risk of losing your money.
Stratos Trading Pty. Limited (www.fxcm.com):
Trading FX/CFDs carries significant risks. FXCM AU (AFSL 309763), please read the Financial Services Guide, Product Disclosure Statement, Target Market Determination and Terms of Business at www.fxcm.com
Stratos Global LLC (www.fxcm.com):
Losses can exceed deposits.
Please be advised that the information presented on TradingView is provided to FXCM (‘Company’, ‘we’) by a third-party provider (‘TFA Global Pte Ltd’). Please be reminded that you are solely responsible for the trading decisions on your account. There is a very high degree of risk involved in trading. Any information and/or content is intended entirely for research, educational and informational purposes only and does not constitute investment or consultation advice or investment strategy. The information is not tailored to the investment needs of any specific person and therefore does not involve a consideration of any of the investment objectives, financial situation or needs of any viewer that may receive it. Kindly also note that past performance is not a reliable indicator of future results. Actual results may differ materially from those anticipated in forward-looking or past performance statements. We assume no liability as to the accuracy or completeness of any of the information and/or content provided herein and the Company cannot be held responsible for any omission, mistake nor for any loss or damage including without limitation to any loss of profit which may arise from reliance on any information supplied by TFA Global Pte Ltd.
The speaker(s) is neither an employee, agent nor representative of FXCM and is therefore acting independently. The opinions given are their own, constitute general market commentary, and do not constitute the opinion or advice of FXCM or any form of personal or investment advice. FXCM neither endorses nor guarantees offerings of third-party speakers, nor is FXCM responsible for the content, veracity or opinions of third-party speakers, presenters or participants.


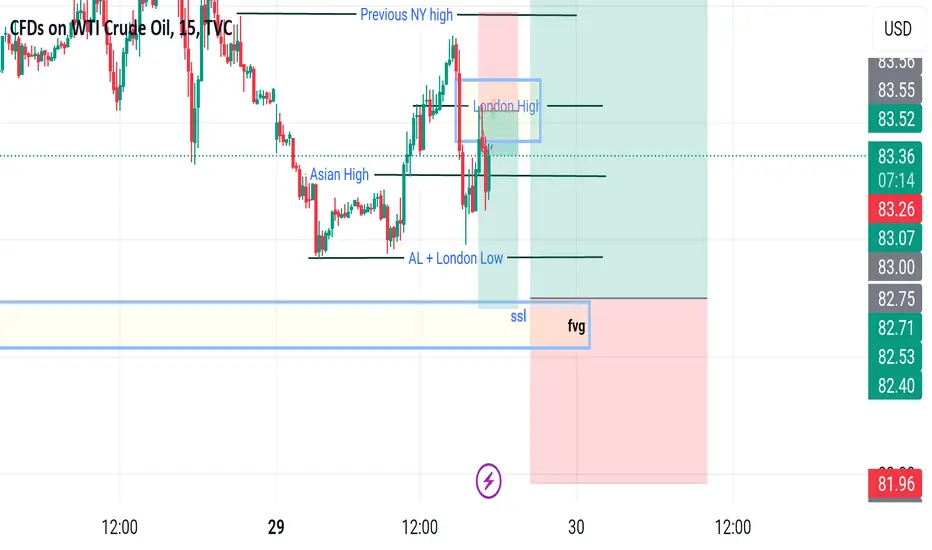
US OIL Earlier during the day we got raids on asian and London highs. Got a sell at the beginning of the NY am session targeting the Asian and London lows.
We now waiting for a sweep on those lows being pulled by an imbalance on the HTF 1hr so we can get potential buys targeting a break of structure to the upside in the trend continuation.
NB. Wait for sweeps and choch to enter buy.
OIL - WTI 4H BullishWTI Oil has indeed finished its second leg and retracted back to a significant order block zone.
This is often a signal for potential accumulation before another ascent.
Based on current patterns, it's poised to climb back up towards the previous decline pivot, setting up an interesting play for those watching the oil markets.

WTI OIL 1st 4H Death Cross in 7 months. Will it turn bearish?WTI Oil (USOIL) made a solid (Higher) Low at the bottom of the Channel Up pattern and started rising as we discussed on our previous idea (April 22, see chart below):
We now need to take it a time-frame lower to 4H as on Friday the market formed the first 4H Death Cross (4H MA50 crossing below the 4H MA200) in almost 7 months (since October 10 2023). This has the capacity to invalidate the current 4-month bullish trend but only if Oil closes a 1D candle below the 1D MA50 (red trend-line).
As long as it doesn't, we remain bullish on WTI, targeting 94.00, which is at the top (Higher Highs trend-line) of the Channel Up and marginally below the 2.0 Fibonacci extension, which is where the previous Higher High peaked.
At the same time, this is where the the previous Channel Up of July - September 2023 made the symmetrical Higher High, relative to the current proportion. As you can see, there is a strong degree of symmetry between the two fractals, even in terms of RSI, with the only notable difference (which as mentioned can be critical), being the 4H Death Cross.
If the price does close that 1D candle below the 1D MA50, we will take the loss on the buy and go short instead, targeting 78.00 (just above Support 1).
-------------------------------------------------------------------------------
** Please LIKE 👍, FOLLOW ✅, SHARE 🙌 and COMMENT ✍ if you enjoy this idea! Also share your ideas and charts in the comments section below! This is best way to keep it relevant, support us, keep the content here free and allow the idea to reach as many people as possible. **
-------------------------------------------------------------------------------
💸💸💸💸💸💸
👇 👇 👇 👇 👇 👇

Crude oil longCrude oil making bullish price action according to dow theory on H1, long entry on 50% fib retracement, stop loss beneath previous higher low.

OIL COMEBACK?! OPEC cut more of supply??hello everyone,
watch the lvl 83.35; 83 ; 82.27 these are support.
we will see oil higher in this week? more supply cut from OPEC?
(please dont risk more than 2% in trade)
watch your risk management. Good Luck.
i try to always we will keep you all updated . Please don't forget to like, comment and follow to support me, i really appreciate you support !
Goodluck
i'll help you to have a great trade.
Please using good money management.
dont take any emotional trade.
Note:
Dont risk more than 0.2% on trending market
Dont risk more than 1% on ranging market
Wish good luck for all people.
Please help support me by Clicking like button, and if you like my ideas please follow me and support me. i Relly Appreciate it!
i'll make more and more great analysis if this chanel grows.
on Gold, eurusd, gbpusd and oil specially.
what do you think?
please comment and rate below.
Thankyou.

USOILIs USOIL exhausting at resistance zone?
As the price is been on high bull run but now it seems like price is lacking bullish momentum after printing double top pattern at resistance level and bearish divergence( on lower time frame) suggesting the sell pressure is about to start.
If the bears took control , the 1st target could be 82
What you guys think of it?

Crude Oil Bearish Harmonics AB=CDCrude Oil is Bearish Soon because the flag pattern and Harmonics AB=CD is performed in 4H chart.

Approaching pullback support at 38.2% Fibonacci retracementWTI oil (XTI/USD) is falling towards the pivot. Could this commodity potentially stall around this level before reversing to bounce higher towards the 1st resistance?
Pivot: 81.38
1st Support: 77.77
1st Resistance: 85.57
Risk Warning:
Trading Forex and CFDs carries a high level of risk to your capital and you should only trade with money you can afford to lose. Trading Forex and CFDs may not be suitable for all investors, so please ensure that you fully understand the risks involved and seek independent advice if necessary.
Disclaimer:
The above opinions given constitute general market commentary, and do not constitute the opinion or advice of IC Markets or any form of personal or investment advice.
Any opinions, news, research, analyses, prices, other information, or links to third-party sites contained on this website are provided on an "as-is" basis, are intended only to be informative, is not an advice nor a recommendation, nor research, or a record of our trading prices, or an offer of, or solicitation for a transaction in any financial instrument and thus should not be treated as such. The information provided does not involve any specific investment objectives, financial situation and needs of any specific person who may receive it. Please be aware, that past performance is not a reliable indicator of future performance and/or results. Past Performance or Forward-looking scenarios based upon the reasonable beliefs of the third-party provider are not a guarantee of future performance. Actual results may differ materially from those anticipated in forward-looking or past performance statements. IC Markets makes no representation or warranty and assumes no liability as to the accuracy or completeness of the information provided, nor any loss arising from any investment based on a recommendation, forecast or any information supplied by any third-party.

THE DAWN OF USOILThe most controversial natural gas FX:USOIL has been on a path of confusion for me, and I'll explain below.
Firstly, under technical knowledge, USOIL is in a scenario of compression!!! as it is trending shy outside of its major ascending trend line and a break of the descending major trendline!
These guys alone are big problems and have enormous power to alter and violate any analysis of ours whatsoever. So, from a technical stand point? I'll do nothing until we've either broken above or below the immediate and current key level and below or above any of these trendlines!!
Price has enough rooms to either directions so trust me, the wait is beneficial and not a waste!
Lastly, The influence of the current world balance uncertainty and situations (middle east tensions) This is a natural gas so believe me! fundamentals would have a hand in any desired direction. Failure to identify a direction would cost you more than a dollar.
TRADE CAREFULLY AND CLICK WITH REASONS!
FOREX CRUISERS!

USOIL BUYING MORE TILL HIT 123$ HELLO FRIENDS
As I can see USOIL has Break the triangle zone and now trading above 80$ as we said in our previous analysis, we are more bullish on Gold with Technical and Fundamentals views as we all know the War is still going on and US Gov supporting all his allies with billions of $ and there is no Ceasefire in near term. Iran is now entered in this War Plan which is not good for Commodities and Energy sectors.. Investors always look for safe haven in these term and conditions inflation to 2% is now seems a hard Goal. OIL Supply and Demand can creat volotility in markets as we can see Asian regions higher Demand
Friends if we see technically view on USOIL we can see oil breakout on Triangle Zone on Daily Chart and looking for more bullish moves. Time Depends
Friends its just an trade idea share Ur thoughts with us it helps many other traders.
Stay tuned

usoil will further push upsideHello Traders
In This Chart XTIUSD HOURLY Forex Forecast By FOREX PLANET
today XTIUSD analysis 👆
🟢This Chart includes_ (XTIUSD market update)
🟢What is The Next Opportunity on XTIUSD Market
🟢how to Enter to the Valid Entry With Assurance Profit
This CHART is For Trader's that Want to Improve Their Technical Analysis Skills and Their Trading By Understanding How To Analyze The Market Using Multiple Timeframes and Understanding The Bigger Picture on the Charts

83.75 to survive it's dancing in supply blue - .236/79.13 -382/88.74 mid fib 83.95 . Sun open could try and cross 83.75 and tease 85 otherwise bear would confirm March 83.06 support -mthly grain green / 82.5 numerical . GL watch for chop keep your stick on the ice . Boosts appreciate

83.75 to survive it's dancing in supply blue - .236/79.13 -382/88.74 mid fib 83.95 . Sun open could try and cross 83.75 and tease 85 otherwise bear would confirm March 83.06 support -mthly grain green / 82.5 numerical . GL watch for chop keep your stick on the ice . Boosts appreciated

Hellena | Oil (4H): Long to resistance area of 87.47.Dear Colleagues, at the moment the price has made a strong downward movement. I suppose that the price is in wave "4" and can continue its movement to the support area of 80.22, but I consider only long positions, because the price can make a reversal at once. I recommend to work with pending orders.
The nearest target is the resistance area at 87.47.
Manage your capital correctly and competently! Only enter trades based on reliable patterns!

USOILHello dear traders, USOIL.
We are in a long-term downtrend in our daily analysis. I am waiting for the price to reach the extreme order block to enter a long-term selling position. Liquidity and price reaching the daily order block will create strong selling pressure, leading to a trend change. I have drawn a simple
and clear chart of oil that is easily understandable. Good luck
# Smart Money Concepts,
# Liquidity,
# Hunter.

USOIL in continuation of a bull trendExpecting price to reach the demand zone. The price is still in its discounted price.. Looking for a Long here

Crude oil trend analysis next week
Looking at the daily chart of crude oil, it tested support near 80.7 at the beginning of the week and then strengthened. It can be seen that the support below the 80.3 mark is very strong. At present, crude oil has stood firmly above 83, and the trend is still strong. It is expected to continue in the future. On the upside, the upper resistance is near the 86 mark.
Looking at the four-hour line, it fell to around 80.7 at the beginning of the week and then rebounded to around 83.7. Then fluctuate and adjust. It rose strongly near the 82 mark on Thursday, reaching a maximum of around 83.8. There is expected to be room for further growth. In terms of intraday operations, follow the trend and go long. You can mainly refer to the 83-83.3 area to advance more and look above 85. Overall, the crude oil operation ideas next week will be mainly low-level declines and high-altitude rebounds, supplemented by high-altitude rebounds. The upper short-term focus is on the first-line resistance of 84.5-85.0, and the lower short-term focus is on the 82.5-82.0 first-line support.

USOIL Will Go Higher! Long!
Take a look at our analysis for USOIL.
Time Frame: 3h
Current Trend: Bullish
Sentiment: Oversold (based on 7-period RSI)
Forecast: Bullish
The price is testing a key support 84.08.
Current market trend & oversold RSI makes me think that buyers will push the price. I will anticipate a bullish movement at least to 85.12 level.
P.S
Overbought describes a period of time where there has been a significant and consistent upward move in price over a period of time without much pullback.
Like and subscribe and comment my ideas if you enjoy them!
