CRUDE OIL SELLI want to try this sell, in my opinion probable reversal.
The real key regardless of any strategy is to have a decent risk/reward .
You win and you lose , so be cautious.
No financial advice, do your own research
USOILSPOT trade ideas

Crude Oil: Potential Bullish ShiftOn 4h timeframe, WTI Crude Oil is printing a falling wedge pattern followed by Bearish Divergence on RSI. Potential Reversal Zone is predicted using the AB=CD pattern.
TRADE PLAN
Buy on breakout on previous Lower High.
Stop Loss on previous Lower Low
TP1, TP2 with RRR of 1:1 and 1:2 respectively

Oil Prices Signal Further Declines Oil Prices Signal Further Declines
Oil prices have exhibited a downward trajectory, breaching the pivotal $77.5 mark. This breach has set the stage for potential further declines.
The first significant support level is anticipated near the $76.8 zone, followed closely by a more robust floor around the $76.
Investors and traders are advised to exercise caution due to the ongoing conflict in the Middle East.
The geopolitical tensions have historically been a catalyst for market fluctuations, and the current situation is no exception.
You may find more details in the chart!
Thank you and Good Luck!
❤️PS: Please support with a like or comment if you find this analysis useful for your trading day❤️

USOILThe AB=CD pattern is a harmonic pattern in technical analysis that helps traders identify potential reversal points in the market. It consists of four price points, forming specific geometric shapes. The pattern is characterized by two equivalent price legs (AB and CD) separated by two other legs (BC and CD), where the CD leg retraces a specific Fibonacci ratio of the AB leg.
A bullish AB=CD pattern typically forms during a downtrend and signals a potential reversal to the upside. Traders look for specific Fibonacci ratios between the legs to confirm the validity of the pattern. Once identified, traders might use this pattern to enter long positions, anticipating a bullish move in the price.
As always with technical analysis, it's essential to combine pattern recognition with other indicators and analysis techniques for confirmation and risk management.

WTI Head and Shoulders formingStarted watching the H&S form on WTI. It's still early but has been worth keeping an eye on it.

***** USOIL UNIQUE IDEA *****#USOIL
UPDATE
Hey team hope you all are enjoying our professionals market analysis. We analyze the market deeply. Now we are here to discuss about USOIL. USOIL is exactly on the way as predicted. Already in good gain. We can see here a small support level. But maximum Chances it will break this support level. If it breaks this level we can Price around 70 soon.
Always trade with Confidence ✍

WTI ShortLate breakout from daily head and shoulders. Current entry, break of 4hr support level with SL behind 4hr resistance.
Target at H&S MPO or next daily support
Going inline with Oil Inventories higher and Rig Count higher

USOIL BULLISH CANDLE Hey there on 1htF the USOIL will see opportunity from upside 75 so we can see now sell side and then will go upside
USOIL is approaching the daily uptrendHey Traders, in today's trading session we are monitoring USOIL for a buying opportunity around 77.70 zone, USOIL is trading in an uptrend and currently is in a correction phase in which it is approaching the trend at 77.70 support and resistance area.
Trade safe, Joe.

Falling towards pullback support, could it bounce from here?WTI oil (XTI/USD) is falling towards the pivot and could bounce to the 1st resistance.
Pivot: 77.21
1st Support: 75.98
1st Resistance: 80.08
Risk Warning:
Trading Forex and CFDs carries a high level of risk to your capital and you should only trade with money you can afford to lose. Trading Forex and CFDs may not be suitable for all investors, so please ensure that you fully understand the risks involved and seek independent advice if necessary.
Disclaimer:
The above opinions given constitute general market commentary, and do not constitute the opinion or advice of IC Markets or any form of personal or investment advice.
Any opinions, news, research, analyses, prices, other information, or links to third-party sites contained on this website are provided on an "as-is" basis, are intended only to be informative, is not an advice nor a recommendation, nor research, or a record of our trading prices, or an offer of, or solicitation for a transaction in any financial instrument and thus should not be treated as such. The information provided does not involve any specific investment objectives, financial situation and needs of any specific person who may receive it. Please be aware, that past performance is not a reliable indicator of future performance and/or results. Past Performance or Forward-looking scenarios based upon the reasonable beliefs of the third-party provider are not a guarantee of future performance. Actual results may differ materially from those anticipated in forward-looking or past performance statements. IC Markets makes no representation or warranty and assumes no liability as to the accuracy or completeness of the information provided, nor any loss arising from any investment based on a recommendation, forecast or any information supplied by any third-party.

0506-0511 USOIL Weekly OutlookHello traders,
USOIL has been bearish since early of April.
It got one week correction and turn down to drop hardly again last week.
On the left weekly chart, last week Strong bearish candle cross EMAS down to a new low. This is a weekly bearish signal for us.
On the right 4H chart, seems like it stops dropping by reaching FIBO EXT 1.27-1.414 support zone.
This could be a sign for sideways price action like what I marked out on the chart.
Price could turn down to a new low after this price action unless war in the earth happen soon in this week.
GOOD LUCK ON THIS WEEKLY OUTLOOK.
LESS IS MORE!

WTI: Long-Term Buy Signals Remain StrongHello Everyone,
WTI is presently examining the monthly and daily support levels, while the weekly support appears robust. Additionally, it seems that the 1-year pivot point (PP) has offered ample support to initiate an upward movement in price. WTI maintains its position as a strong long-term investment, provided that the price stays above the 1-year PP.
TradeWithTheTrend3344

CRUDE HEADING TO $75.00 WTIGIVEN THE CURRENT MACRO ENVIROMENT WHERE UNEMPLOYMENT HAS STARTED TO RISE AND GDP READING WEAKER THAN EXPECTED, OPEC ALLIES KEEPS CUTING OUTPUT AND WEAKER DEMAND EXPECTATIONS, OIL MAY BE HEADING TO 75USD PER BARREL AS SOON AS THE NEXT WEEK.
BULL THESIS:
- Yields start to rise as bets on FED hike
- Strong economic data
- Middle east conflict escalates
- East Europe Crissis escalete
- Crude facilities compromised
BEAR THESIS:
- Yields keeps falling as weaker macro data show up
- Crack spreads lowering
- Israel vs. Hammas cease-fire achieved
- Russia hold its positions on Ukraine, Ukraine doesn't reply attacks
- Crude extraction and refining facilities not compromised

OIL BUYAgain an opportunity to expect oil to rise.
The exchange rate rebounds from the support-resistance level.

Crude Oil long set up (continued)I believe that the lows are in.
We should find support in this area here for a bounce.

USOIL TIME TO REBOUNDAs you see in the chart, the price is retest the trend line and the fib extension 161.8 zone.
We'll expect rebound soon to 82.10

Expectation on WTI (7/5/24 - 10/5/24)7/5/24 - As we can see, WTI could potentially done its bids and expecting it to starts offer out at this point. With the confluence of it reaching going back to 50MA. The only way WTI will offer out is the breach 50MA with volume. If it rejected it and price heading back to double bottom, I will see as my expectation of WTI going up invalid.
All the best traders. - Nav

The Big picture of Oil ,short therm 73-75 and then bullish On the big picture of Oil chart it should come down to 73 usd (200ma monthly chart) ,the lowest point ,but I think it will bounce up from 74-75 (200 ma weekly chart) and then all the way to 100 usd by September ,with the first rate cut it will go to at least 115 usd...this is just my scenario , no investment advice..I am playing my own money ...DYOR

U.S. crude oil inventories are forecasted to grow by 1.2 mU.S. crude oil inventories are forecasted to grow by 1.2 million barrels for the week ending May 3, a decrease from the 7.3 million barrel surge reported in the prior week, according to strategists at Macquarie in a recent Monday briefing.
The overall U.S. crude balance is projected to be considerably looser than previously expected.
technically:
The price already dropped as we mentioned in the previous idea, and still trading at the bearish zone to reach 75.35.
so the bearish trend suggestion will continue as long as trades under 78.78 toward 76.60 and 75.35
the price will move between 80.73 and 75.35 for this week
Pivot line: 78.78
Support lines: 76.60, 75.35, 69.78
Resistance lines: 80.73, 82.24, 83.75
PREVIOUS IDEA:

USOIL buy (240pips)USOIL traded creating a new impulse, we could see some pull back forming. FOREXCOM:USOIL FX:USOIL TVC:DXY Price action is observed. This is only a trade idea, use proper risk management. Happy trading

USOIL - He's locking himself in... It appears that we have a good accumulation triangle present.
Remember: Consolidations also have shape, if you are able to see it clearly....
There may be a nice drop coming, so watch for it!!!!!
No fear of success daddy ;)
Keep it simple!
If you like me, don't forget to follow me !!!

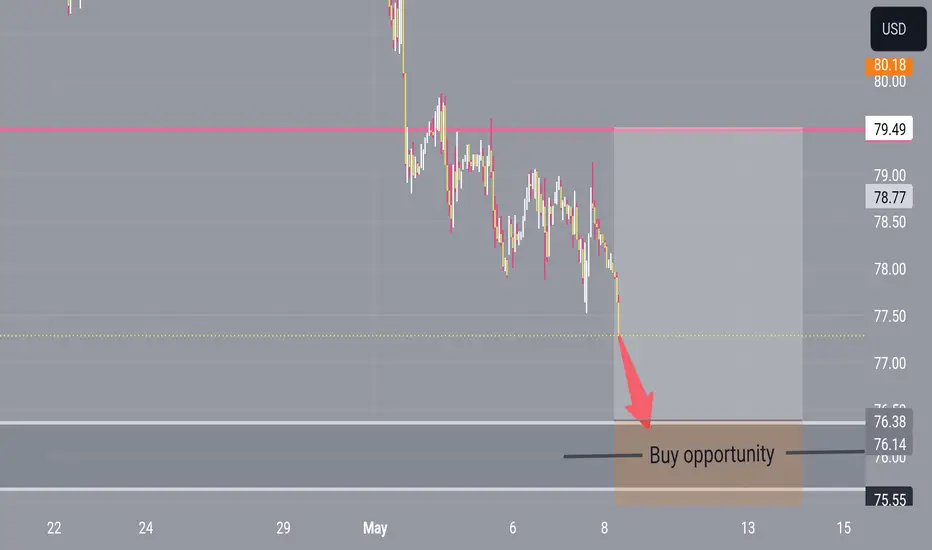
WTI Oil H4 | Pullback support at 61.8% Fibonacci retracementWTI oil (USOIL) is falling towards a pullback support and could potentially bounce off this level to climb higher.
Buy entry is at 77.43 which is a pullback support that aligns with the 61.8% Fibonacci retracement level.
Stop loss is at 75.40 which is a level that lies underneath a pullback support.
Take profit is at 80.18 which is an overlap resistance.
High Risk Investment Warning
Trading Forex/CFDs on margin carries a high level of risk and may not be suitable for all investors. Leverage can work against you.
Stratos Markets Limited (www.fxcm.com):
CFDs are complex instruments and come with a high risk of losing money rapidly due to leverage. 68% of retail investor accounts lose money when trading CFDs with this provider. You should consider whether you understand how CFDs work and whether you can afford to take the high risk of losing your money.
Stratos Europe Ltd, previously FXCM EU Ltd (www.fxcm.com):
CFDs are complex instruments and come with a high risk of losing money rapidly due to leverage. 70% of retail investor accounts lose money when trading CFDs with this provider. You should consider whether you understand how CFDs work and whether you can afford to take the high risk of losing your money.
Stratos Trading Pty. Limited (www.fxcm.com):
Trading FX/CFDs carries significant risks. FXCM AU (AFSL 309763), please read the Financial Services Guide, Product Disclosure Statement, Target Market Determination and Terms of Business at www.fxcm.com
Stratos Global LLC (www.fxcm.com):
Losses can exceed deposits.
Please be advised that the information presented on TradingView is provided to FXCM (‘Company’, ‘we’) by a third-party provider (‘TFA Global Pte Ltd’). Please be reminded that you are solely responsible for the trading decisions on your account. There is a very high degree of risk involved in trading. Any information and/or content is intended entirely for research, educational and informational purposes only and does not constitute investment or consultation advice or investment strategy. The information is not tailored to the investment needs of any specific person and therefore does not involve a consideration of any of the investment objectives, financial situation or needs of any viewer that may receive it. Kindly also note that past performance is not a reliable indicator of future results. Actual results may differ materially from those anticipated in forward-looking or past performance statements. We assume no liability as to the accuracy or completeness of any of the information and/or content provided herein and the Company cannot be held responsible for any omission, mistake nor for any loss or damage including without limitation to any loss of profit which may arise from reliance on any information supplied by TFA Global Pte Ltd.
The speaker(s) is neither an employee, agent nor representative of FXCM and is therefore acting independently. The opinions given are their own, constitute general market commentary, and do not constitute the opinion or advice of FXCM or any form of personal or investment advice. FXCM neither endorses nor guarantees offerings of third-party speakers, nor is FXCM responsible for the content, veracity or opinions of third-party speakers, presenters or participants.

Potential bullish bounce?WTI oil (XTI/USD) is trading close to a pullback support that has been identified as the pivot. Could this commodity potentially bounce off this level to climb higher towards the 1st resistance?
Pivot: 78.39
1st Support: 77.21
1st Resistance: 80.10
Risk Warning:
Trading Forex and CFDs carries a high level of risk to your capital and you should only trade with money you can afford to lose. Trading Forex and CFDs may not be suitable for all investors, so please ensure that you fully understand the risks involved and seek independent advice if necessary.
Disclaimer:
The above opinions given constitute general market commentary, and do not constitute the opinion or advice of IC Markets or any form of personal or investment advice.
Any opinions, news, research, analyses, prices, other information, or links to third-party sites contained on this website are provided on an "as-is" basis, are intended only to be informative, is not an advice nor a recommendation, nor research, or a record of our trading prices, or an offer of, or solicitation for a transaction in any financial instrument and thus should not be treated as such. The information provided does not involve any specific investment objectives, financial situation and needs of any specific person who may receive it. Please be aware, that past performance is not a reliable indicator of future performance and/or results. Past Performance or Forward-looking scenarios based upon the reasonable beliefs of the third-party provider are not a guarantee of future performance. Actual results may differ materially from those anticipated in forward-looking or past performance statements. IC Markets makes no representation or warranty and assumes no liability as to the accuracy or completeness of the information provided, nor any loss arising from any investment based on a recommendation, forecast or any information supplied by any third-party.
