Oil buy 2nd aprilWTI oil buy off H4 ob ,
just holding and lets see where this gets
first post on tradingview for years lol
oil up bby
USOILSPOT trade ideas

US OIL shows Divergence on 1 hour chartThe one-hour chart for US OIL shows divergence, suggesting a forthcoming bearish trend.
US OIL (WTI) MARKET ANALYSE. (READ CAPTION)Technical Analysis:
Incorporate key trading indicators such as the double line resistance breakout, pullback support, and demand zone analysis to assess price movements in the US Oil market. Identify channels and trendlines to spot potential breakout or breakdown points, confirming with volume and momentum indicators like relative strength index (RSI) and moving average convergence divergence (MACD). Additionally, monitor the US Dollar Index (DXY) for its impact on oil prices, considering its inverse correlation. Stay vigilant for opportunities at support and demand zones, utilizing these levels for entry and exit points in your trading strategy.
If you like this idea please support with boost comment and follow thanks for with us.

Will usoil rebound after opening high?
During the three days of market closure, Russia further cut production and the geopolitical situation escalated again, which led to today's crude oil opening rising and reaching new highs.
Crude oil consolidated on the K-line last week, and was gathering momentum to consolidate at a high level. The space recovered, but the short-term long and short kinetic energy was insufficient. The daily retracement space was not large, and the sustainability was not strong. While it was gaining momentum, it just lacked a little unilateral momentum. Yesterday, it stabilized slightly near the middle track of Bollinger Band. The middle track and the upward trend line 80.0-80.50 are still the key support points. The low and long thinking can be maintained before falling. In the 4-hour chart, it dipped for the second time and stabilized near 80.50. It had also formed support here at the beginning of the week and fluctuated upward. It is currently continuing to gather momentum around the low point, but the unilateral momentum is insufficient and it has entered a see-saw consolidation. The top short-term focus is on the resistance of 84.5-85.0, and the bottom is focused on the first-line support of 82.0-81.5
oil:sell84.5-85
tp:84-83.5
sl:85.5

OIL May 85 oil test in the coming weeksOIL May 85 oil test in the coming weeks
Technical Analysis:
The price of oil broke out of a strong bullish channel.
The price reached 80.80 on 01-Mar-2024 and during all these days it created the second bullish channel pattern which lasted for 11 days.
The breakout from the pattern turned out to be solid, increasing the chances of oil testing 85$ per barrel in the coming weeks.
This is also related to an increase in the demand for oil in the market that OPEC is already speculating.
You may find more details in the chart!
Thank you and Good Luck!

OILAnyone else thinks oil is about to pop off?
Strong let level with a push to the upside followed by a retracement. Now waiting for the buyers to take control here and drive price up.

Long oilan iranian general has just been killed by israel, the geopolitical conflict is escalating, my target is at 90 usd per barrel

WTIUSD - Possible Bearish Trend DevelopingCrude Oil is turning bearish as it has made lower low. One should wait for proper lower high as well. Trend is Bullish on daily timeframe though.

CRUDE OIL SELLI want to try this sell, in my opinion probable reversal.
The real key regardless of any strategy is to have a decent risk/reward .
You win and you lose , so be cautious.
No financial advice, do your own research.
USOIL is at resistance, expecting a sell here SELL US OIL @ 83.8 with sl of 84.8 and Target of 81 in next few session.

USOILThis is my opinion with technical analysis
Please respect the following rules:
1- Risk management .
2. Have your own strategy.

LCrude=VUCA: Resurgence of Volatility without StrengthVUCA= volatility, uncertainty, complexity, and ambiguity
During the Asian session, the price of LCRUDE crude oil experienced fluctuations, ranging between $82.93 and $83.05, with a slight decrease of -0.45%. However, with the opening of the European market, the price began to recover. Factors such as expectations of cuts from the Organization of the Petroleum Exporting Countries and its allies (OPEC+), attacks on Russian refineries and relatively positive Chinese manufacturing data boosted the price of crude oil, as well as gold, during the start of the European session.
With several markets closed due to the Easter holidays, low trading volume is expected. Both West Texas and Brent have seen increases for the third consecutive month, with Brent rising above $85 a barrel since mid-March. This is partly due to OPEC+'s commitment to extend production cuts until the end of June, which could reduce crude supply in the northern hemisphere during the summer. Already on Friday, Russia's Deputy Prime Minister Alexander Novak stated that its oil companies will focus on reducing their production rather than expanding exports during the second quarter of the year, in order to share those cuts evenly with other member countries.
On the technical side, the price of crude oil has shown an upward trend since the end of March, driven by divergences in Russian production caused by the Ukrainian conflict and the demand for U.S. reserves. At the European opening, the price has turned around, devaluing to $82.68 per barrel. Certainly crude oil is in a trading zone frequented on several occasions this year. At the moment the chart is trying to pierce the top of the current range, and with such a low trading level, there could be a lackluster rally due in part to the impact of news, just as it did during the Asian session. Conversely, the price bell is showing a control price (POC) at $81.04 which could represent that inability to move higher due to the lack of strong hands pushing the "Bulls" in the market during the holidays. suggesting that crude oil could continue to fluctuate in a range between $83.08 and $79.80. We will have to be vigilant, as although the news presents a theoretical bullish pressure, the technical elements show us a strong bearish pressure that seems to prevent the effect of the news from materializing.
Ion Jauregui - AT Analyst
*******************************************************************************************
The information provided does not constitute investment research. The material has not been prepared in accordance with the legal requirements designed to promote the independence of investment research and such should be considered a marketing communication.
All information has been prepared by ActivTrades ("AT"). The information does not contain a record of AT's prices, or an offer of or solicitation for a transaction in any financial instrument. No representation or warranty is given as to the accuracy or completeness of this information.
Any material provided does not have regard to the specific investment objective and financial situation of any person who may receive it. Past performance is not reliable indicator of future performance. AT provides an execution-only service. Consequently, any person acing on the information provided does so at their own risk.

Critical moment!Price touched top of long term channel down and reverted moving downward
If price cannot get quickly above resistance 83,07$ then a down move to 81,59$ (4H SMA50) will probably occur
A bearish engulfing candle also completing on 4H

USOIL Is Bearish! Sell!
Take a look at our analysis for USOIL.
Time Frame: 9h
Current Trend: Bearish
Sentiment: Overbought (based on 7-period RSI)
Forecast: Bearish
The market is trading around a solid horizontal structure 83.06.
The above observations make me that the market will inevitably achieve 80.08 level.
P.S
Overbought describes a period of time where there has been a significant and consistent upward move in price over a period of time without much pullback.
Like and subscribe and comment my ideas if you enjoy them!

XTI/USD 2024 YEARLY OUTLOOK WITH TARGETSTaking into consideration my fundamental outlook on USD for 2024 including time cycles i have calculated which are not included in this chart overview. I anticipate bearish momentum on XTI/USD. i first forecast my fundamental position for USD and then align that with my cycles does it match and make sense? if yes i will then proceed to match my technicals to align with this theory.
I am also forecasting years in advanced to make sure the present year fits the story
Why is it important to establish a yearly bias before anything else?
All other trades can be based off of this information and improve your trading by only taking trades in the direction of the yearly bias as the momentum for the desired yearly direction will be cleaner.
If you would like to know more about my fundamental outlook and pairing it together with time cycles and technical projections please give me a follow as i will be posting regular content on many pairs.
Thank you for reading see you at the next one
THE BEARISH TRADER
ICMARKETS:XTIUSD

USOIL IN THE FUTUREOil prices are sliding nearly 2% on Friday with the United States hitting fresh highs in Oil production, added with Iraq announced the reopening of a refinery that was closed for a decade and amid expectations that OPEC+ countries won’t opt for big production cuts. President Of Rapidan Energy and former White House official Bob McNally said that OPEC+ said on Bloomberg that the group of Oil-producing countries will likely need to extend its voluntary production cuts beyond the first quarter of the year, but that any further big cuts in supply aren’t expected.
Meanwhile, the US Dollar Index (DXY) is retreating for the week, consolidating its losses. The Greenback is losing ground as equities are having a field day, with several indexes trading at fresh all-time highs. Traders look to next week, when nearly every day features a big market-moving data point which has the potential to move the needle for the DXY US Dollar Index.

CL OIL H4 1 April 2024🛢 CL OIL, H4 🛢 1 April 2024
Oil prices edged higher as concerns about a global supply surplus eased, supported by lower Russian output and ongoing production curbs by major oil-producing nations. Russia's decision to deepen production cuts and the reduction in fuel supplies following attacks on Russian fuel refineries by Ukraine contributed to market optimism. Investors await cues from the upcoming meeting of the Joint Monitoring Ministerial Committee of OPEC amid ongoing geopolitical risks.
Oil prices are trading higher, while currently testing the resistance level. Suggesting the commodity might enter overbought territory.
Resistance level: 83.15, 85.45📉
Support level: 80.20, 78.00📈

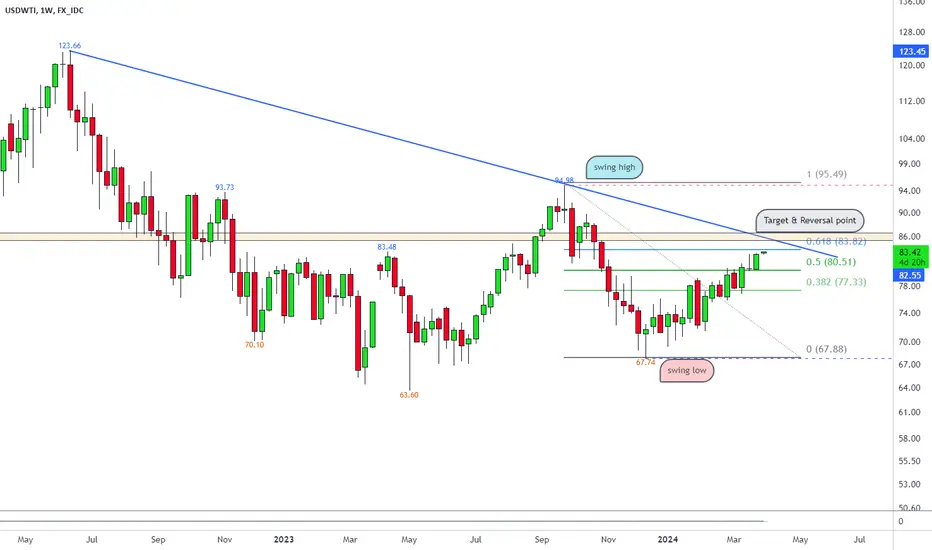
Crude Oil - At Critical LevelUptrend at Golden ratio 0.5 to 0.618
Trendline and resistance zone matching with 0.1618 level
Waiting for reversal pattern at $84.5 - $85.5
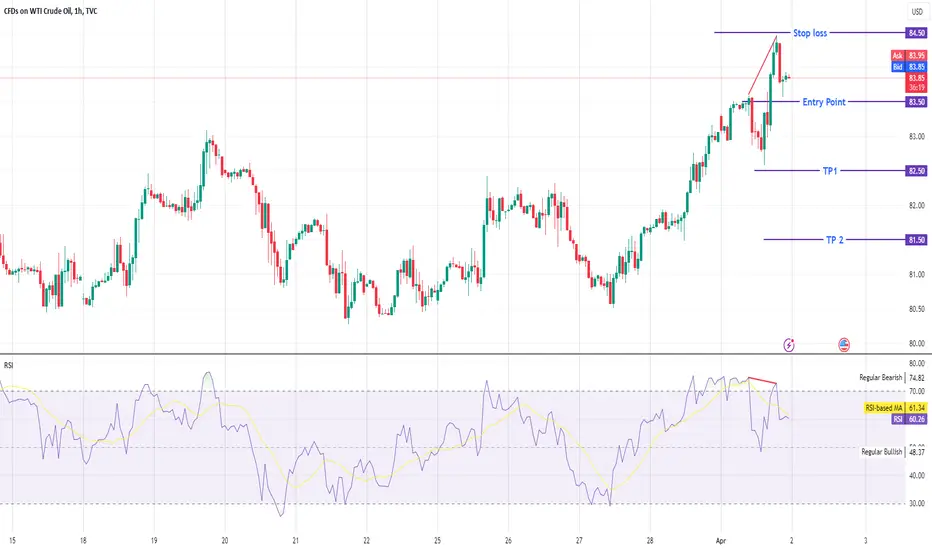
"Is the US Oil Market on the Brink of a Transformation?” 🛢️📈Ahoy, fellow trader! 🌟 Let's set sail on the high seas of oil trading, where the winds of fortune blow and the waves of volatility crash. 🛢️
**USOIL** (that's WTI Crude Oil for landlubbers) is currently dancing around the **$83** mark like a tipsy sailor at a tavern. 🕺 The resistance levels are like stubborn portcullises guarding the treasure chest: **$83** and **$83.50**. Will our brave oil buccaneers breach these walls and plunder the riches beyond? 🏴☠️
But wait, there's more! 📜 The support levels are our sturdy lifeboats: **$80.30** and **$80.00**. If the ship starts taking on water, these levels might keep us afloat. 🚢
Why is oil suddenly hotter than a dragon's breath? 🐉 Well, the Federal Reserve might just cut interest rates, making the dollar less attractive than a soggy biscuit. Investors, like magpies drawn to shiny things, are eyeing oil hungrily. 🤑

USOIL Trading IdeaBased on Simple Technical Analysis ( Trendline + Support & Resistance )
Risk Disclaimer:
Please be advised that I am not telling anyone how to spend or invest their money. Take all of my analysis as my own opinion, as entertainment, and at your own risk. I assume no responsibility or liability for any errors or omissions in the content of this page, and they are for educational purposes only. Any action you take on the information in these analysis is strictly at your own risk. There is a very high degree of risk involved in trading. Past results are not indicative of future returns. Good luck :-)


The price of the OIL technically bearishThe price of the OIL technically bearish , you need to comment your point of view and hit like if you find my useful for you and keep following me if you want more analysis like this every time.
NOTE : 📬 COMMENT, ✅LIKE AND ☑️ FOLLOW. THIS CAN HELP ME TO ANALYSE THE MARKET MORE EFFICIENTLY FOR YOU.

USOIL Trading Opportunity! SELL!
My dear friends,
Please, find my technical outlook for USOIL below:
The instrument tests an important psychological level 83.06
Bias - Bearish
Technical Indicators: Supper Trend gives a precise Bearish signal, while Pivot Point HL predicts price changes and potential reversals in the market.
Target - 81.28
Recommended Stop Loss - 83.99
About Used Indicators:
Super-trend indicator is more useful in trending markets where there are clear uptrends and downtrends in price.
———————————
WISH YOU ALL LUCK
