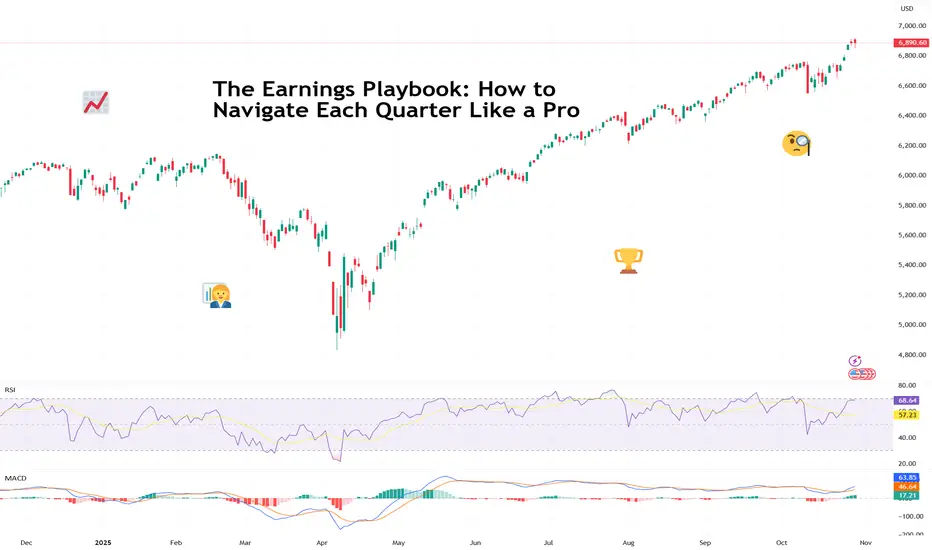
The Earnings Playbook: How to Navigate Each Quarter Like a ProTraders are in the heat of the earnings season and euphoria is sweeping every corner of the market.
The charts twitch, traders stop talking about the Fed for five minutes ( not this week, though ), and online forums turn into a parade of watch-me-trade sessions.
It’s that glorious stretch when companies pop open the books and reveal what’s really been happening behind the scenes.
For professional investors, it’s data heaven. For retail traders, it’s emotional cardio. Stocks can rise 20% on a single upbeat forecast — or plummet before your coffee cools. The trick isn’t just to survive it. It’s to navigate it like a pro.
💼 Know the Seasons (and the Mood Swings)
Earnings season comes four times a year — January, April, July, and October — and each has its own flavor.
Q1 (April): That’s the hangover quarter. Holiday sales meet new-year cost cuts. Traders recalibrate expectations and reality collides with ambition.
Q2 (July): The mid-year checkup. CEOs brag about “momentum,” analysts start sharpening their red pencils. Markets get twitchy.
Q3 (October): The credibility test. Guidance revisions and cautious tones dominate. If the year’s been good, this is where the victory laps start.
Q4 (January): The scoreboard reveal. Everyone tallies their annual wins and losses, and traders begin to bet on who carries the next year’s momentum.
Each cycle has a similar rhythm: hype, reaction, digestion, and speculation. Think of it like a four-act play.
📊 Mind the Gap
One thing to keep in mind whenever you find yourself in the earnings bonanza: the actual numbers matter less than the narrative. ( Looking at you, Oracle NYSE:ORCL )
A company can beat on revenue, miss on profit, and still rally — if the CEO sells a compelling story about the next quarter. Conversely, it can post record earnings and tank because analysts wanted even more.
The pros know to look beyond the headline EPS. They dig into guidance, margins, and segment performance. Is revenue growing because of genuine demand, or just creative accounting? Are margins improving, or did the company quietly cut R&D?
Markets don’t price what’s happened — they price what’s next. That’s especially true for growth stocks like t echnology companies .
🎯 Don’t Chase the Knee-Jerk
Every earnings season has its share of instant overreactions — the “up 10% at open, down 8% by lunch” kind of chaos. That’s when seasoned traders sit back and let volatility do the heavy lifting.
Smart money avoids buying into the frenzy or shorting into despair. Instead, they wait for the second move — when dust settles, algorithms calm down, and humans return to their desks.
🧠 Build Your Own Playbook
To trade earnings season like a pro, you need a plan. Here’s how the veterans prep:
Start early. Check the earnings calendar and mark high-impact names in your portfolio or watchlist.
Study the setup. Look at how the stock’s performed heading into earnings. A big pre-report rally can mean expectations are too high.
Focus on guidance. Earnings beats are old news — future commentary moves markets.
Use position sizing. Never bet the farm on one report. Even the best setups can go sideways.
Don’t forget the macro. Rate cuts, inflation prints, or a stray tweet from the US President can overshadow the best earnings beat.
🕹️ The Big Picture: Earnings as Market GPS
Earnings season is the market’s health check because it tells you which sectors are thriving, which are limping, and how CEOs feel about the future (watch the language: “headwinds” and “volatility” are polite ways of saying buckle up).
Taken together, earnings trends shape the broader narrative — from interest rate expectations to sector rotations. In other words, earnings season is where short-term trading meets long-term investing.
Now go and prepare for the next batch of earnings — Big Tech is on deck this week with Apple NASDAQ:AAPL and Amazon NASDAQ:AMZN reporting today.
Off to you : What’s your strategy this earnings season? Buying the hype or waiting to buy the dip? Share your thoughts in the comments!
Trade ideas
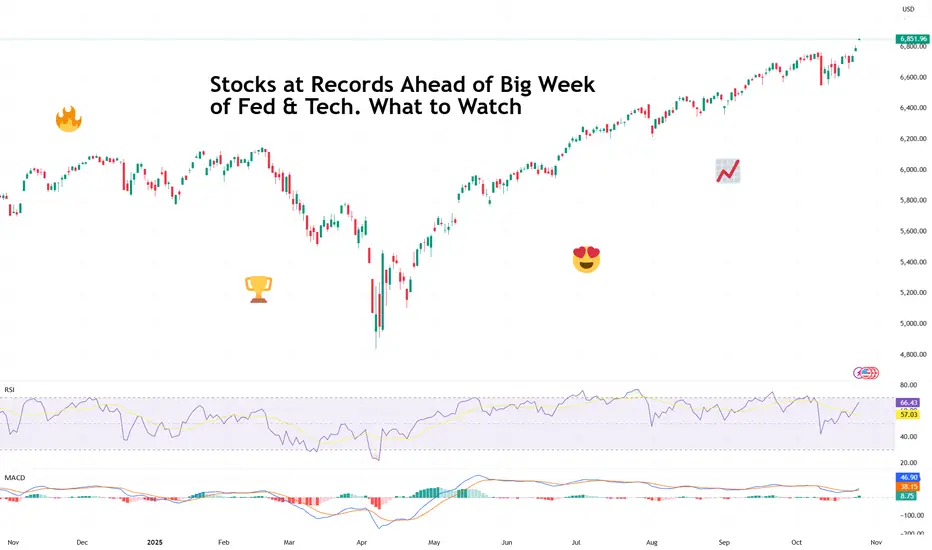
Stocks at Records Ahead of Big Week of Fed & Tech. What to WatchRecord highs, rate-cut optimism, five tech giants on deck — what a time to be a market participant!
It’s Monday, and Wall Street is back doing what it does best — setting new records and pretending not to worry about what comes next.
After a cooler-than-expected inflation print and some diplomatic smiles from Washington and Beijing, all three major indexes are kicking off the week in full throttle.
Last Friday, the Dow Jones Industrial Average TVC:DJI finally closed north of 47,000 for the first time ever, rising 472 points, or 1%.
You know that feeling when you hit every green light on the way to work? That’s what Friday felt like. The S&P 500 SP:SPX climbed 0.8%, and the Nasdaq Composite NASDAQ:IXIC gained 1.2%. Together, the trio ended the week at record highs.
The spark? September’s Consumer Price Index ECONOMICS:USCPI rose 3.0%, slightly below the 3.1% expected. Traders took that as a nod from the economy that the Federal Reserve can keep easing off the monetary brakes.
Odds of at least a half-point in rate cuts by year-end jumped to nearly 97%, according to the CME FedWatch Tool.
Soft inflation, strong sentiment, and new highs — *insert feelsgoodman meme.*
🤝 A Trade Truce (For Now)
Adding to optimism, US and Chinese negotiators sounded unusually positive over the weekend. The two sides reportedly hammered out a trade framework, setting the stage for President Donald Trump and Chinese leader Xi Jinping to meet in South Korea later this week.
Treasury Secretary Scott Bessent said the talks “ought to pave the way” for a broader discussion on tariffs, tech transfers, and everything in between — the kind of vague optimism that markets eat up like comfort food.
For now, investors are choosing to focus on the handshake rather than the fine print. After all, in the markets, hope is often more powerful than details.
🏦 The Fed’s Big Moment
The main event, however, comes midweek. The Federal Reserve is widely expected to cut interest rates ECONOMICS:USINTR by a quarter point on Wednesday. But the real show starts after the decision, when Jerome Powell takes the mic.
Traders will be parsing every word of his press conference for hints on how much further the Fed is willing to go. The tone of his remarks could determine whether markets keep coasting at record highs — or finally take a breather.
So far, Powell has managed to thread the needle: easing just enough to keep growth alive without letting inflation flare back up. But with stocks at all-time highs and job data still missing due to the government shutdown, he’s got a tough balancing act.
💻 Big Tech Takes the Stage
Anyway, peak earnings season is here and if macro policy is the first act this week, Big Tech earnings are the broader narrative.
Five members of the Magnificent Seven — Microsoft NASDAQ:MSFT , Alphabet NASDAQ:GOOGL , Meta NASDAQ:META , Apple NASDAQ:AAPL , and Amazon NASDAQ:AMZN — will all report their latest results.
That’s roughly $12 trillion in combined market cap stepping into the spotlight.
After a few solid years of sky-high expectations around AI, cloud, and advertising recovery, investors are craving proof that the hype is translating into actual earnings.
The question isn’t whether these companies are still dominant — it’s whether they can keep growing fast enough to justify valuations that have already priced in perfection.
Microsoft, Meta and Alphabet kick things off Wednesday, Apple and Amazon step up Thursday. Somewhere between all that, expect social media feeds to explode with charts, hot takes, and the occasional meme about “buying the dip” before it even happens.
🌍 Markets in a Mood
It’s one of those rare weeks when every major force — central banks, geopolitics, and tech earnings — converge into a single market narrative. And, by the looks of it, that narrative is leaning bullish.
Still, keep an eye out for surprises.
Off to you : Where do you think markets are heading this week? Are you excited to snap up some tech shares ahead of the updates or looking to play defense? Share your thoughts in the comments!
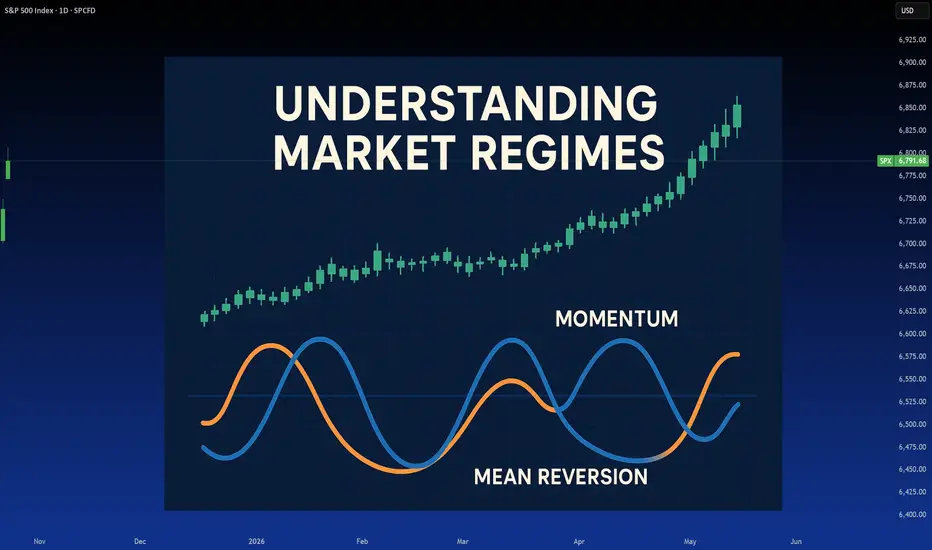
Market Regimes: What they are and why they matterRegimens, what are they and why they matter?
Most traders, especially new ones, don’t understand trading regimens. This is actually normal. Even as a quant based trader with higher education in stats/sciences, I learned of Regimen trading later in my trading career, having successfully navigated trading without it; but insurmountably improving things when I discovered it.
What is a regimen you may ask? Is it what’s going on in North Korea? Or even the USA?
Chances are, most people may think regime is synonymous with something like fascism or some ultra political significance, but the truth is regime can mean a few things, and I think its important, before getting into the real details, to first understand the meaning of regime.
The Meriam-Webster dictionary defines regime as:
regular pattern of occurrence or action (as of seasonal rainfall)
the characteristic behavior or orderly procedure of a natural phenomenon or process
mode of rule or management a government in power
a form of government
a government in power
a period of rule
If you were to do a grad school ‘ concept analysis’ on regime, you would get some interesting findings of regime. Essentially, all of these definitions have a significance/underlying overlap in meaning. The simplified meaning? I would say (without having done an actual concept analysis), a regime is a “pattern of behaviour / rules / government that forms repeating characteristics that can be measured and predicted against its previous characteristics”.
Still too complex? Let’s simplify with both political and scientific examples.
Political
In the current presidency in the U.S., the Republican party was swift to implement sweeping tariffs against international trade partners, blanketing entire continents in a matter of days with tariffs. These were then paused, resumed, paused, resumed, lowered, raised, lowered, raised, paused, resumed, revoked, resumed, lowered, raised, etc.
Under the current political regime, we can identify the behaviour of “tariff implementation”. From previous tariff implementation and revocation and adjustment, we have the characteristics of this regime. We can then use these characteristics to predict future outcomes under this regime, i.e. we would hypothesize “Tariffs will be paused within the coming 2 months”. We can say this because this is a characteristic of the current regime. In fact, the term TACO is a perfect example of repeating regime characteristics!
What about a scientific example?
Well we can draw on Meriam-Webster making reference to seasonal rainfall. In climatology, a " rainfall regime " refers to the characteristic pattern of precipitation over a region during the year—especially its timing, intensity, and variability across seasons. Identifying these regimes are pivotal to forecasting future meteorological and climatological events!
What about my field? Epidemiology and Biostatistics?
In Epi, we have multiple different regimes, such as:
Treatment Regime: A prescribed course of medical therapy, such as a drug regimen for tuberculosis or chemotherapy for cancer. It includes dosage, timing, and duration.
Vaccination Regime: A schedule of immunizations designed to prevent disease outbreaks—e.g., two-dose mRNA COVID-19 vaccine regime followed by boosters.
Control Regime: A set of public health policies or containment strategies—like quarantine protocols, mask mandates, or vector control in malaria-endemic areas.
Surveillance Regime: The systematic collection and analysis of health data to monitor disease trends—e.g., wastewater surveillance for poliovirus or syndromic surveillance for flu-like illness.
These all matter because these regimes dictate future characteristics/outcomes.
Great! Now that you have an idea of what a regime means, let’s talk about regimes in trading.
If you haven’t already guessed, there obviously exists “ market regime s”. These are, more or less, defined as “a distinct period characterized by specific patterns in market behavior—such as trends, volatility, and macroeconomic conditions—that influence investment strategies and risk management. ”
If you look back to our examples, you can begin to imagine why regimes matter. Remember, TACO! Previous behaviour dictates future characteristics. Once you understand the way or median in which some phenomena operates, you can use these characteristics to predict future characteristics.
If you wanted to dissect market regimes, it could get relatively involved and complex. For example, things such as:
Seasonality,
Momentum,
Mean Reversion,
Financial / economic stability
Geopolitical stability
These can all influence market regimes in their own way and can, in fact, be standalone market regimes. If you trade seasonality, you are trading “ seasonal regimes ”.
Momentum and Mean reversion are independent regimes of themselves (more on that shortly).
If you trade fundamentals, you will be trading economic and geopolitical regimes.
But which is correct? Not all regimes can exist at the same time, correct?
Yes and no! Regimes can momentarily shift and flip into a different one. Take, for example, the U.S. implementation of Tariff’s at the beginning of 2025. The initial blanket tariffs caused a mean reversion regime fueled by financial/economic and geopolitical stability. We had 3 regimes working together for the result, which was ultimately a mean reversion. This quickly shifted from a mean reversion regime to a momentum based regime (more on this shortly).
So, yes, we can, theoretically, have more than one regime simultaneously. However, when it comes to markets, and this is where you are in luck, its actually pretty easy! Markets tend to be either:
Mean reverting; or
Momentum based.
And that’s really that. Those are the only 2 regimes you will ever truly need to pay attention to, which will give you a better edge at trading. Seasonality, financial and geopolitical stability will either augment mean reversion or momentum, but generally are not independent regimes in and of themselves.
In the end, markets either go up, down or sideways. It can be driven by broader contexts, but in the end the up/down/sideways is driven by a predominate regimen;
Down markets: usually mean reverting.
Up markets: usually momentum.
Sideways markets: usually mean reverting with occasional momentum deviations.
If you want to learn more about the evolution of the market, you can check out my post about how the market has evolved into its current regime here:
Now, let the real fun begin and let’s talk about how to correctly trade based on the current regime!
There are some steps, first one must:
Identify the current regime concretely.
Apply the correct strategies that are compatible with the current regime.
Understand the momentum, mean reversion paradox
I will walk you through how to do this step by step.
Identifying the Current Regime Concretely
The easiest way to identify the current regime is by using Hurst Exponent.
The Hurst exponent is a number between 0 and 1 that tells you how predictable a time series is—like stock prices or rainfall.
If it's close to 0, the data is very random and tends to switch directions often.
If it's around 0.5, the data behaves like a random walk—no clear trend.
If it's close to 1, the data shows strong trends and tends to keep moving in the same direction.
So, it helps you measure persistence vs. randomness in patterns over time. The closer to 1 the more “persistent” the market is said to be. Persistence is basically the math equivalent of momentum. If a market is persistent, it will tend to trend with momentum.
The closer to 0 the more random the market is said to be . Randomness usually favours “mean reversion”
For simplicity, if you get a Hurst Exponent > 0.5, you are likely in a momentum regime. If < 0.5, you are likely in a mean reversion regime.
Let’s take a look at some examples using QuantNomad’s Hurt Exponent indicator ( available here ):
This is just before the crash in February 2025. We can see that up here, the Hurst Exponent was < 0.5, indicating a mean reversion preference. And indeed, the market ended up mean
reverting back to its quadratic mean (481) with the crash.
Then let’s see what happened:
After the crash, we can see that the Hurst Exponent was consistently > 0.5, indicating persistence in the market, i.e. trendy and momentum based.
Remember, as a rule of thumb, momentum markets generally faour upside and mean reverting tend to be downside favouring. If we narrow the regime to smaller timeframe regimes, you can see this phenomenon quite easily. Let’s look at SPY on a bearish day and bullish day against the Hurst Exponent:
We can see that on this bull trend day, Momentum and persistence reigned dominate. Hurst did not drop below 0.5, at least not for long, which indicated a persistent trend that was momentum driven.
Now a bearish day:
You can see on this bear trend day that Hurst stayed below 0.5 persistently, indicating mean reverting behaviour.
This also highlights how lower timeframes can have independent and day to day regimes, but its always important and critical to pay attention to the major regime a market is in on the larger timeframe.
Applying Correct Strategies
Depending on the regime, you MUST tailor your strategy to match the regime. If you are trading a mean reverting regime, oscillators like RSI and Stochastics aren’t going to work well. If you are trading a momentum regime with high persistence, mean reverting strategies like Bollinger Bands and Z-Score are not going to work.
As a rule of thumb, when Hurst is > 0.5, you want oscillator based strategies such as RSI, Stochastics, etc.
One indicator that I would recommend in momentum based regimes is my own, Momentum Probability Oscillator indicator ( available here ). This indicator operationalizes probability/sentiment through momentum metrics instead of mean reversion metrics. Let’s take a look at some examples:
In this example on the hourly timeframe for SPY, you can see that momentum is lost (signified by the oscillator falling below the yellow line) indicating that the likely outcome will be selling, this is shown by the pink arrows.
In this next example, we can see where momentum is reclaimed and the bias shifts to upside.
Because this indicator quantifies momentum probabilistically, it does well in momentum based, persistent regimes to identify strong trends and pullback of trends.
In reality, you can use any oscillator in a momentum based, persistent regime, but obviously I am biased to my own creations.
What about a mean reverting regimen?
If we are in a mean reverting regime, your best indicators to use are Bollinger Bands or, my favourite, the Z-Score probability indicator (by yours truly) available here .
Let’s use $NYSE:IRDM as our mean reverting example
In this image, the red arrow marks the transition to a mean reverting regime. So what do we use here? Well let’s take a look at the Z-Score probability indicator:
The red lines mark the transition to a mean reversion based regime. At the time of this transition, IRDM was oversold based on the Z-Score probability. We can see it in fact rallied back up to a z-score of 0 (mean reversion) before rejecting back down from the 0.
This is incredibly powerful, as the Hurst Exponent tells you that you can trust a reversion back to a mean!
Let’s try a smaller, intraday example, going back to SPY:
This day, SPY looked pretty bullish; however, the Hurst Exponent was consistently below 0.5 indicating mean reversion.
If we applied the Z-Score probability indicator:
I flipped the indicator to use Candles so you can more easily see the mean reversion behaviour. SPY goes to either extremes and always mean reverts back to 0, at times even consolidating in the mean reversion range.
And Bollinger bands:
If we look at a momentum driven day:
We can see that there is a skew or bias to one side of the average. The z-score is all over the map with no real expansion within the average range and infrequent and sporadic reversions that come more from extensive consolidation rather than actual mean reversion.
The indicator isn’t unusable in momentum based trading, but its not ideal. If we flip this same chart to the momentum probability oscillator we can see a stark difference in utility:
You can see the trend is using the full range of the oscillator and there is clear bounces at lower range and rejections at higher range with frequent “mean reversion” of the oscillator momentum based mean.
Now finally, the last section:
The Momentum Mean Reversion Paradox
This is, obviously, a self made up term. However, this is a phenomenon that will happen in corrective environments, where a mean reversion is so substantial, it becomes augmented by momentum itself.
What does this mean? It means that, despite the market actually mean reverting, the Hurst exponent flips to > 0.5, as the market is “persistently bearish”.
We can see this if we flip back to our $NYSE:IRDM example:
Here, we can see despite IRDM selling, the Hurst Exponent is incredibly trendy, with a really high value of > 0.55. Yet, despite this, the ticker continues down. This is the hallmark of a correction.
This is incredibly important and I really would advise you to mark this down and remember this. You can actually tell that something is “correcting” using this exact approach. When Hurst > 0.5 and the trend is down, this is the hallmark of a TRUE correction. No speculation needed!
Statistics is the best, I’m telling you.
Let’s look at the SPY crash of 2025:
During the SPY crash of 2025, the Hurst flipped to > 0.5, with a max of 0.57 indicating a hugely persistent trend. This means that this was a strong correction for SPY, flipping from a Hurst of < 0.5 to a Hurst of > 0.5 with a strong downtrend.
Crashes tend to happen abruptly without such transitions. For example, if we look at the COVID crash:
Theoretically Hurst warned us in advance that SPY was entering mean reversion territory, but when it actually happened, it happened so fast, Hurst never truly converted from mean reversion to trending. It was just a jumbled mess. This is the hallmark of a crash.
Concluding Remarks
And now, my friends, you know all there is to know about how to identify market regimes! Understanding these concepts will put your eons ahead of the average trader and allow you to select the correct tools and actually understand what the market is doing and when its gearing up for some corrections/mean reversions.
This is a long post, I will leave it there, but I really hope you learned something from this and will take some of the key points away!
Thanks for reading and as always, safe trades!
S&P 500 Index Showing Weakness – Correction Ahead?Over the past seven days, the S&P 500 index( SP:SPX ) has been on a bullish run, frequently hitting new all-time highs. However, in the last two or three weeks, it's been influenced by the ongoing tariff tensions between the U.S. and China .
Let's look at the latest news about the S&P 500 index :
The IMF has flagged that market valuations might be a bit high, hinting at possible corrections. Plus, there's been a fresh look at how well China’s sticking to the 2020 trade deal, and on top of that, a new trade agreement in Southeast Asia is in the mix. So that’s the quick rundown!
Right now, if we look at the S&P 500 on a 1-hour timeframe, the index is near its Resistance lines and has lost its uptrend line , which is a sign of weakening momentum .
We also saw a Shooting Star Candlestick pattern form in the last few hours with good volume, adding credibility to the potential for a pullback .
From an Elliott Wave standpoint, it seems the S&P 500 has completed its wave 3, and we might see a wave 4 correction in the coming hours or days.
There's a noticeable Negative Regular Divergence(RD-) between the recent tops , and even on the daily timeframe, there's a divergence signaling potential weakness.
I expect the S&P 500 could drop at least to its Support line , around the $6,857 .
Note: The cryptocurrency market, and especially Bitcoin , has been highly correlated with the S&P 500 index these weeks, and a possible correction in this index could lead to a correction in this market.
Please respect each other's ideas and express them politely if you agree or disagree.
S&P 500 Index Analyze (SPX500USD), 1-hour time frame.
Be sure to follow the updated ideas.
Do not forget to put a Stop loss for your positions (For every position you want to open).
Please follow your strategy and updates; this is just my Idea, and I will gladly see your ideas in this post.
Please do not forget the ✅' like'✅ button 🙏😊 & Share it with your friends; thanks, and Trade safe.

Larger Drop Incoming?The move up since the liberation day dump has been epic. I called the low on the markets at the time. I was long AppLovin, AMD, Reddit, Arm, Alab, REMX, amongst many other names that far outperformed the market. I warned you about the imminent dump before it happened, and then took positions on the long side as the market capitulated and we hit the golden ratio.
Now it's time to zoom out and remind you that this will not grind up forever. My interpretation of the chart is the move is nearing the end, the risk of strong downside move (7-12% drop) is increasing significantly and greed will catch many people out.
The inverse head and shoulders pattern is almost complete, we are grinding up in this channel and will start to come up against the resistance over these coming days/weeks. I had an upside target of 7000-7250 and we are almost there. The dips are getting brought up, so bulls may have more time to make gains but I am not convinced that the gains are worth the risk at this stage.
I will start taking some chips off the table here. Not financial advice, do what's best for you.

S&P500 Is it approaching the end of this Cycle?The S&P500 index (SPX) has been trading within a Bullish Megaphone pattern since the October 2022 bottom of the Inflation Crisis. Since the July 2024 High, it also entered a shorter term Megaphone and those two patterns resemble the 2016 - 2019 Megaphones that emerged straight after the 2015 E.U. crisis and China's slowdown.
As you can see, the 1W RSI sequences among the two fractals are also very similar and the Cycles seem to be repeated with the 1W MA50 (blue trend-line) acting as the Support in times of aggressive uptrends, while the 1W MA200 (orange trend-line) acting as the Support of the Bear Cycles/ correction phases.
The former Megaphone peaked in early 2020 on its 1.618 Fibonacci extension. On the current pattern that Fib is at 7100 and may very well get hit by the end of this year. If it does, the probabilities of a strong technical correction towards the 1W MA200 and the bottom of the long-term Bullish Megaphone, rise dramatically. Especially if at the same time, the 1W RSI turns overbought well above the 70.00 barrier.
It is also worth noting that 1W RSI levels below 35.00 are a strong technical Buy Signal. Long-term investors may seek to use this as a complimentary indicator in case this sharp correction materializes.
So do you think SPX will start correcting if it hits that level by early next year?
-------------------------------------------------------------------------------
** Please LIKE 👍, FOLLOW ✅, SHARE 🙌 and COMMENT ✍ if you enjoy this idea! Also share your ideas and charts in the comments section below! This is best way to keep it relevant, support us, keep the content here free and allow the idea to reach as many people as possible. **
-------------------------------------------------------------------------------
💸💸💸💸💸💸
👇 👇 👇 👇 👇 👇

Hellena | SPX500 (4H): LONG to resistance area of 7000.Colleagues, I believe that the upward movement is not over yet and at the moment the formation of wave “3” is taking place, but the chart shows a gap that should be closed.
Therefore, I believe that the price can go into correction of the small wave “4” to the area of 6823, but the priority is still the upward movement, as I believe to the resistance area of 7000.
Fundamental context
U.S. business activity strengthened in October: the S&P Global PMI rose to 54.8, indicating expansion in both manufacturing and services sectors.
However, uncertainty persists — business sentiment and export performance have weakened, while the partial government shutdown limits data visibility.
At the same time, the Federal Reserve is expected to continue rate cuts as the economy shows signs of slowing.
Manage your capital correctly and competently! Only enter trades based on reliable patterns!

SPX500 ShortElite Analysis
Short on spx500, price gave us the reversal after liquidation of asia high on 1m tf
Targeting lower liquidity pools

S&P 500 Bulls Back in Control – New All-Time High Ahead?As I expected in my previous idea , the S&P 500 index( SP:SPX ) pulled back from its Resistance lines and hit its target.
Right now, the S&P 500 index is in the process of breaking through a Resistance zone($6,894_$6,859). Just a few hours ago, it successfully broke above the upper line of a descending channel , which is a positive sign for a renewed upward move .
From an Elliott Wave perspective, it seems that the S&P 500 index has completed its main wave four, and after breaking this Resistance zone($6,894_$6,859) , we can anticipate the start of a main wave 5 .
I expect that once the S&P 500 index breaks through this Resistance zone($6,894_$6,859) , it will likely climb at least up to the next Resistance lines and the Potential Reversal Zone (PRZ) .
Note: The cryptocurrency market, and especially Bitcoin( BINANCE:BTCUSDT ), has been highly correlated with the S&P 500 index these weeks.
Please respect each other's ideas and express them politely if you agree or disagree.
S&P 500 Index Analyze (SPX500USD), 1-hour time frame.
Be sure to follow the updated ideas.
Do not forget to put a Stop loss for your positions (For every position you want to open).
Please follow your strategy and updates; this is just my Idea, and I will gladly see your ideas in this post.
Please do not forget the ✅' like '✅ button 🙏😊 & Share it with your friends; thanks, and Trade safe.

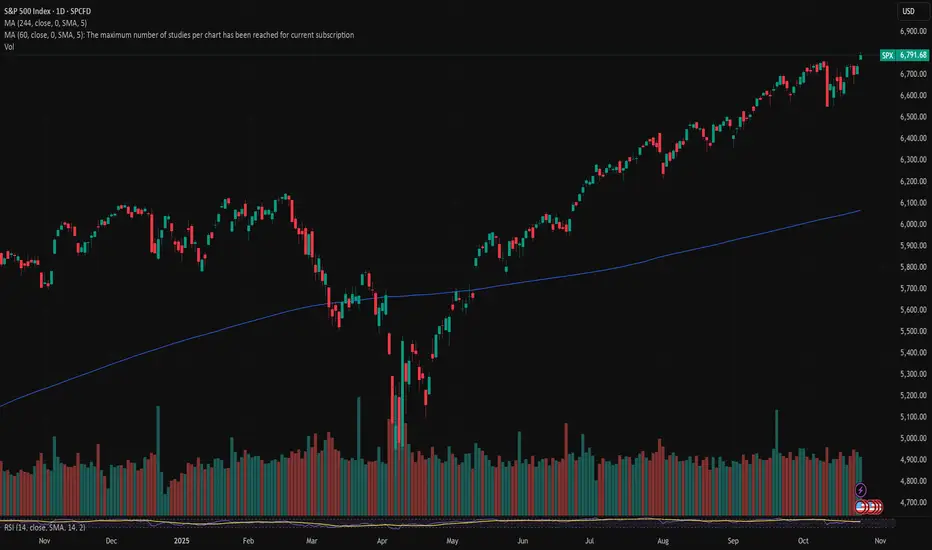
A simple trading strategy You don’t need a dozen indicators to build a solid strategy—sometimes, observation is enough.
Here’s a simple setup I’ve applied to the S&P daily chart:
🔹 Use the 20-day MA to buy dips
🔹 Place stops below the 55-day MA
Why? The 55-day MA has consistently supported the uptrend since May. This approach has offered multiple entry points, with stops trailing higher each time.
It’s not trading advice—just a clean, repeatable structure that’s still working well.
Disclaimer:
The information posted on Trading View is for informative purposes and is not intended to constitute advice in any form, including but not limited to investment, accounting, tax, legal or regulatory advice. The information therefore has no regard to the specific investment objectives, financial situation or particular needs of any specific recipient. Opinions expressed are our current opinions as of the date appearing on Trading View only. All illustrations, forecasts or hypothetical data are for illustrative purposes only. The Society of Technical Analysts Ltd does not make representation that the information provided is appropriate for use in all jurisdictions or by all Investors or other potential Investors. Parties are therefore responsible for compliance with applicable local laws and regulations. The Society of Technical Analysts will not be held liable for any loss or damage resulting directly or indirectly from the use of any information on this site.

SPX - The Road to 6900 Begins “History never repeats itself. Man always does.”
A deep look into SPX History exposes the path of a market cycle and tells us the truth on where markets are headed.
Percentages don't lie.
See you guys at 6900!

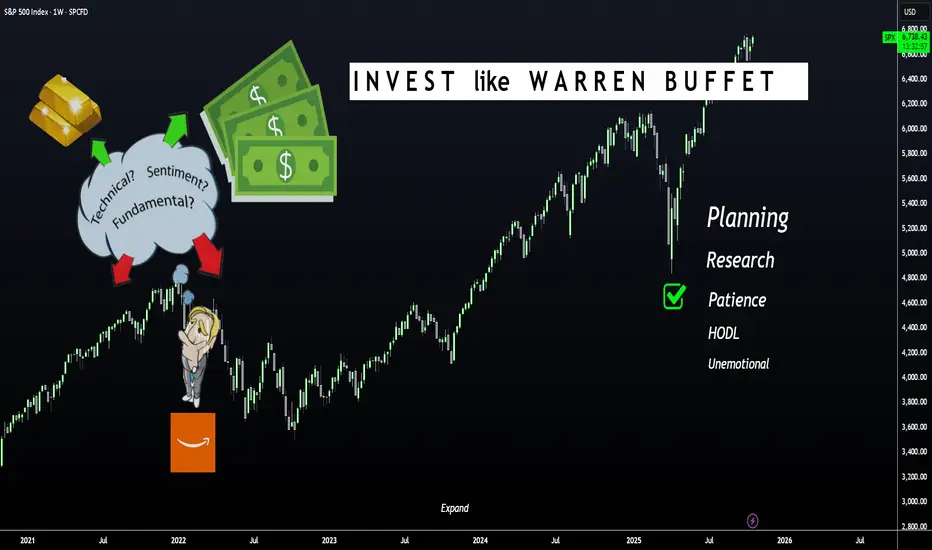
LEARN to INVEST Like Warren BuffetHello Stock Traders and Speculators 📈📢
If you trade and or watch stocks, commodities and/or ETF's then this one is for you!
Warren Buffett is probably one of the most successful investors of all time. Over the years, he has developed a set of principles and strategies over his career. He was inspired by the teachings of key financial thinkers like Phil Fisher, Benjamin Graham and Charlie Munger.
Phil Fisher
Fisher’s approach focusses on quality companies with long-term growth potential, emphasizing focused portfolios and long-term holdings. He believed in gathering information about a company beyond what’s readily available. His lessons on maintaining a focused portfolio and committing to long-term holdings are clear influences on Buffett’s patient, value-driven investment philosophy.
Benjamin Graham
Known as the father of value investing, Graham’s core principle was to buy stocks at a price lower than their intrinsic value, creating a margin of safety (MOS). This strategy helps mitigate risk and increase the likelihood of future gains. Buffett absorbed Graham’s teaching on finding stocks that are undervalued and buying them at the right price— definitely a large contributor of his investment success.
Charlie Munger
Munger is Warren Buffett’s long-time business partner. He introduced the concept of economic moats, which refers to a company’s long-term, sustainable competitive advantages. Munger advocates investing in businesses that can fend off competition and maintain profitability over time. This philosophy drives Buffett’s focus on companies with strong market positions and solid long-term potential, favoring these over shorter-term, speculative opportunities.
Buffett's Investment Approach
1 - Buy for the Long Term. Buffett’s strategy emphasizes identifying companies that can consistently perform well over long periods. He holds stocks for years, or even decades, often looking for opportunities where other investors may overlook value.
2 - Buy at the Right Price. Buffett is known for his discipline in waiting for the right moment to invest. His approach ensures he doesn’t overpay, instead seeking stocks when they are priced below their true value, maintaining a margin of safety.
3 - Buy the Right Stocks. Buffett doesn’t just buy cheap stocks, he buys quality companies with sustainable advantages. His goal is to invest in firms with strong business models that will continue to perform well regardless of market conditions.
Warren Buffett emphasizes investing in companies with simple and clear business models, ones that fall within his circle of competence. He prefers to thoroughly understand the operations, products, and long-term prospects of a company before making any investment.
This principle is combined with in-depth analysis of how the company operates and how sustainable its valuations and future growth prospects are. If a business model is too complex or outside his expertise, he avoids it.
He prioritizes companies with integrity and transparency in their management. He believes in backing leaders who are passionate, have strong vision and execution capabilities and who use shareholder funds wisely. Trusting management to run the company effectively, with efficiency and accountability, is critical for long-term success in Buffett’s eyes.
Investing in quality companies isn’t enough—Buffett also insists on buying them at attractive prices. He maintains a strict discipline of buying with a margin of safety, ensuring the price paid is lower than the company’s intrinsic value. This means waiting for opportunities to buy great businesses at fair prices rather than settling for fair businesses at attractive prices, which may not perform well over time.
Buffett has made many of his lessons and strategies available to the public through his letters to shareholders and partnership letters. These documents offer insight into his investment approach, decision-making process, and lessons from both successes and failures. There are several key books that capture Buffett’s life, philosophy, and strategies in greater detail:
📚Warren Buffett’s Ground Rules
📚The Warren Buffett Way
📚Buffett: The Making of an American Capitalist
📚The Warren Buffett Portfolio
📚The Snowball: Warren Buffett and the Business of Life
Each of these resources provides a comprehensive look into the mind of one of the most successful investors of all time. Personally I've read Buffett: The Making of an American Capitalist by Roger Lowenstein and it is fantastic.
SPX: Back to the old path?Although a trading week on the US equity markets was a bit uncertain, still, Friday's US inflation figures brought back market optimism and pushed the S&P 500 to another all-time highest level during this year. Posted data showed that inflation was holding relatively firmly in September at the level of 3,0% on a yearly basis, which increased investors expectations that the Fed might cut interest rates by another 25 basis points on Wednesday, October 29th, when the FOMC meeting will be held. The S&P 500 reached the level of 6.805 on Friday, and closed the week at 6.791.
Tech companies were leading the surge in the index value, however, this time the financial sector benefited. Investors are expecting that the environment of decreased interest rates will support banks lending and increase their profits in the future period. Big names like JPMorgan, Wells Fargo and Citigroup were traded higher by 2%.
Apple was the company who was in the spotlight of investors, whose shares reached an all time highest level, helped by fresh optimism around demand for the iPhone 17 series, both on the US and China markets. Amazon had a bumpy start of the week, when Amazon Web Services (AWS) suffered a major global outage, affecting thousands of apps, websites and services worldwide. Still, their share price managed to surge by 1,6% till the end of the week. Regardless of the relatively volatile week, Nvidia shares continue to be traded with a strong demand following upbeat signals for a demand for its Blackwell GPU platforms and other AI infrastructure. A rally in the Broader AI and semiconductor supply chain (e.g. Taiwan Semiconductor Manufacturing Company) helped propel sentiment around Nvidia.
The week ahead might also be a volatile one, considering that the FOMC meeting will be held on Wednesday. Markets are currently expecting that the Fed will cut interest rates by 25 bps. In this case, the market optimism will continue. However, it should be noted that the US equity markets continue to be sensitive to fundamentals. Risks hold around trade-tariffs and the US Government “shutdown”.
S&P 500 Consolidation Turning Bullish StructureThe S&P 500 remains in a consolidation phase, leaning toward a bullish trend as it aims for new record highs once again.
Global stocks jumped on Monday to fresh intraday records, while the U.S. dollar eased on optimism that a potential trade deal between China and the U.S. may be approaching. Investors are also awaiting a series of central bank policy meetings and key earnings reports from several mega-cap companies.
From a technical perspective, prices continue to react strongly to the upside. If this upward momentum persists, the next resistance level is seen around 6,950.10.
You may find more details in the chart.
Trade wisely best of Luck buddies,
Ps; Support with like and comments for better analysis Thanks for Supporting.

SPXShift prediction to the right.
Global market cooler anticipated. Crypto should be hit the hardest and fastest.
Most anticipating rally continuation like post-COVID...
I think that will cause a surprise.

Fed Overview: The Good and the Not So GoodDriven by an euphoric phase, the S&P 500 has approached 7,000 points, nearing its 2000 valuation record, with six consecutive months of gains without retracement.
The key question for investors is now clear: has the Federal Reserve provided enough justification for this confidence, or does Jerome Powell’s caution mark the beginning of the end of this euphoric phase?
1) A Fed slowing the pace without complacency
On Wednesday, October 29, the Fed announced another 25-basis-point rate cut, bringing the federal funds rate into the 3.75%–4.00% range. This is the second consecutive reduction, aimed at countering the labor market slowdown.
However, the FOMC vote revealed strong internal divisions: one member wanted a deeper cut, another preferred no change. This reflects the delicate balance between supporting employment and avoiding renewed inflationary pressure.
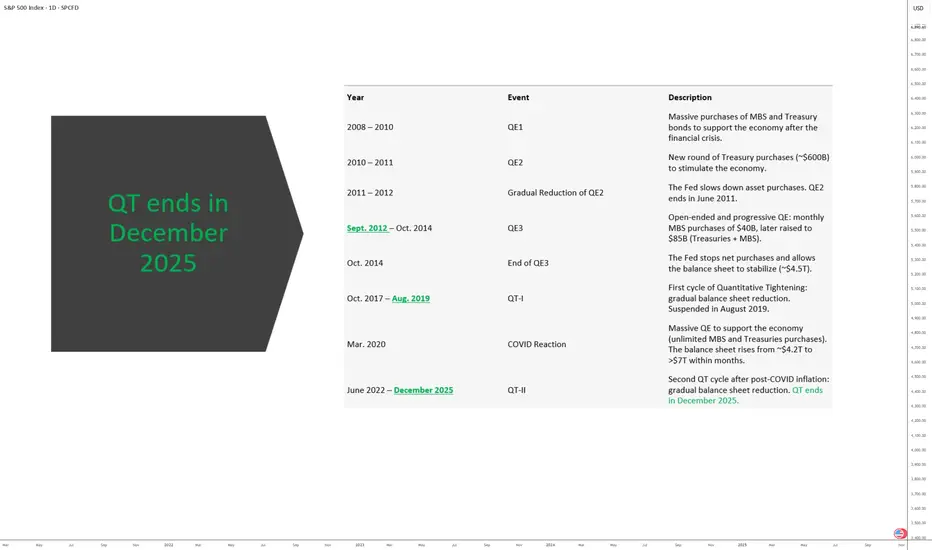
Another key signal: the Fed decided to pause its balance sheet reduction (quantitative tightening) starting December 1st, in order to preserve financial system liquidity, as credit markets show early signs of stress. Powell clarified that this pause does not imply a lasting return to an expansionary stance.
Finally, Powell cooled expectations for another rate cut in December, stating that “nothing is guaranteed.” Money markets now price roughly a 70% chance of a hold in December, down from nearly 90% odds of a cut before the meeting.
2) Between monetary realism and market excess
The Fed is not ruling out further easing, but it refuses to fuel a bullish rally in the S&P 500 that is now considered excessive relative to fundamentals.
Current valuations rely heavily on expectations of continued rate cuts. If that narrative weakens, the likelihood of a technical correction in the S&P 500 rises.
At this stage, however, the index has not yet signaled a reversal.
DISCLAIMER:
This content is intended for individuals who are familiar with financial markets and instruments and is for information purposes only. The presented idea (including market commentary, market data and observations) is not a work product of any research department of Swissquote or its affiliates. This material is intended to highlight market action and does not constitute investment, legal or tax advice. If you are a retail investor or lack experience in trading complex financial products, it is advisable to seek professional advice from licensed advisor before making any financial decisions.
This content is not intended to manipulate the market or encourage any specific financial behavior.
Swissquote makes no representation or warranty as to the quality, completeness, accuracy, comprehensiveness or non-infringement of such content. The views expressed are those of the consultant and are provided for educational purposes only. Any information provided relating to a product or market should not be construed as recommending an investment strategy or transaction. Past performance is not a guarantee of future results.
Swissquote and its employees and representatives shall in no event be held liable for any damages or losses arising directly or indirectly from decisions made on the basis of this content.
The use of any third-party brands or trademarks is for information only and does not imply endorsement by Swissquote, or that the trademark owner has authorised Swissquote to promote its products or services.
Swissquote is the marketing brand for the activities of Swissquote Bank Ltd (Switzerland) regulated by FINMA, Swissquote Capital Markets Limited regulated by CySEC (Cyprus), Swissquote Bank Europe SA (Luxembourg) regulated by the CSSF, Swissquote Ltd (UK) regulated by the FCA, Swissquote Financial Services (Malta) Ltd regulated by the Malta Financial Services Authority, Swissquote MEA Ltd. (UAE) regulated by the Dubai Financial Services Authority, Swissquote Pte Ltd (Singapore) regulated by the Monetary Authority of Singapore, Swissquote Asia Limited (Hong Kong) licensed by the Hong Kong Securities and Futures Commission (SFC) and Swissquote South Africa (Pty) Ltd supervised by the FSCA.
Products and services of Swissquote are only intended for those permitted to receive them under local law.
All investments carry a degree of risk. The risk of loss in trading or holding financial instruments can be substantial. The value of financial instruments, including but not limited to stocks, bonds, cryptocurrencies, and other assets, can fluctuate both upwards and downwards. There is a significant risk of financial loss when buying, selling, holding, staking, or investing in these instruments. SQBE makes no recommendations regarding any specific investment, transaction, or the use of any particular investment strategy.
CFDs are complex instruments and come with a high risk of losing money rapidly due to leverage. The vast majority of retail client accounts suffer capital losses when trading in CFDs. You should consider whether you understand how CFDs work and whether you can afford to take the high risk of losing your money.
Digital Assets are unregulated in most countries and consumer protection rules may not apply. As highly volatile speculative investments, Digital Assets are not suitable for investors without a high-risk tolerance. Make sure you understand each Digital Asset before you trade.
Cryptocurrencies are not considered legal tender in some jurisdictions and are subject to regulatory uncertainties.
The use of Internet-based systems can involve high risks, including, but not limited to, fraud, cyber-attacks, network and communication failures, as well as identity theft and phishing attacks related to crypto-assets.
Reversal?Channel resistance reached
RSI resistance reached
Double 1D divergence on RSI
If something ugly is gonna happen, it's gonna happen now.
Fib levels to watch:
1.272 - likely bounce area
1.618 - classic reversal level for a correction after wave 5, but I don't see strong support there
2.0 - not a fib level, but February peak is there. Likely bounce area.
2.2 and 2.272 area - when 1.618 level breaks, price usually reaches it. They are all inside of 1M FVG. The correction can end there. Or not.
2.618 - the price can reach and overshot it. Another 1M FVG lies just below it.
All 2+ fibs match previous peaks very good. Sounds crazy, but a correction to 6000 area seems very probably now.

S&P 500 Analysis – 26 October 2025
- S&P 500 broke resistance level 6800.00
- Likely to rise to resistance level 7000.00
S&P 500 index opened today with the upward gap which broke the key resistance level 6800.00 (which stopped the previous impulse wave (3) at the start of October, as can be seen from the daily S&P 500 index chart below).
The breakout of the resistance level 6800.00 accelerated the active minor impulse wave 3 of the medium-term impulse sequence (5) from the start of this month.
Having just broken out of the daily up channel from August, S&P 500 index can be expected to rise to the next round resistance level 7000.00, target price for the completion of the active impulse wave 3.

Blockchain’s Role in Different Trading Segments1. Introduction: Redefining Trust in the Trading World
The modern trading ecosystem — spanning financial markets, commodities, forex, and digital assets — relies heavily on trust, transparency, and speed. For decades, intermediaries such as brokers, clearing houses, and central depositories have played a vital role in ensuring smooth settlements and recordkeeping. However, this system is often plagued by inefficiencies, high transaction costs, and occasional lapses in security or accountability.
Enter blockchain technology — a decentralized ledger system that offers immutable, transparent, and secure recordkeeping. By eliminating the need for traditional intermediaries, blockchain has the potential to revolutionize how trades are executed, verified, and settled across different segments of the global financial market.
Blockchain’s role in trading is not confined to cryptocurrencies. Its applications now extend to stock markets, commodity exchanges, forex trading, derivatives, and even carbon credit and energy trading. Each of these sectors can benefit from blockchain’s ability to automate trust and reduce systemic inefficiencies.
2. Understanding Blockchain in the Context of Trading
At its core, blockchain is a distributed database shared among a network of participants. Once data — such as trade details or payment confirmations — is recorded on the blockchain, it cannot be altered without the consensus of the network. This ensures that all trading participants operate from a single, verified source of truth.
In trading terms:
Each transaction (buy or sell order) is a “block.”
These transactions are chained together chronologically.
The system is decentralized, meaning no single entity can manipulate data.
This architecture has far-reaching implications for global markets:
Instant settlements instead of multi-day clearing cycles.
Elimination of counterparty risk, as smart contracts execute automatically.
Lower transaction costs due to reduced intermediary dependence.
Enhanced auditability, since all data is time-stamped and verifiable.
3. Blockchain in Stock Market Trading
The traditional equity trading system involves multiple intermediaries — brokers, stock exchanges, clearing corporations, and custodians — all performing specific functions such as matching orders, confirming trades, and settling securities. While effective, this system is slow and costly.
How Blockchain Transforms Stock Trading
Real-Time Settlement: Blockchain can reduce the settlement period from the current T+2 (trade date plus two days) to near-instantaneous settlement (T+0). This significantly reduces liquidity risk and capital lock-in.
Tokenization of Assets: Shares can be represented as digital tokens on a blockchain. This enables fractional ownership, making high-value stocks accessible to smaller investors.
Decentralized Exchange Platforms: Decentralized stock trading platforms can facilitate peer-to-peer transactions without intermediaries, ensuring transparency and reducing costs.
Immutable Recordkeeping: Corporate actions such as dividends, bonus issues, and stock splits can be recorded permanently and automatically distributed using smart contracts.
Examples
Nasdaq Linq: One of the early adopters of blockchain, Nasdaq used the Linq platform to record private securities transactions, demonstrating efficiency and transparency.
India’s NSE pilot programs: The National Stock Exchange of India has experimented with blockchain for know-your-customer (KYC) data and settlement tracking.
4. Blockchain in Forex (Foreign Exchange) Trading
The foreign exchange market is the world’s largest financial market, with daily volumes exceeding $7 trillion. Yet, it remains fragmented, opaque, and reliant on central intermediaries like banks and payment processors.
Blockchain’s Advantages in Forex
Cross-Border Settlement: Blockchain enables direct peer-to-peer currency exchange without intermediaries, drastically cutting transfer times and fees.
Transparency and Auditability: All trades recorded on a blockchain are verifiable, reducing manipulation and fraud risks.
Smart Contracts for FX Swaps: Automated execution of forex swaps and forward contracts ensures minimal counterparty risk.
24/7 Accessibility: Unlike traditional systems, blockchain-based FX networks can operate continuously without downtime.
Example
RippleNet and Stellar Lumens use blockchain to enable instant cross-border currency transfers with minimal costs, challenging the dominance of SWIFT.
5. Blockchain in Commodity Trading
Commodity trading — involving oil, metals, and agricultural goods — often suffers from documentation delays, supply chain opacity, and settlement inefficiencies. Blockchain brings trust and traceability to this sector.
Applications
Smart Contracts for Trade Settlement: Automatically execute trades once contractual conditions are met (e.g., delivery confirmation triggers payment).
Supply Chain Transparency: Blockchain can trace commodities from extraction or production to final sale, ensuring authenticity and sustainability.
Tokenization of Commodities: Commodities like gold, crude oil, or carbon credits can be represented digitally, making them easier to trade and fractionalize.
Reduction in Paperwork: Blockchain eliminates the need for multiple physical documents like bills of lading, inspection certificates, and letters of credit.
Example
Vakt, a blockchain-based platform supported by BP and Shell, digitizes the post-trade processes in oil markets, improving efficiency and reducing fraud.
6. Blockchain in Derivatives and Futures Markets
Derivatives — including futures, options, and swaps — are complex instruments often involving multiple intermediaries. Blockchain’s smart contracts can automate these trades and settlements with precision.
Benefits
Instantaneous Settlement: Reduces the time gap between contract execution and settlement, minimizing counterparty and liquidity risks.
Automated Margin Calls: Smart contracts can automatically adjust margin requirements based on real-time price movements.
Transparency: Blockchain’s shared ledger ensures all participants view the same data, reducing disputes.
Regulatory Compliance: Blockchain enables real-time reporting to regulators, improving oversight.
Example
DTCC (Depository Trust & Clearing Corporation), which handles trillions in derivatives, has explored blockchain for trade reporting and settlement to enhance efficiency.
7. Blockchain in Cryptocurrency Trading
Cryptocurrency trading is the first and most obvious area where blockchain has already established dominance. Cryptos like Bitcoin and Ethereum are themselves blockchain-native assets, and their trading happens entirely on blockchain-based exchanges.
Innovations
Decentralized Exchanges (DEXs): Platforms like Uniswap and PancakeSwap allow traders to exchange tokens directly from their wallets without intermediaries.
Liquidity Pools: Smart contracts automatically match buyers and sellers, ensuring market liquidity.
Transparency and Security: Every trade is publicly recorded on the blockchain, ensuring full auditability.
Challenges
High volatility, lack of regulation, and scalability limitations still pose obstacles to mainstream adoption.
8. Blockchain in Energy and Carbon Credit Trading
The rise of sustainability-focused finance has introduced new markets like carbon credits and renewable energy certificates. Blockchain ensures authenticity and prevents double-counting in these emerging asset classes.
Applications
Tokenized Energy Certificates: Renewable energy output (solar, wind, hydro) can be tokenized and traded on blockchain platforms.
Carbon Credit Trading: Blockchain ensures each credit is unique, traceable, and not resold multiple times.
Peer-to-Peer Energy Trading: Consumers with solar panels can directly sell surplus energy to others through blockchain-enabled microgrids.
Example
Power Ledger (Australia) uses blockchain to enable P2P renewable energy trading, giving consumers control over energy distribution and pricing.
9. Blockchain in Real Estate and Asset Tokenization
Although not traditionally viewed as a “trading” sector, real estate is rapidly evolving into a digital trading marketplace through blockchain tokenization.
Benefits
Fractional Ownership: High-value properties can be divided into digital tokens, allowing small investors to participate.
Instant Liquidity: Instead of lengthy paperwork, property tokens can be traded instantly on secondary markets.
Transparency and Authenticity: Land titles and ownership histories recorded on blockchain reduce fraud.
Example
Platforms like RealT and Propy are pioneering blockchain-based real estate trading with tokenized assets.
10. Blockchain’s Role in Regulatory Compliance and Risk Management
Beyond execution and settlement, blockchain plays a crucial role in compliance, auditing, and risk management.
Regulatory Advantages
Real-Time Monitoring: Regulators can access immutable records of trades in real-time.
KYC/AML Integration: Blockchain-based identity systems simplify customer verification while maintaining data privacy.
Reduced Fraud and Errors: Tamper-proof records and automated reconciliations enhance overall market integrity.
Example
The European Securities and Markets Authority (ESMA) has studied blockchain-based trade reporting to enhance transparency across the EU markets.
11. Challenges and Limitations
Despite its immense potential, blockchain adoption in trading faces practical and regulatory hurdles:
Scalability Issues: Large exchanges process millions of transactions daily; most blockchains still struggle with high throughput.
Regulatory Uncertainty: Many governments have yet to create clear frameworks for blockchain-based trading systems.
Integration Complexity: Legacy financial infrastructure is deeply entrenched, making transition costly and time-consuming.
Privacy Concerns: While transparency is valuable, full data visibility may conflict with confidentiality requirements in institutional trading.
Energy Consumption: Proof-of-work systems like Bitcoin consume significant power, though newer consensus models (e.g., proof-of-stake) are more efficient.
12. The Future of Blockchain in Global Trading
As the technology matures, blockchain is expected to become the backbone of next-generation trading infrastructure. The future may see:
Fully tokenized stock exchanges, where equities, bonds, and derivatives exist as digital assets.
Interoperable blockchains, allowing seamless transfers between different networks and asset classes.
AI and blockchain integration, combining data-driven trading strategies with transparent execution.
Central Bank Digital Currencies (CBDCs) simplifying settlement between global financial institutions.
The convergence of blockchain, AI, and IoT will lead to hyper-efficient, transparent, and inclusive trading ecosystems — reshaping how capital, commodities, and data flow across borders.
13. Conclusion
Blockchain’s entry into the trading world represents a paradigm shift — from trust-based intermediaries to trustless digital verification. Whether in stock markets, forex, commodities, or emerging asset classes like carbon credits, blockchain introduces unmatched levels of transparency, efficiency, and inclusiveness.
While challenges persist, the direction is clear: blockchain is not just a supporting technology; it is the new foundation of global trading architecture. The world’s markets are moving steadily toward an era where every trade, every asset, and every participant is digitally connected in a decentralized, verifiable, and borderless network of trust.
S&P 500 looks Bearish Correction But Fed is Coming...SPX500 – Technical & Fundamental Overview
The index remains under bullish momentum, but a short-term correction toward 6838 from the pivot line at 6889 is possible before the next directional move.
Technical Outlook:
A 1H close below 6839 would confirm a bearish reversal, targeting 6769 as the next support.
However, a 1H close above 6889 would reinforce the bullish trend, paving the way toward 6941 and 6991 — with potential for a momentum-driven continuation if sentiment stays positive.
Pivot Line: 6889
Support Levels: 6840 · 6800 · 6769
Resistance Levels: 6940 · 6991
Fundamental Context:
Traders are positioning cautiously ahead of this week’s Trump–Xi trade talks, which could shape near-term market sentiment. Optimism over a potential U.S.–China tariff framework and expectations that the Federal Reserve may cut rates again are supporting risk appetite.
However, with indices at record highs and AI-related stocks heavily concentrated, any disappointment in the trade outcome or earnings results could spark a sharper downside reaction.
In short, bullish while above 6889, but watch for volatility driven by trade headlines and Fed signals in the coming sessions.

S&P500 INDEX | Bulls in Control Above 6,889 Ahead of Fed CutSPX500 – MARKET OVERVIEW | Bullish Momentum Builds Ahead of Fed Decision 🇺🇸
Barclays equity strategists believe stocks will continue their strong rally into year-end, despite some “pockets of froth.”
The Federal Reserve is widely expected to cut interest rates later today, with growing speculation it may also slow or end balance sheet reduction, further supporting risk assets.
Technically, the SPX500 has stabilized above 6,889, confirming bullish momentum and signaling potential continuation toward 6,941 and 6,991.
As long as the index trades above 6,889, the bias remains bullish.
However, to shift toward a bearish trend, the price would need to stabilize below 6,889, which could trigger a decline toward 6,842 and 6,755.
Key Technical Levels
Pivot Line: 6,889
Resistance: 6,941 · 6,991
Support: 6,843 · 6,760
Outlook:
SPX500 remains bullish above 6,889, supported by expectations of a Fed rate cut and year-end equity strength.
A confirmed break below 6,889 would shift momentum to bearish, targeting deeper corrections toward 6,842–6,755.

S&P500 Both short and long term bullish targets intact.The S&P500 index (SPX) continues to trade within its 5-month Channel Up and last Friday's pull-back to its 1D MA50 (red trend-line) again is another testament to it as it rebounded exactly on its bottom, making yet another Higher Low.
As we've shown on our previous analysis its short-term Target is the 1.382 Fibonacci extension at 6850. Ahead of a massive 1D MACD Bullish Cross however, we can see (after another short pull-back) the index extending much higher to its 2.5 Fibonacci extension (orange) at 7150 before a larger correction takes place.
-------------------------------------------------------------------------------
** Please LIKE 👍, FOLLOW ✅, SHARE 🙌 and COMMENT ✍ if you enjoy this idea! Also share your ideas and charts in the comments section below! This is best way to keep it relevant, support us, keep the content here free and allow the idea to reach as many people as possible. **
-------------------------------------------------------------------------------
💸💸💸💸💸💸
👇 👇 👇 👇 👇 👇

Graham's Formula for Intrinsic Value of a Stock➡ About Benjamin Graham
Benjamin Graham is widely known as the Father of Value Investing. He was a professor, economist, and mentor to great investors like Warren Buffett. Graham’s investment philosophy focused on buying stocks below their intrinsic value to ensure a margin of safety and protecting capital even when markets behave irrationally. His books The Intelligent Investor and Security Analysis remain timeless classics in the world of investing.
➡ His Formula to Calculate the Intrinsic Value of a Stock
Graham designed a simple mathematical model to estimate what a stock is truly worth- its intrinsic value.
Formula:
V=EPS×(8.5+2g)
Later, he modified it to account for changing interest rates:
V= /Y
Meaning of Each Value in the Formula
V: Intrinsic value or the fair value of the stock.
EPS: Earnings per share (trailing twelve months).
8.5: Base P/E ratio for a no-growth company.
g: Expected annual earnings growth rate (for next 7–10 years).
4.4: Average yield on high-grade corporate bonds when Graham proposed the formula.
Y: Current yield on AAA-rated corporate bonds (used to adjust for changing interest rate conditions).
➡ How to Calculate
Let' sunderstand the calculations with the help of an example of NVDA stock:
EPS= 3.5 (TTM)
Growth rate= 32.8 (next 3-5years)
Y= 4.09
All other values remain the same
V= / 4.09
V= 279
So, the intrinsic value of the stock would be around 279
Current price= 186
Difference= 67%
Hence the Formula suggests that the current price is still way below its fair value and hence buyable.
➡ Are these Too Aggressive Valuations?
Yes, it may be too optimistic. The term '2g' gives very high weightage to growth, which can inflate valuations quickly. In a world where corporate earnings growth is less predictable and global interest rates fluctuate, this approach may overvalue companies that appear to have strong growth potential on paper.
➡ Relevance in the Current Market Scenario
While Graham’s formula is historically important and a great conceptual framework for understanding valuation, it should not be used as a standalone tool today. Markets are far more complex and influenced by globalization, technology, inflation, and interest rate cycles.
A more balanced approach is to use Graham’s principles (margin of safety, valuation discipline) but rely on modern valuation models like Discounted Cash Flow (DCF) or Relative Valuation Ratios and treat the formula as a learning foundation rather than a precise valuation tool.
What do you think about this tool for calculating a stock's valuation?
Is it still relevant?
Do 🚀 comment 💬
Disclaimer: I am not a valuation analysis expert so apply your due diligence while investing. The stock example taken in this educational post is just for demonstration purpose and not a buy/sell recommendation.