S&P500 6M PredictThe Standard and Poor's 500, or simply the S&P 500, is a stock market index tracking the stock performance of 500 of the largest companies listed on stock exchanges in the United States
USSP500CFD trade ideas

S&P500 Analysis: Could The Bear Market Be Over? 2022 was a brutal year for everybody in the stock market with the s&p declining -20% and many stocks straight up collapsing, some of you may be asking: "Is the bear market coming to an end soon?" and while i cannot be for certain due to a variety of factors, there is at least a case to be made for bulls here:
-Potential Higher Low
-Vix staying mostly sideways during the s&p's latest drop
-Potential Inverse H&S
But also something to point out is that 3800 has become a baseline for the s&p where bears have not been able to commit below this level for very long in the past, but as of recently it would appear that the level is acting as a major level of support, so watch this very carefully
(Also on a side note: During the August to October bearish wave while a lower low was created during that period of time, bears became way too exhausted at the time and were unable to make a substantially lower low to around the 3200's (maybe wicking to mid-upper 3100's), which if the wave lasted a few more weeks could have been achived)
In conculsion whether this turns out to be true or not one thing to remember is to never become complacent in this wild, volatile market, it can always turn on a dime one way or another, so be careful out there and remember that none of this is actual financial advice, just my personal opinions

S&p500 12M PredictThe Standard and Poor's 500, or simply the S&P 500, is a stock market index tracking the stock performance of 500 of the largest companies listed on stock exchanges in the United States

Live stream - Weekly Market Wrap With Gary Thomson: NIKKEI-225, Get the latest scoop on the week's hottest headlines, all in one convenient video.
🌐 FXOpen official website: www.fxopen.com
CFDs are complex instruments and come with a high risk of losing your money.

Box ChartI made this chart to track trades in 1 to 3-dte. The strategy is to go out just far enough to get good pricing and keep 50% of the position spread in the trend channel.

S&P 500 (SPX) Looking to Complete 5 Waves ImpulseShort Term Elliott Wave view in S&P 500 (SPX) suggests cycle from 1.6.2024 low is in progress as a 5 waves impulse. Up from 1.6.2024 low, wave ((i)) ended at 4931.09 and pullback in wave ((ii)) ended at 4845.15. Wave ((iii)) higher ended at 5187.78 as the 30 minutes chart below shows and pullback in wave ((iv)) ended at 5095.88. The Index has resumed higher in wave ((v)) with subdivision as another 5 waves in lesser degree.
Up from wave ((iv)), wave (i) ended at 5179.87 and dips in wave (ii) ended at 5105.28. Index resumed higher in wave (iii) towards 5261.1. Pullback in wave (iv) ended at 5203.42. Internal subdivision of wave (iv) unfolded as a double three Elliott Wave structure. Down from wave (iii), wave a ended at 5229.87 and wave b ended at 5246.09. Wave c lower ended at 5216.32 which ended wave w. Rally in wave x ended at 5234.7. Down from wave x, wave a ended at 5225.05and wave b ended at 5230.38. Index then resumed lower in wave c towards 5203.42 which completed wave y of (iv). Near term, as far as pivot at 5105.28 stays intact, expect dips to find support in 3, 7, 11 swing for further upside.

Live stream - Dive into the excitement of real-time trading and Customize your market experience with us! While we specialize in futures, we're here to dive into the thrilling worlds of Crypto, ETFs, Equities, Bonds.We've also been on youtube/cfrn every day for years!

ES topCalled not lightly, gold and dollar are rising into PCE. Long weekend. I believe for the second time 5260is is ES top locally. I called it after FOMC as well, I share this with a lot of analysis behind it, but I could be disproven by 0dte distortions or general hysteria.
I would be very surprised to be disproven here, but we cannot predict.
Seeing symptoms of stagflation - growth collapse (PMI contraction levels) yet inflationary prints on PPI, CPI, PCE

Live stream - The TradingView Show with TradeStationHey fellow traders! This is our last live stream here, but be sure to follow our TradingView account as this show will CONTINUE as a video idea. We look forward to all your questions and comments.

Live stream - Step into the heart of real-time action with our lBe part of the action at 9:15 AM! We achieved our goal 85.11% of 2023 in the first 30 minutes from the market open. Dive in and seize the opportunity! Join our live trading session where we'll trade in the live stream until we reach our goal!

Live stream - US Open Live - 28 March: Hawkish Fed Speak, UK TecNews commentary and technical analysis, everyday Tuesday & Thursday 10 minutes before Wall Street opens, by FXCM’s Senior Financial Editorial Writer Nikos Tzabouras

US500 - Long after filling the imbalance Hello traders!
‼️ This is my perspective on US500.
Technical analysis: Here we are in a bullish market structure from 4H timeframe perspective, so I look for a long position. I wait price to continue the retracement to fulfill that huge imbalance and then to reject from S/R zone + FIBO 0.618 level.
Like, comment and subscribe to be in touch with my content!

US500 Guys, using the maximum filter for 3 days - signals were sent that everyone had arrived)
+ news seen today that everyone is long on shares)
will probably be damped soon
There has never been a total overheating of such signals.
SP:SPX TVC:SPX CBOE:SPX SPREADEX:SPX OANDA:SPX500USD AMEX:SPXL
There is also a strong downward signal this week

Spx500 short. Liquidity Phase, 5min reentry (Tier one. Rating B)Enter after MS to complete Liq Phase. Stop below the low of Liq Grab. RR: 1 to 1
Exercise great caution at 9:30 EST as we are likely to enter the market.

Spx500 short. Liquidity Phase, 5min entry (Tier one. Rating A)Enter after MS to complete Liq Phase. Stop below the low of Liq Grab. RR: 1 to 1
Exercise great caution at 9:30 EST as we are likely to enter the market.
Rating A cause liq phase is horizontal/.

Live stream - Morning Market Review - 28 March 2024Join FXCM senior market specialist Russell Shor for the morning market review.

Live stream - Forex Market Analysis (28th March)I host daily Pre-London live forex market analysis sessions to guide and educate you through the daily process of trading. I look at the major currency pairs and Gold. I will also analyze other pairs or instruments based on request from the audience.

Live stream - Indices Up Again, USD Is Still On Hold - Daily PitNikkei225, China50, ASX200, DJIA, S&P500, Nasdaq100, DAX40, FTSE100, DXY, Gold, Silver, WTI Oil, NatGas, Cocoa, Wheat, Bitcoin, Ethereum, Litecoin, Ripple, AUDUSD, NZDUSD, NZDJPY, USDJPY, USDCAD, USDCHF, GBPUSD, EURJPY, EURGBP, EURUSD.

Live stream - Fibonacci Masterclass (2/2): Expansions and Projec- What are Fibonacci expansions and projections?
- How are they different from each other?
- How do you use them to forecast market reversals?
- Combining them with retracements and extensions
- Live trading examples

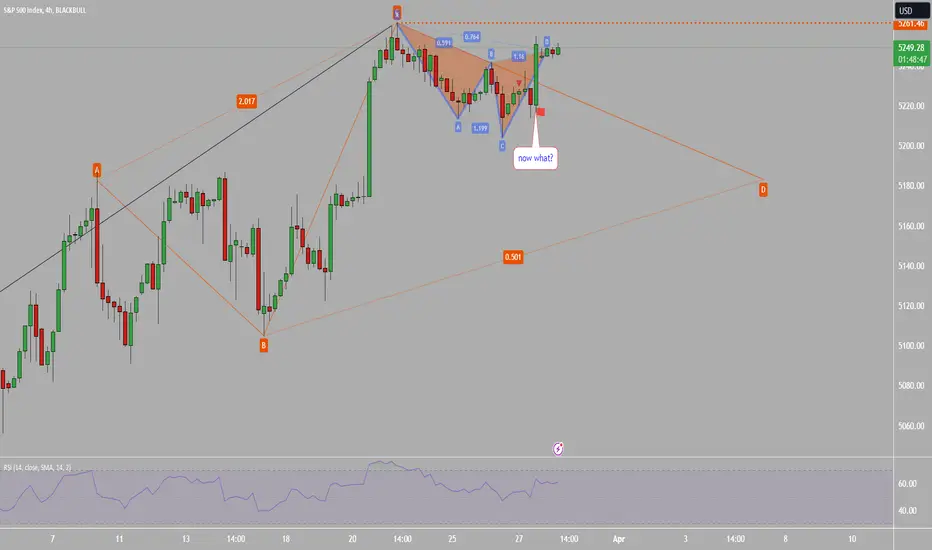
#SPX 260 Now what?Lets see how they kick the can down the road today on my birthday.
3 pm as expected yesterday to complete cypher
SPX500BUY ⚔️
Thank you, Mr. President Trump for pushing up the market
it's gonna lead the ship for the next profit do to the geo movement .

Could price reverse from the swing high resistance?Price is currently at the swing high resistance and could potentially reversal from this level to our take profit
Entry: 5258.22
Why we like it:
There is a swing high resistance
Stop loss: 5280.19
Why we like it:
There is an alignment with the 127.20% Fibonacci retracement
Take profit: 5218.49
Why we like it:
There is a pullback support and also aligns with the ascending trendline support
Please be advised that the information presented on TradingView is provided to Vantage (‘Vantage Global Limited’, ‘we’) by a third-party provider (‘Everest Fortune Group’). Please be reminded that you are solely responsible for the trading decisions on your account. There is a very high degree of risk involved in trading. Any information and/or content is intended entirely for research, educational and informational purposes only and does not constitute investment or consultation advice or investment strategy. The information is not tailored to the investment needs of any specific person and therefore does not involve a consideration of any of the investment objectives, financial situation or needs of any viewer that may receive it. Kindly also note that past performance is not a reliable indicator of future results. Actual results may differ materially from those anticipated in forward-looking or past performance statements. We assume no liability as to the accuracy or completeness of any of the information and/or content provided herein and the Company cannot be held responsible for any omission, mistake nor for any loss or damage including without limitation to any loss of profit which may arise from reliance on any information supplied by Everest Fortune Group.

$SPX Analysis, Key Levels & Targets for GDP SP:SPX Analysis, Key Levels & Targets for GDP
Alright, y’all… WOW, what a crazy move to end the day today…. It totally blew through the top of the trading range.
Tomorrow’s Trading range does have ATH’s in it. We also have GDP in premarket, PCE on Friday as well as Jerome Powell speaking on the last day of the quarter.
Should be an interesting last two days of the quarter.
Don’t forget to take profits when you’re up!!
