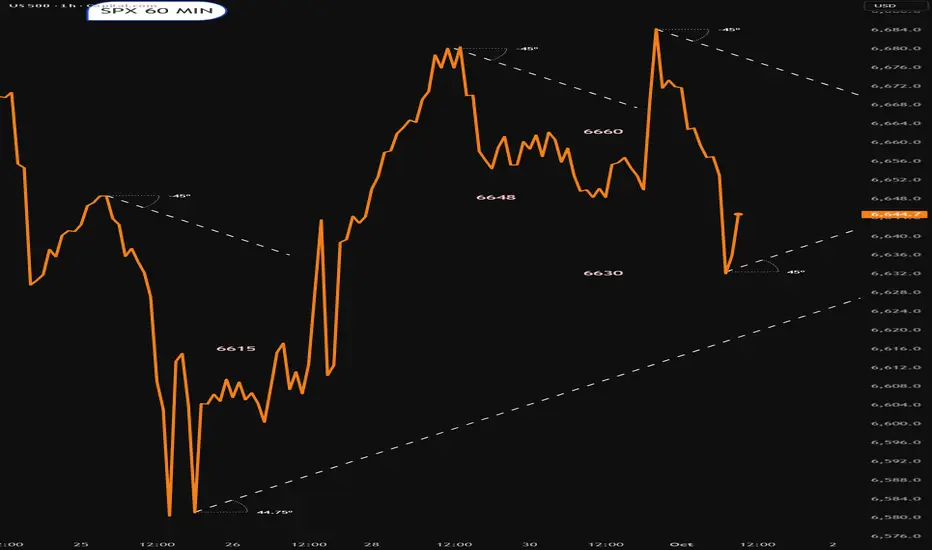
Bullish V Pattern In SPX/USDFellow Traders and followers, we have a bullish V pattern in SPX on the 4hr chart.
Everyone is bearish I'm sure, based on the rumor of a government shutdown, however the 4hr chart is showing a bullish V pattern . Huh!
Here are the numbers to watch ; Break out area is 6693.4. A hourly and 4hourly close above marks a confirmation of the pattern.
Target is at 6741.3 area.
If for any reason price breaks down below 6613 area bears would flood in and change the tide direction.
Best of luck in all your trades $$$
Trade ideas

S&P500 pushing to a new ATH?The S&P 500 (+0.34%) pushed to another record high as Q4 began, showing resilience despite ongoing US government shutdown risks and a weaker ADP private payrolls report, which signaled contraction. Markets leaned on expectations of faster Fed rate cuts, with Treasury yields falling sharply as investors reassessed labor market strength.
Sector drivers:
Gold and defensive plays gained as shutdown uncertainty supported safe-haven demand.
Tech outperformed: OpenAI’s $500bn valuation lifted AI-linked sentiment, with gains spilling into suppliers like Samsung and SK Hynix.
Cybersecurity risk weighed on software names after hackers claimed a breach of Oracle’s E-Business Suite, demanding ransom payments.
Apple slipped on reports it is halting Vision Pro updates to prioritize AI glasses.
Market tone: Optimism around rate cuts and AI-driven growth continues to underpin the S&P 500, but shutdown risks and labor market fragility remain key watchpoints for near-term volatility.
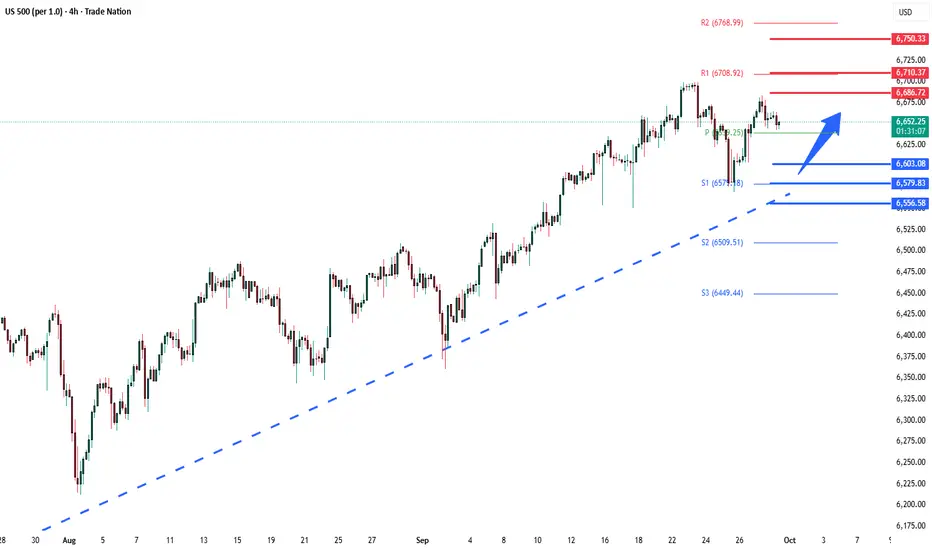
Key Support and Resistance Levels
Resistance Level 1: 6750
Resistance Level 2: 6770
Resistance Level 3: 6800
Support Level 1: 6680
Support Level 2: 6660
Support Level 3: 6640
This communication is for informational purposes only and should not be viewed as any form of recommendation as to a particular course of action or as investment advice. It is not intended as an offer or solicitation for the purchase or sale of any financial instrument or as an official confirmation of any transaction. Opinions, estimates and assumptions expressed herein are made as of the date of this communication and are subject to change without notice. This communication has been prepared based upon information, including market prices, data and other information, believed to be reliable; however, Trade Nation does not warrant its completeness or accuracy. All market prices and market data contained in or attached to this communication are indicative and subject to change without notice.

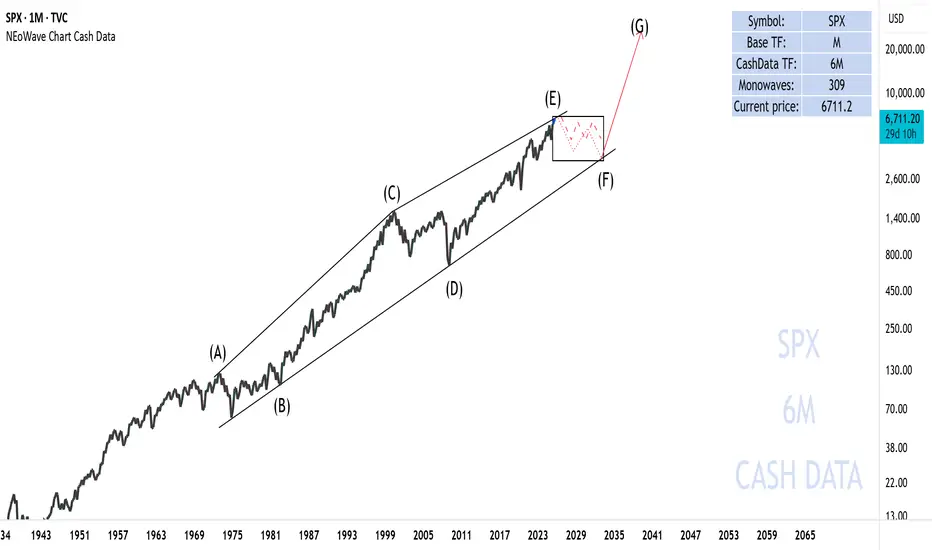
The corrective phase of the S&P
In my view, the S&P 500 index is forming a diametric pattern in the long-term timeframe, with wave (E) currently nearing completion. Following this, the index is expected to enter a corrective phase, which could involve both price and time corrections:
- The price correction may extend to the range of the drawn box, potentially dropping the index to 3,500 points.
- Alternatively, the price could decline to the 4,700–4,800 range and then consolidate over time to complete the time correction.
Good luck
NEoWave Chart
The S&P500 continues its climbRisk, (S&P500), continues to drive forward to new all time highs. 7000 is getting closer. The bullish channel suggests a 7000 target date window of 21 Oct to 15 Dec of this year. Let's see what happens.
#SP500
#SP500Trading

SP500 Bearish Outlook With Tight SLBearish Technical Reading
• The index is currently trading near 6,728 after a strong recovery rally.
• Nearest hypothetical major resistance: 7,125 (weekly supply + marked zone).
• Nearest key support: 6,150 – 6,170 (structural pivot, last defended level).
• Breakdown from this zone could trigger a deeper correction.
________________________________________
Bearish Trade Setup (Tighter Levels)
• Entry: Short around 6,700 – 6,750 (current resistance zone).
• Stop Loss: 7,150 (above weekly resistance to avoid fakeouts).
• Take Profit 1 (TP1): 6,150 – 6,170 (structural demand, first bearish magnet).
• Take Profit 2 (TP2): 4,820 – 4,850 (major demand, previous accumulation zone).
________________________________________
Logic Behind Levels
• Stop Loss 7,150 is placed above the marked resistance — if price breaks and holds above, bearish thesis weakens.
• TP1 at 6,150 matches the exact key support drawn on your chart — logical place to secure partials.
• TP2 at 4,820 aligns with historical strong demand and would only be targeted if shutdown-driven fear prolongs and selling accelerates.
________________________________________

S&P500 (US500): Another BoS
US500 updates the all-time high yesterday, breaking a resistance
cluster based on a previous high.
It opens a potential for more growth now.
Next goal - 6750
❤️Please, support my work with like, thank you!❤️
I am part of Trade Nation's Influencer program and receive a monthly fee for using their TradingView charts in my analysis.

S&P500 H1 | Bullish Momentum Extending FurtherBased on the H1 chart analysis, we could see the price fall to the buy entry at 6,682.33, which is a pullback support and could bounce from this level to the upside.
Stop loss is at 6,651.10, which is a pullback support.
Take profit is at 6,731.11, which line sup with the 161.8% Fibonacci extension.
High Risk Investment Warning
Trading Forex/CFDs on margin carries a high level of risk and may not be suitable for all investors. Leverage can work against you.
Stratos Markets Limited (tradu.com ):
CFDs are complex instruments and come with a high risk of losing money rapidly due to leverage. 65% of retail investor accounts lose money when trading CFDs with this provider. You should consider whether you understand how CFDs work and whether you can afford to take the high risk of losing your money.
Stratos Europe Ltd (tradu.com ):
CFDs are complex instruments and come with a high risk of losing money rapidly due to leverage. 66% of retail investor accounts lose money when trading CFDs with this provider. You should consider whether you understand how CFDs work and whether you can afford to take the high risk of losing your money.
Stratos Global LLC (tradu.com ):
Losses can exceed deposits.
Please be advised that the information presented on TradingView is provided to Tradu (‘Company’, ‘we’) by a third-party provider (‘TFA Global Pte Ltd’). Please be reminded that you are solely responsible for the trading decisions on your account. There is a very high degree of risk involved in trading. Any information and/or content is intended entirely for research, educational and informational purposes only and does not constitute investment or consultation advice or investment strategy. The information is not tailored to the investment needs of any specific person and therefore does not involve a consideration of any of the investment objectives, financial situation or needs of any viewer that may receive it. Kindly also note that past performance is not a reliable indicator of future results. Actual results may differ materially from those anticipated in forward-looking or past performance statements. We assume no liability as to the accuracy or completeness of any of the information and/or content provided herein and the Company cannot be held responsible for any omission, mistake nor for any loss or damage including without limitation to any loss of profit which may arise from reliance on any information supplied by TFA Global Pte Ltd.
The speaker(s) is neither an employee, agent nor representative of Tradu and is therefore acting independently. The opinions given are their own, constitute general market commentary, and do not constitute the opinion or advice of Tradu or any form of personal or investment advice. Tradu neither endorses nor guarantees offerings of third-party speakers, nor is Tradu responsible for the content, veracity or opinions of third-party speakers, presenters or participants.

The Evolution of the Market
I was always curious of what the market was like pre algorithms and computerized trading from market makers, and this is what prompted this research / article. Through the pursuit of this quesiton, I discovered some really surprising things. Mostly, the impact of the retail influx is actually quite visible in the data and statistics when you break down the market to its components. The exact time and the effect of the influx of retail and the "meme stock era" actually fundamentally changed market dynamics, as you will see how in this article!
So here I am to talk about the market evolution, as told by Statistics using the S&P. A very special thanks to Tradingview for giving such rich data on the S&P, allowing me to pull data as far back at 1888. Thanks so much Tradingview!
Now, lets get into it!
Introduction
The story of market evolution is really the story of how information is processed into price. From the ticker-tape era of the late 19th century to today’s machine-driven trading, each wave of innovation has left fingerprints in the data. With access to SPX data stretching back to 1888 (thanks again Tradingview!), we can actually test for these regime shifts.
My question was simple: did the rise of algorithmic and computer-driven trading — starting in the 1980s — measurably change the character of market price action? My thesis is that computer based alogirthms should have acted on the market in the following ways:
a) Should make the market more linear in nature via use of computer algorithms heavily based in linear algebra.
b) Reduced randomness in the data structure.
c) Made markets more efficient.
To answer these questions and find whether my theses were in fact valid, I applied a battery of statistical tests, regime backtests, and structural break analyses across defined eras of market history.
Descriptive Statistics: Shifting Return Distributions
I first grouped the data into six eras:
1888–1910
1910–1950
1950–1970
1970–1990
1990–2010
2011–current
For each, I computed mean returns, volatility, skewness, kurtosis, and a normality test.
You can see the results in the table below:
Findings:
Early markets (1888–1910) show wide swings and near-normal distribution.
Post-WW2 (1950–1970) returns were calmer, with reduced volatility.
From 1970–1990, skewness and kurtosis exploded, showing fat-tailed events — think oil crisis, stagflation, and 1987 crash.
2011–current is defined by higher kurtosis and volatility clustering, consistent with an environment dominated by algorithmic and high-frequency trading.
💡 Trading Tip: When kurtosis is high, risk is concentrated in rare but violent moves. Simple VaR (volatility) measures understate risk. Options traders often exploit this by buying long-dated wings (cheap out-of-the-money puts/calls) in high-kurtosis regimes.
Autocorrelation and Randomness
I then ran the Ljung–Box test (serial correlation) and Runs test (randomness), which you can see the results in the table below.
Pre-1970 markets often failed randomness tests → returns weren’t fully efficient, suggesting exploitable patterns.
Post-1990, autocorrelation is near-zero (high-frequency traders and quants arbitrage away serial dependence quickly).
However, runs test still showed occasional streakiness, especially in 2011–current (momentum bursts).
💡 Trading Tip: Don’t fight market efficiency. In modern data, intraday edges based on lagged correlations vanish quickly. Better edge: look for volatility regime shifts or structural breaks rather than naive mean reversion. And we will get into this more later in this article!
Variance Ratio & Hurst Exponent: Random Walk vs. Persistence
Variance Ratio tests showed early markets >1 (predictable mean reversion), but after 1990 values dipped negative, which tends to signify momentum behavior. See the tables below:
Looking at the Hurst exponent, it hovered at ~0.55 pre-2000 (persistent trending), but dropped toward 0.48 post-2011 indicating a move from randomness to more stability.
💡 Trading Tip: Momentum is not dead, but its timescale is compressed. Where trends once lasted months, they now play out in days or weeks. Swing traders should shorten holding horizons in the modern era based on these results. And I am sure we all can relate after the initial crash we saw at the beginning of 2025 and how quickly it recovered! This quick recovery without retracement of lows showed up as a market rule from 2018 and on (more on that later).
GARCH Volatility Clustering
Before I get into this analysis, I just want to clarify what GARCH is, as it is discussed a bit among quant traders and chances are you may have heard it but not quite sure what it's all about.
GARCH — short for Generalized Autoregressive Conditional Heteroskedasticity — is a model designed to capture how market volatility clusters in time. Essentially, it recognizes that periods of calm trading are usually followed by more calm, and turbulent days are usually followed by more turbulence.
Instead of assuming volatility is constant, GARCH lets it “breathe” with the market:
When shocks hit (e.g., 2008 crisis, 2020 COVID crash), volatility spikes, and the model expects more big moves ahead.
When markets settle, volatility decays slowly rather than instantly snapping back.
This persistence — where high volatility begets high volatility — is one of the defining features of financial time series, and GARCH is the workhorse model used to measure it.
So keeping this in mind, let's discuss the results.
I Fitted multiple GARCH(1,1) models which gave me alpha + beta ≈ persistence.
What this means is summarized below by era:
Pre-1980: persistence ~0.95 (long-lived volatility shocks).
Post-2010: persistence ~0.97 — extremely sticky volatility.
This shows that volatility has become a regime in itself — shocks last longer and decay more slowly.
💡 Trading Tip: In persistent volatility regimes, selling short-dated options (expecting “vol will collapse”) is dangerous. Instead, structured spreads (calendars/diagonals) are safer because they profit from persistence.
Regime-Based Backtests: Momentum vs. Mean Reversion
I backtested two toy strategies inside each era:
Momentum: buy after up days.
Reversion: fade after up days.
Results:
Interpretation Tip: This chart shows 2 toy strategies applied, one based on momentum (i.e. last day was positive, I am going to just go ahead and long the next day, inverse if last day was negative) vs mean reversion (essentially playing to major SMAs). The lower the number, the better the strategy (negative numbers in this case are GOOD and positive are BAD, 0 is net flat).
Here is the summary of the results:
1910–1950: reversion dominated (thin markets, order-driven).
1970–1990: momentum exploded (indexing, funds, trend-followers).
2011–current: momentum again shows dominance, possibly linked to retail trading waves post-2018 (e.g., meme stocks, option gamma squeezes).
This is the result that shocked me the most. You can literally see from this chart, at about 2018, the market abandoned mean reversion in favour of momentum to a statistically significant extent!
This information is incredible and actually really forces me to rethink some of my mean reversion based strategies. This also happens to coincide with meme stock eras, early introduction of trading apps and the whole, as I call it, "democratization of trading for everyone". We can literally see the retail footprint show up and how retail has fundamentally shifted market dynamics away from mean reversion to more about momentum.
This just amazes me, I was never expecting to actually be able to physically see how dramatic retail has impacted the market! And this was never the intention of this research, it was focused mostly on looking at how the market has evolved in relation to computer algorithms and AI, but just happened to also pick up on the retail bandwagon influx in the crossfire.
💡 Trading Tip: Regime awareness matters. In reversion eras, fading strength is profitable. In momentum eras, chasing breakouts is. Today, evidence leans momentum, but in short bursts (intraday to multi-week).
Bai–Perron Structural Breaks
Oh man, this one was a nightmare.
Being a quant trader, I have some serious computing power and servers and this really gave them a run for their money.
This test essentially explores for statistically significant regime shifts. It identifies them on its own and returns the dates of the independent regimes. This took some hours to process, but essentially what it has done is identified, on SPX, independent regimens that are fundamentally different from each other.
Here is the raw table breakdown of the regimes:
And displayed overlaid with the close of the S&P:
Breaks detected:
1929–1933: Great Depression.
1973–1987: Oil crisis → Black Monday.
2000–2009: Dot-com → Global Financial Crisis.
2020: COVID volatility shock.
These align almost perfectly with historical crises.
The point of the function is essentially to just have an unbiased, algorithm validate that there are or have been independent shifts and regimes present in the market, without us imposing our own opinions (i.e. "the market has never been the same since 2008" and don't forget the million dollar "Trump market" (which by the way is disproved as significant using this analysis, there is no statistically significant difference in a "Trump market" or it would have shown up ;) ).
💡 Trading Tip: Structural breaks matter most to macro investors. Regime shifts reset correlations, volatility, and trend behaviors. After 2020, treating markets as “post-2010 continuation” is wrong — structurally, a new volatility regime has been in play.
Conclusion
So, what can we say about all of this?
The statistical fingerprint of markets has changed dramatically:
Early 20th century: mean-reverting, inefficient.
1950–1970: calm postwar boom.
1970–2000: fat tails, trend-followers dominate.
2000–2010: crash-prone, clustered volatility.
2011–current: machine-driven randomness punctuated by bursts of momentum (often retail-driven).
To answer my initial question regarding whether the introduction of computing and AI fundamentally shifted the market, looking at the data, it suggests that algorithmic trading didn’t make markets “more linear.” Instead, it compressed timescales, enforced near-randomness, and amplified volatility persistence. Retail surges post-2018 added another layer: sudden, meme-like bursts of momentum.
But here are the things that surprised me the most and I think should be really taken away from this research and thought about. These are my observations:
The market went from a true Random-walk situation from 1888 to 1950, to a more trendy and predictable version in 1950 to 1980.
The era between 1888 and 1950 and the era between 1950 and 1990 are fundamentally different. These are not the same markets anymore and there aren't any visible remnants of our 1900s, 1920s, 1950s or even 1990s markets. This matters because we can't really compare this current market to say the dotcom bubble, since the factors that made up the market mechanics in that era are fundamentally different than currently. As well, those using strategies that are based on 'old regimens', such as EWT or certain pattern formations (for me, I use Bulkowski patterns who did the majority of his analyses and statistics in the 1990s) are defunct. The regimen is different, its changed and it is fundamentally different. Thus, is is unlikely that the traditional patterns from the 90s or the EWT as it was written in the 1930s, a regimen that was fundamentally different, mean reversion based, will hold up in the current market climate. Remember, 1920s to about the 1950s was a major mean reversion era, the market has now moved away from mean reversion. So these strategies built on those dynamics need to be approached with absolute caution.
In all, I am glad I spent hours doing this because I will have to look into revamping some of my own stuff to be more in line with the current era. I have noticed some of Bulkowski's patterns just don't work, and now it makes sense. I also noticed some of my old mean reversion strategies aren't that great anymore either, and now it makes sense.
Whether you are a technical trader or a quant trader, statistics can help you understand the reason and rationale and guide you in your pursuit of profitable trading, without diverging your strategy (you can remain technical based or quant based, you just can be informed about the nitty gritty of it all with stats). And I hope that this analysis/article helps you see the usefulness of stats in guiding your understanding of market mechanics.
I will leave you with some final pragmatic advice based on the analysis:
Trade shorter momentum bursts.
Respect volatility persistence.
Use structural break analysis to anticipate when “old rules” stop applying. (more advanced but if you are up for it!)
The key take away from all of this heavy stats stuff, if anything, is that we are in a momentum driven market that does not favour mean reversion and is quick to shake off downside volatility.
I hope you found this insightful, this took a bunch of time to process these analyses and then write this post, so if you enjoyed it and found it helpful, share some love with a like and/or comment!
Thanks so much everyone and as always safe trades!
Special thanks again to Tradingview for the great data!
To Grammarly for hopefully having edited errors in this post!
SORA for the cover art.
And to R for providing the means of the analysis.
As well, the biggest thanks to you all, the Tradingview community, for reading, interacting and engaging!

Some ideas and some concernsSP long term view, Dow Jones Transports, and I discuss the patterns on High Yeild Bonds. Cycle experts are warning that a recession may be very close.

The AI Bubble's Final Act II: The Convergence TightensRetail flushed. Institutions trapped. The Fed flying blind. Welcome to October.
The AI Bubble's Final Act II: The Convergence Tightens
Why the AI Bubble Narrative Just Got Its Lehman Moment
This post is a direct sequel to my September thesis: If you haven’t read that, start there⬇️ - this builds on the trigger map 🗺️.
The BLUEBERRY:SP500 continues hovering near cycle highs at 6,700, but structural cracks are widening beneath the surface. The AI-led rally driven by NASDAQ:NVDA $100 billion commitment to OpenAI shows classic signs of saturation: volume decay, RSI divergence, and what analysts are now calling "circular financing." Nvidia invests $100 billion in OpenAI, which then turns around and spends it back on Nvidia chips - this is the capex circularity that marks bubble peaks.
With the U.S. government shutdown now confirmed as of October 1, 2025, macro liquidity stress adds a critical new layer of fragility. This aligns perfectly with our thesis: August CME:BTC1! top + September 30 shutdown = narrative inflection zone. I remain cautious on TVC:SPX upside and alert for volatility expansion.
Cycle echoes from 2007-2008 are in play. The boom is fragile. The Fed now faces a critical blindfold - key data streams are frozen mid-cycle. Without payrolls, inflation prints, or consumer metrics during the shutdown, policy decisions risk catastrophic miscalibration at the exact moment when precision matters most.
🧭 Why This Convergence Matters
I am not claiming that IG:BITCOIN and SP:SPX are traditionally correlated - even though the chart shows an eerily close alignment over the past decade. I'm mapping trigger timing across asset classes - the simultaneous exhaustion of different market participants:
BTC top (August 2025) = Retail exhaustion. The most speculative, leveraged traders have already been flushed out. When crypto peaks first, it signals risk appetite is rolling over.
SPX stall (September 2025) = Institutional fragility. The "smart money" that rotated from crypto into AI stocks is now trapped at peak valuations with nowhere left to rotate.
Shutdown (October 1, 2025) = Macro blindfold. Just as markets need maximum visibility, the government turns off the economic data dashboard. The Fed is flying blind.
Together, they form a convergent signal - just like Lehman + SP:SPX top + credit freeze in September 2008 . These weren't correlated, they were coincidental triggers that revealed the same underlying disease: excess leverage meeting liquidity shock.
📌 The Three Inflection Markers
🔹 Nvidia's $100B Commitment to OpenAI
📆 Date: September 22, 2025
Details: NASDAQ:NVDA pledged up to $100 billion to deploy 10 gigawatts of AI infrastructure for OpenAI progressively, marking peak capex saturation in the AI infrastructure buildout.
The Circular Financing Problem: Think of it like a closed-loop economy where the same money keeps circulating without creating real external demand. NASDAQ:NVDA invests $100 billion in OpenAI, which OpenAI then gives back to NASDAQ:NVDA for chips and infrastructure. This isn't wealth creation, it's musical chairs with capital. When the music stops, the question becomes: who's actually making money selling AI services to end customers?
Echo: Mirrors NASDAQ:CSCO dot-com era infrastructure frenzy, when telecom companies borrowed billions to buy Cisco equipment, creating the illusion of sustainable demand until the debt bubble popped.
🔹 The Cisco Precedent: When Infrastructure Investment Becomes Speculation
📆 Date: March 27, 2000
Peak Valuation: ~$550 billion - briefly the most valuable company in the world
The Story: During the dot-com boom, everyone "knew" the internet would change everything. They were right. But NASDAQ:CSCO still crashed 70%+ and never regained its 2000 peak even 25 years later.
Why? Capex-driven euphoria created demand that didn't exist organically. Telecom companies and startups borrowed money to build infrastructure faster than actual usage could justify. When funding dried up, demand evaporated overnight, leaving NASDAQ:CSCO with inventory, overcapacity, and shocked investors.
2025 Parallel: Everyone "knows" AI will change everything. They're probably right. But that doesn't mean NASDAQ:NVDA at current valuations survives the transition. The infrastructure buildout is running ahead of monetizable demand - classic late-cycle behavior.
🔹 U.S. Government Shutdown - The Macro Blindfold
📆 Start Date: October 1, 2025 at 12:01 AM
Trigger: Congressional deadlock over partisan spending bill and healthcare provisions
The Economic Data Blackout: During shutdowns, critical federal data releases get delayed or suspended:
Bureau of Labor Statistics (jobs reports, unemployment, wage data)
Bureau of Economic Analysis (GDP, consumer spending, inflation components)
Census Bureau (retail sales, construction, housing data)
Federal Reserve inputs for policy decisions
Why This Is Catastrophic Timing: The Fed is trying to navigate a soft landing while cutting ECONOMICS:USINTR rates with unemployment ECONOMICS:USUR rising. That requires precise, real-time data. Instead, they're getting a multi-week (or multi-month) information blackout at the exact moment when leading indicators are rolling over. It's like turning off your GPS while driving through a construction zone at night.
Historical Parallel - 2008: Bear Stearns collapsed in March 2008, but the Fed thought they'd contained it. Lehman failed in September because policymakers were operating on lagged, incomplete data about how quickly the contagion was spreading. The shutdown creates a similar fog of war.
The Convergence Thesis: Three Dominoes, One Direction
These three events aren't causing each other - they're revealing the same underlying condition: peak leverage meeting exhaustion.
1️⃣ Stage 1 (August): Retail speculators in crypto get wiped out first. BTC tops at $109K, starts rolling over. This is the canary in the coal mine - the most risk-seeking capital runs out of buyers.
2️⃣ Stage 2 (September): Institutional money realizes the AI trade is overcrowded. Nvidia's circular financing deal with OpenAI triggers analyst warnings about an AI bubble. Smart money starts quietly rotating to cash and defensives, but the indexes stay elevated due to passive flows and concentration in mega-caps.
3️⃣ Stage 3 (October): Government dysfunction removes the Fed's ability to respond quickly or accurately. Markets lose confidence that policymakers can even see the problems, let alone fix them. Volatility expands as uncertainty compounds.
Think of it like a forest fire. INDEX:BTCUSD was the dry brush catching first. The AI stocks are the trees - bigger, but still combustible. The government shutdown is the wind that accelerates the spread. You don't need correlation between brush, trees, and wind to know the conditions are perfect for disaster.
What Happens Next: The Three Scenarios
🟠 Scenario 1: Controlled Decline (45% probability)
Shutdown resolved within 2-3 weeks
SP:SPX corrects to 6,400-6,200 range (-5 to -10%)
Fed pauses cuts, reassesses within Q4
Market stabilizes but stays defensive through year-end
This is the "best case" - pain, but manageable
🔵 Scenario 2: Accelerated Unwind (40% probability)
Shutdown extends 4+ weeks, economic data gap widens
SPX breaks 6,000, triggers algorithmic selling cascade
Target: 5,200-5,500 range (-20 to -25%)
Credit spreads widen, corporate debt refinancing concerns emerge
This is my base case - the scenario I'm positioned for
🔴 Scenario 3: Systemic Event (15% probability)
Shutdown coincides with unexpected credit event (corporate default, regional bank stress)
Multiple margin calls and forced liquidations
SPX crashes to 4,500-4,800 range (-30 to -35%)
Fed emergency intervention required (rate cuts, QE restart)
Low probability, but non-zero - the true "black swan" outcome
📊 Technical Setup: The Chart Doesn't Lie
Current Level: 6,700 (near all-time highs)
Key Support Levels:
6,200: Previous resistance turned support - first real test
5,800: 200-day moving average - psychological line in sand
5,200: Fibonacci 38.2% retracement - institutional rebalancing zone
4,500: 2024 breakout level - panic capitulation target
⚠️ Warning Signals Already Visible:
Market breadth deteriorating (fewer stocks making new highs)
Defensive sectors outperforming (utilities, healthcare, staples)
Credit spreads starting to widen (HYG/TLT ratio declining)
VIX base level rising from 12 to 16+ (fear premium expanding)
The Bottom Line: Risk/Reward Is Clear
At SP:SPX 6,700 with the Fed flying blind, AI capex circularity exposed, and retail already flushed from crypto CRYPTOCAP:TOTAL , the risk/reward for long positions is terrible. You're risking 10-15% to potentially gain what - another 3-5% before reality hits?
Smart money is raising cash, buying volatility, and preparing shopping lists for when quality names trade at distressed prices. The convergence of COINBASE:BTCUSD top, NASDAQ:NVDA circular financing peak, and government shutdown isn't causing a crisis - it's revealing that we're already in the early stages of one.
August was the warning. September was the setup. October is the trigger.
The market doesn't need to crash tomorrow, but the margin of safety has disappeared. When the next shoe drops - earnings disappointment, credit event, geopolitical shock, employment spike - there's no cushion left. Only air.
Position accordingly.
Until the next trigger - Nicholas.
Disclaimer: This post reflects my personal views and analysis. It is not financial advice. Please do your own research and manage risk accordingly.

S&P 500 – Steady Uptrend Within Rising ChannelThe S&P 500 continues to grind higher within a well-defined rising channel, holding above both the 50-day SMA (6,486) and the 200-day SMA (6,023), which reinforces the broader bullish structure. Price action has respected the channel boundaries since May, with the recent bounce off the mid-line suggesting buyers remain in control.
Momentum indicators support the bullish bias:
MACD is positive, showing steady upside momentum.
RSI sits near 68, not yet overbought but approaching elevated levels, hinting at a possible test of the channel’s upper boundary.
As long as price holds above the 6,600 zone, the path of least resistance remains higher, with the channel top near 6,800 as the next potential target. A break below the channel support, however, could trigger a corrective pullback toward the 6,450–6,500 area, aligning with the 50-day SMA.
Overall, the trend remains bullish, with dips likely to be treated as buying opportunities while the channel structure holds. -MW

PROP TRADING - BLESSING OR TRADING GROUND?🧠 Prop Trading – Blessing or Training Ground?
📝 Summary
Prop trading looks like the fast track to capital: low costs, high profits.
In reality, most providers are built on fees rather than trader success.
For beginners, it can be valuable – as a training platform for risk, drawdown & psychology.
For professionals, it’s rarely a long-term home – the structures aren’t made for that.
1️⃣ The Temptation
Prop trading sells a dream:
👉 “Pay little – get capital – earn big.”
Entry with small fees or even free challenges
No bank account, no license required
Promise of quick profit
For many, it feels like a shortcut – cheap in, fast up.
But firms have built their models psychologically perfect.
2️⃣ The Challenge Structure
Phase 1 → e.g. +10% target with limited drawdown
Phase 2 → seemingly easier: only +5% target
Afterwards → “Funded Account” + fee refund
But don’t underestimate the details:
Strict drawdown rules
News trading bans, slippage, spread expansions
Execution delays in volatile phases
👉 If you use it wisely, you learn discipline, risk management, and patience – things no other “training” will teach you.
3️⃣ The Funded Account – Reality vs. Illusion
Even if you are “funded”:
In almost all cases, it remains a demo account.
First payouts (3'000–5'000 CHF) are often possible.
After that, your behavior is closely checked for scalability.
Traders who earn too much too quickly often face limits:
Internal rule restrictions
Additional reviews
Accounts frozen at the first irregularities
4️⃣ Why Professionals Rarely Stay
Firms say: “We are looking for top traders.”
In reality, they look for traders who fit the business model – pay fees regularly, stay within risk.
Consistently strong professional traders don’t fit long term, because they could outgrow the system.
5️⃣ The Bait: Certificate & “Diploma”
Many prop firms lure you with the promise of becoming a “certified trader.”
Often you get a certificate already after Phase 1 (PDF or badge).
Psychologically clever: the euphoria is huge – you instantly feel like a pro.
Phase 2 then looks easier – lower percentage target, less pressure.
Many traders think: “I already have a certificate, I’m a pro now – I’ll crush this.”
But here’s the trap:
Some need 20–30 attempts to pass.
In total, they pay thousands in fees – for a piece of paper with no value.
Step by step, the trader is pulled into a system where it’s no longer about capital, but about repeated fee payments.
👉 Important for beginners:
Always take a break between challenge phases.
Let the euphoria cool off, reflect on mistakes, and adjust risk management.
Otherwise, the firm’s psychology will overwhelm you.
6️⃣ Scam or Learning Opportunity?
👉 From my own experience after many years of trading and testing prop firms:
For beginners, it can be gold.
Simulated rules force you into discipline.
You learn to handle drawdowns, risk limits, and trading psychology.
Free or low-cost challenges = almost like a training program.
For professionals, it’s no home.
Payouts are capped.
A real career needs your own structure (capital, company, partnerships, family office).
7️⃣ Conclusion
Prop trading is not a scam – but also not a professional career path.
For beginners: a valuable training ground
For pros: a temporary stop, not the future
For everyone: question the price of your “diploma” – it’s not real value, just marketing.
👉 Treat prop trading as education – not the end goal.
Use it to sharpen your rules.
But in parallel, build your own capital and your own structure.
🔚 Final Thought:
“A prop account can teach you rules –
but true freedom can only be built with your own capital.”


US500 at Record Highs: Caution Ahead of Options ExpirationUS500 at Record Highs: Caution Ahead of Options Expiration
The US500 recently reached a new all-time high near 6700 but quickly retraced back to 6570. The index managed to recover most of those losses, climbing again toward 6680.
In my view, however, we could be approaching the start of a downtrend that may develop by the end of the month.
In my view, we could be on the verge of a short-term downtrend soon, which could be created by the end of the month.
Today marks not only the end of the month but also the close of both monthly and quarterly data.
For indices, this coincides with option expirations, which often increase market volatility. Given the prolonged upward trend, these expirations could trigger corrective moves, so caution is needed.
You may find more details in the chart!
Thank you and Good Luck!
❤️PS: Please support with a like or comment if you find this analysis useful for your trading day❤️
SPX500 H1 | Bearish Momentum BuildingS&P500 is rising towards the sell entry at 6,647.13, which is an overlap resistance and could drop from this level to the take profit.
Stop loss is at 6,681.57, which is a multi-swing high resistance.
Take profit is at 6,614.24, which is a pullback support that aligns with the 61.8% Fibonacci retracement.
High Risk Investment Warning
Trading Forex/CFDs on margin carries a high level of risk and may not be suitable for all investors. Leverage can work against you.
Stratos Markets Limited (tradu.com ):
CFDs are complex instruments and come with a high risk of losing money rapidly due to leverage. 65% of retail investor accounts lose money when trading CFDs with this provider. You should consider whether you understand how CFDs work and whether you can afford to take the high risk of losing your money.
Stratos Europe Ltd (tradu.com ):
CFDs are complex instruments and come with a high risk of losing money rapidly due to leverage. 66% of retail investor accounts lose money when trading CFDs with this provider. You should consider whether you understand how CFDs work and whether you can afford to take the high risk of losing your money.
Stratos Global LLC (tradu.com ):
Losses can exceed deposits.
Please be advised that the information presented on TradingView is provided to Tradu (‘Company’, ‘we’) by a third-party provider (‘TFA Global Pte Ltd’). Please be reminded that you are solely responsible for the trading decisions on your account. There is a very high degree of risk involved in trading. Any information and/or content is intended entirely for research, educational and informational purposes only and does not constitute investment or consultation advice or investment strategy. The information is not tailored to the investment needs of any specific person and therefore does not involve a consideration of any of the investment objectives, financial situation or needs of any viewer that may receive it. Kindly also note that past performance is not a reliable indicator of future results. Actual results may differ materially from those anticipated in forward-looking or past performance statements. We assume no liability as to the accuracy or completeness of any of the information and/or content provided herein and the Company cannot be held responsible for any omission, mistake nor for any loss or damage including without limitation to any loss of profit which may arise from reliance on any information supplied by TFA Global Pte Ltd.
The speaker(s) is neither an employee, agent nor representative of Tradu and is therefore acting independently. The opinions given are their own, constitute general market commentary, and do not constitute the opinion or advice of Tradu or any form of personal or investment advice. Tradu neither endorses nor guarantees offerings of third-party speakers, nor is Tradu responsible for the content, veracity or opinions of third-party speakers, presenters or participants.

Quarterly Holdings Report:Quarterly Holdings Report:
Ripple/XRP
Dogecoin/DOGE
Ryujin/RYU
Amaterasu Omikami
Floki Inu
Brett (Based)
Injective/INJ
Render/RNDR
BITI:US
AAPL:US
NVDA:US
WEC:US
TJX:US
VGT:US
HD:US
GLD:US
LOW:US

S&P 500 Future Outlook: Targeting 7,000 by 2026Overview Summary
The TVC:SPX has staged an impressive recovery throughout 2025, breaking free from the spring correction and climbing within a well-defined rising channel. Many anticipated September to be a bearish month based on historical trends, but momentum is continuously being fueled by resilient earnings, AI-driven productivity themes, and renewed capital inflows. With price currently consolidating around the mid-6,600s, our outlook anticipates a continuation of this structural uptrend toward the psychological 7,000 level, aligning with both technical momentum and macro capital drivers.
Technical Analysis
The index is trending within a clear ascending channel, respecting both upper and lower boundaries since Q2. Each pullback has found consistent demand along channel support, followed by strong recoveries. As shown in our TradingView chart analysis, projected channel extension carries SPX toward 6,900–7,000 by year end.
Key Support Entry: 6,500-6,600
Key Resistance Target: 6,900–7,000
A clean break and close below 6,300 would invalidate near-term bullish structure and open risk toward deeper supports near 6,000.
Macro/Fundamental Thesis
Macro conditions remain a dual force. On one hand, AI investment, corporate buybacks, and strong tech leadership ( NASDAQ:NVDA , NASDAQ:AMD , NASDAQ:SMCI , NYSE:ANET ) are powering higher valuations. On the other, elevated rates, energy costs, and global growth uncertainty remain constraints. Capital rotation into equities continues as investors seek exposure to U.S. resilience and innovation themes.
Overall, the index remains supported by structural liquidity and the digital infrastructure super cycle. A decisive test of $7,000 is our base case as long as buyers continue defending channel support zones.
Green Zone Capital
Bias: Long
Type: Trend Continuation
Entry Zone: 6,500–6,600 (pullback buys)
Target: 7,000+ (psychological milestone + channel projection)
Invalidation: Break below 6,300 (channel support)
Conclusion
The TVC:SPX continues to trade within a constructive uptrend, supported by both technical structure and macro demand for U.S. equities. As long as buyers defend the mid-6,300 support area, the broader market remains positioned for continuation toward the 7,000 milestone. This level represents not only a psychological benchmark but also the upper boundary of the current channel extension. While volatility and pullbacks should be expected, the prevailing trend favors strength, and disciplined accumulation within support zones offers attractive risk-reward for long-term investors.

S&P500 Short-term Bull Flag formed.The S&P500 index (SPX) has been trading within a Channel Up since the July 31 High. The price is currently on its 4H MA50 (blue trend-line), forming a Bull Flag after a 4H MA100 (green trend-line) rebound last Thursday.
This is similar to the Bull Flags of August 25 and 05, which both ended with a rise to the 1.236 Fibonacci extension. Even the 4H RSI sequences among the 3 fractals are similar with their Lower Highs structures. The only difference is that the price bottomed this time on the 4H MA100 (as mentioned), instead of the 4H MA200 (orange trend-line) of the previous 3 times.
As a result, if this Bull Flag holds, we expect a quick rally to 6720 (just under Fib 1.236).
-------------------------------------------------------------------------------
** Please LIKE 👍, FOLLOW ✅, SHARE 🙌 and COMMENT ✍ if you enjoy this idea! Also share your ideas and charts in the comments section below! This is best way to keep it relevant, support us, keep the content here free and allow the idea to reach as many people as possible. **
-------------------------------------------------------------------------------
💸💸💸💸💸💸
👇 👇 👇 👇 👇 👇

S&P500 uptrend continuation?Key Drivers for S&P 500
Government shutdown risk: With no deal in sight and a 79% market-implied probability of a shutdown tomorrow, headline risk is elevated. Historically, most shutdowns have been short, but lingering political uncertainty could weigh on sentiment.
Rates & bonds: A global bond rally (10yr USTs -3.6bps) supported equities, particularly rate-sensitive and cyclical sectors. Lower yields are helping housing-linked names, as shown by the strong pending home sales data.
Commodities: Oil’s sharp decline (-3.45%, biggest drop since June) reduced inflation concerns and eased pressure on equities.
Sector performance: Gains were broad-based; cyclical sectors and construction materials led, while tech (NASDAQ +0.48%, Mag 7 +0.37%) outperformed. Equal-weighted S&P also rose (+0.32%), confirming breadth.
Safe haven demand: Gold’s rally highlights investor caution despite equity gains—suggesting hedging activity alongside risk-on moves.
S&P 500 Trading Takeaway
Equities remain resilient, closing near record highs with support from falling yields and softer oil prices. However, government shutdown risks and political uncertainty could cap upside near term. Expect headline-driven volatility with cyclical and tech sectors best positioned to extend gains if yields stay contained.
Key Support and Resistance Levels
Resistance Level 1: 6686
Resistance Level 2: 6710
Resistance Level 3: 6750
Support Level 1: 6600
Support Level 2: 6580
Support Level 3: 6556
This communication is for informational purposes only and should not be viewed as any form of recommendation as to a particular course of action or as investment advice. It is not intended as an offer or solicitation for the purchase or sale of any financial instrument or as an official confirmation of any transaction. Opinions, estimates and assumptions expressed herein are made as of the date of this communication and are subject to change without notice. This communication has been prepared based upon information, including market prices, data and other information, believed to be reliable; however, Trade Nation does not warrant its completeness or accuracy. All market prices and market data contained in or attached to this communication are indicative and subject to change without notice.
SPX500 LongElite Analysis
Price came to structured liquidity
Transitional switch confirmed in 1m, 3m, 5m
Targeting structured liquidity above

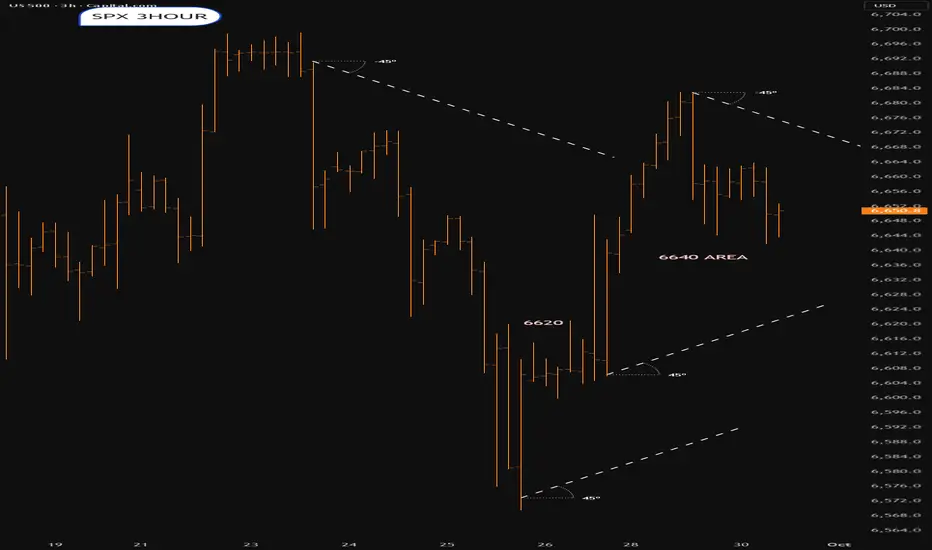
SPX into Quarter endDifficullt.Direction unclear.Some sort of festering around 6620-6640 area.Lets see
SPX500 – Bearish Below 6,662 as Shutdown Risks Cloud Fed OutlookSPX500 – Overview
SPX500 is trading cautiously as Wall Street weighs the risk of a potential U.S. government shutdown and the Fed’s next policy steps.
The lack of clarity over upcoming economic data—especially if NFP is delayed—adds to volatility and makes short-term moves highly data- and headline-driven.
Technical Outlook
The index has stabilized below the 6,662 pivot, which supports ongoing bearish momentum.
→ As long as price stays under 6,662, downside targets are 6,635 and 6,617, with a further extension toward 6,580 if momentum accelerates.
However, if price stabilizes above 6,673, the bullish trend could resume toward 6,699 and higher.
Pivot: 6,662
Support: 6,635 – 6,617 – 6,580
Resistance: 6,674 – 6,699 – 6,742
