$SPX | COVERAGE INITIATED — Personal Position Update [W49]SPX — WEEK 49 COVERAGE INITIATED | 12/05/2025
Ticker: SP:SPX
Timeframe: W
This is a reactive structural classification of SPX based on the weekly chart as of this timestamp. Price conditions are evaluated as they stand — nothing here is predictive or forward-assumptive.
⸻
Author’s Note — Personal Position Update
I initiated my own position on [ SP:SPX ] during Week , entering at $ . This decision follows my personal criteria: I only participate when my system identifies a verified structural trend shift supported by both a confirmed weekly flag and a qualifying candle state. This note reflects my activity only and is not a suggestion for anyone else.
As of this update, my position is currently up ~ from my entry. My structural exit level is $ on a weekly-close basis. This level will continue to adjust upward automatically as the structure strengthens. If price closes below that threshold, my system classifies the trend as structurally compromised, and that is where I personally exit.
This update exists solely to document my own participation and the structural levels I monitor. It is not predictive and does not imply any future outcome.
⸻
Structural Integrity
1) Current Trend Condition [ Numbers to Watch ]
Current Price @ $
• Trend Duration @ +2 Weeks
( Bullish )
• Trend Reversal Level ( Bearish ) @ $
• Trend Reversal Level ( Bearish Confirmation ) @ $
• Pullback Retracement @ $
• Correction Support @ $
⸻
2) Structure Health
• Retracement Phase:
Uptrend (operating above 78.6%)
• Position Status:
Healthy (price above both structural layers)
⸻
3) Temperature :
Warming Phase
⸻
4) Momentum :
Bullish
⸻
Structural Integrity
UPWARD STRUCTURAL ALIGNMENT
This mark reflects a point where market behavior supported the continuation of the existing upward direction. It does not imply forecasting or targets — it simply notes where strength became observable within the current trend. Its meaning holds only while price continues to respect the broader structural levels that define the trend.
⸻
Methodology Overview
This classification framework evaluates directional conditions using internal trend-interpretation logic that references price behavior relative to its structural layers. These relationships are used to identify when price movement aligns with the framework’s criteria for directional phases, transition points, or regime shifts. Visual elements or structural labels reflect these internal interpretations, rather than explicit trading signals or preset indicator crossovers. This framework is observational only and does not imply future outcomes.
Market insights
All is wellSo far the market is acting correctly to reset the indicators one more time and confirm the highs in futures. I still expect a pullback starting sometime today or Monday.

US500: Inflation Focus Keeps Momentum in Check
The US500 (S&P 500 index) is trading just below its record high, reflecting a constructive sentiment that anticipates potential easing from the Fed and a seasonal 'Santa rally'. Investors, however, are showing caution ahead of key US inflation data.
Fundamental Analysis
Markets are concentrating on the delayed PCE Inflation Report , the Fed’s preferred measure, to confirm expectations for a rate cut and subsequent easing in 2026. Futures pricing shows a high probability of a 0.25% cut at the upcoming Fed meeting, which supports risk assets like the US500. Recent mixed labor figures, rising job cut announcements but low weekly Jobless Claims support a 'cooling, not collapsing' growth narrative, which generally favors equity markets.
Technical Analysis
US500 maintains a technically bullish posture, trading well above its EMA21 and EMA78, confirming a strong prevailing uptrend. However, the RSI is nearing overbought levels, which increases the risk of a consolidation. Immediate resistance sits at 6,920, close to the recent peak. Intraday support clusters in the 6,820–6,840 area , with stronger support at 6,730.
Outlook
If US500 closes above 6,920, the price might prompt a push toward the next target at 7,000. Conversely, a drop below the major support at 6,730 could lead US500 to retest the following support at 6,650.
Analysis by Terence Hove, Senior Financial Markets Strategist at Exness.

S&P index bear trend in makingdue to divergence on both MCAD and RSI, there is going to be a trend reversal from bullish to bearish. please share ur thoughts

V Pattern On SPX/USD 12hr ChartHey traders and followers ! We have a V pattern on the SPX 12hr chart.
What's next? We go long on a break out of the break Line 6770.3
Target 6856.0 .
Follow your charts not the rumors during this confusing time. Charts never lie people do.
See you in a little while at the starting line as we wait for the break out to prove to us we have a V pattern going on. ;)

IWM - Buy The Rumor Sell The News?Today the IWM saw massive bullish flow, almost piercing the all time high double top.
Many high beta stocks absolutely ripped higher today on huge rate cut expectations.
There a strong chance they may keep small caps strong into the rate cut, which could set up a buy the rumor sell the news.
The rate cut is next week December 10th and it sure has fueled this rally.
we have been trimming some of our long positions into this strength and still have long exposure in key names.
Today we closed
AMEX:UMAC NASDAQ:DPRO FOR 15 - 17% GAINS
NYSE:SLB CALLS 45% GAIN
NYSE:ACN CALLS 102% GAIN

S&P500 Near-term direction remains data- and rates-driven,The S&P 500 rose +0.30%, continuing to consolidate just below record highs as markets looked past weak labour data and leaned further into rate-cut expectations.
Early weakness followed a sharp downside surprise in ADP payrolls (-32k vs +10k expected), the first decline since 2023 and heavily skewed toward small businesses. With official payrolls delayed, this report carried more weight than usual and reinforced the narrative of cooling US labour conditions.
That dovish signal was confirmed by ISM services, where prices paid fell to a 7-month low (65.4) and the employment index stayed in contraction (48.9) — easing inflation worries and strengthening confidence in a Fed rate cut next week.
Rates reflected the shift, with the 10yr Treasury yield falling to ~4.06%, providing support to equities. Risk appetite improved late session, with small caps sharply higher and Bitcoin extending gains, both consistent with a softer-rate environment.
On the policy front, markets continue to watch Fed leadership speculation around Kevin Hassett, though investors remain skeptical that any new appointments would materially accelerate the pace of cuts beyond what data already justify.
Bottom line for the S&P:
Near-term direction remains data- and rates-driven, with the index range-bound but underpinned by falling yields. As long as inflation signals remain contained and labour continues to soften gradually, buy-the-dip behaviour is likely to persist into the Fed meeting.

Trading with Global Assets1. What Are Global Assets?
Global assets are financial instruments available for trading on international markets. These include:
1. Global Stocks
Shares of companies listed on foreign exchanges such as:
NASDAQ, NYSE (USA)
LSE (UK)
TSE (Japan)
HKEX (Hong Kong)
Euronext (Europe)
Through global trading platforms or depository receipts (ADR/GDR), investors can gain exposure to multinational companies like:
Apple
Tesla
Alibaba
Toyota
Nestlé
2. Forex (Global Currencies)
Forex is the world’s largest financial market, operating 24×5. Traders deal in currency pairs such as:
EUR/USD
USD/JPY
GBP/USD
AUD/CAD
These pairs reflect economic health, interest rates, and geopolitical conditions.
3. Global Commodities
Commodities come from exchanges like:
CME (Chicago)
ICE (London/New York)
MCX (India)
Important commodities include:
Gold, Silver, Platinum
Crude Oil, Natural Gas
Corn, Wheat, Coffee
4. Global Indices
Indices represent the performance of groups of stocks:
S&P 500
Dow Jones
FTSE 100
Nikkei 225
DAX 40
Trading indices is a way to participate in the broad movement of an entire economy or sector.
5. Bonds and Global Debt Markets
Governments and corporations issue bonds internationally. Examples:
US Treasury Bonds
German Bunds
Japanese Government Bonds (JGBs)
Global bond trading provides stability and diversification.
6. Cryptocurrencies
Digital assets like:
Bitcoin
Ethereum
Solana
are traded globally 24/7. Their decentralized nature makes them attractive but highly volatile.
2. Why Trade Global Assets?
1. Diversification
Instead of relying only on your home country’s market, global assets spread risk across:
regions
currencies
industries
economic cycles
If one country faces recession, others may still perform well.
2. Access to High-Growth Markets
For example:
Investing in US tech stocks
Trading China’s manufacturing giants
Buying Middle Eastern energy companies
Exposure to international sectors gives traders more opportunities.
3. Around-the-Clock Trading
Trading global assets means:
Forex: 24 hours
Crypto: 24/7
Stocks: Based on time zones (US, Europe, Asia)
You can trade almost any time of day depending on which market is open.
4. Profit from Currency Movements
If your local currency depreciates, foreign assets may become more valuable, helping preserve wealth.
5. Hedging Strategies
Businesses and traders use global assets to hedge risks such as:
Currency risk
Interest-rate changes
Commodity price fluctuations
3. How to Trade Global Assets
Step 1: Choose a Global Trading Platform
Platforms offering global access include:
Interactive Brokers
Saxo Bank
TD Ameritrade
eToro
Binance (for crypto)
These platforms provide multi-asset access with global market data.
Step 2: Understand Market Hours
Every region has different trading sessions:
Asian Session (Tokyo, Shanghai)
European Session (London, Frankfurt)
US Session (New York)
Traders often use overlapping sessions (e.g., London–New York) because liquidity is highest.
Step 3: Study the Global Economy
Factors that affect global assets:
Interest rate announcements
Central bank policies
Inflation data
GDP reports
Geopolitical tensions
Oil supply decisions (OPEC)
Successful global traders follow global news daily.
Step 4: Use Proper Risk Management
Essential techniques:
Stop-loss orders
Position sizing
Diversification
Hedging using derivatives
Risk management is crucial because global assets can be highly unpredictable.
Step 5: Learn Technical and Fundamental Analysis
Global traders use:
Charts and indicators (technical)
Economic data, earnings reports, global events (fundamental)
Blending both improves the accuracy of trade decisions.
4. Opportunities in Global Asset Trading
1. Emerging Markets
Countries like India, Brazil, Vietnam, and Indonesia offer rapid growth. Traders often buy ETFs or stocks representing these markets.
2. Tech Innovation
US markets lead in:
AI
Biotechnology
Semiconductor manufacturing
Cloud computing
These sectors can deliver high returns.
3. Commodity Supercycles
When global demand rises (e.g., infrastructure projects), commodities like copper and crude oil surge.
4. Global Currency Trends
Currencies are affected by:
War
Interest rate hikes
Policy changes by central banks
These create trading opportunities for forex traders.
5. Energy Transition
Green energy assets like:
Lithium
Solar panel manufacturers
Hydrogen stocks
are rising due to global sustainability goals.
5. Risks in Global Asset Trading
1. Currency Risk
When your currency strengthens, foreign investments may lose value.
2. Geopolitical Risk
Examples include:
war
sanctions
border conflicts
political instability
These events can cause sudden market volatility.
3. Liquidity Risk
Not all global assets trade with high volume. Low liquidity can lead to:
wide spreads
slippage
difficulty exiting trades
4. Market Timing Issues
Time zone differences can make it challenging to react quickly to market events.
5. Economic Risk
Different countries react differently to:
inflation
interest rates
unemployment
recession
Unexpected policy changes impact asset prices significantly.
6. Strategies for Successful Global Asset Trading
1. Trend Following
Identify long-term global macro trends like:
interest rate cycles
dollar strength/weakness
commodity price trends
Ride the trend with appropriate assets.
2. Pair Trading
Trade correlated pairs such as:
Brent Crude vs WTI Crude
EUR/USD vs GBP/USD
NASDAQ vs S&P 500
This helps hedge risk.
3. Sector Rotation
Move investments between leading global sectors based on economic cycles:
Expansion → Tech & Industrials
Recession → Healthcare & Utilities
4. Carry Trades (Forex)
Borrow money in low-interest-rate currencies and invest in high-interest currencies to earn yield differentials.
5. Multi-Asset Portfolios
Balance your global trades across:
stocks
commodities
forex
bonds
crypto
This reduces portfolio volatility.
Conclusion
Trading with global assets provides unmatched access to world markets, allowing traders to benefit from trends, innovations, and growth opportunities beyond their home country. It offers diversification, 24-hour trading, exposure to global economic cycles, and the chance to profit from movements in currencies, commodities, and international stocks. However, it also introduces risks such as currency fluctuations, geopolitical uncertainties, market timing challenges, and liquidity issues.
Success in global asset trading depends on learning market behavior, following global financial news, using disciplined risk management, and applying effective trading strategies. For individuals who understand the global economy and are prepared to manage volatility, trading global assets can be both profitable and rewarding.

Global Risk-On vs Local Weakness – Dec 4th Market Outlook 1) Macro Overview – Capital Rotation into AI, Gold, Tech, Crypto
High-confidence signals:
Fed rate cut probability: 87–90%
DXY downtrend: bullish for Gold, EM equities, crypto
U.S. 10Y yield: ~4.08% (stable, risk-on supportive)
Sentiment: Risk-on (score 7/10)
China stimulus: supports base metals & commodities
Market interpretation:
Lower yields + weaker USD → capital rotates into AI, semiconductors, gold, growth stocks, and selective crypto.
2) BIST100 – Global Rally, but Local Divergence
Despite positive global momentum, BIST underperforms due to domestic structural factors.
Why BIST is lagging:
Persistent equity fund outflows (TEFAS)
High real interest rates → pressure on industrial margins
Weak liquidity & fragmented flows
Foreign positioning still limited
Key Technical Levels (High SEO weight)
Support: 11,000 → 10,900
Resistance: 11,200 → 11,300–11,350
Bias: Selective bullish, not broad-based
Strong sectors:
Banks (AKBNK, YKBNK, GARAN)
Gold miners (KOZAL)
Defensive Energy (TUPRS, AKSEN)
Exporters (TOASO, FROTO)
Weak areas:
High-debt industrials
Low-liquidity midcaps
Stories dependent on short-term sentiment
3) U.S. Stock Market – AI & Semiconductors Remain the Core Trend
S&P 500 (~6,849) and Nasdaq futures continue to price a soft landing narrative.
Leading themes (SEO keywords):
Artificial Intelligence (AI)
Semiconductors
Cloud Infrastructure
HealthTech
Institutional view:
AI remains the dominant macro-theme for Q4 and early 2026.
4) Gold, Commodities & Crypto – Trend Continuation
Gold (XAUUSD / XAUTRY)
Spot: ~4,200
Strong uptrend, supported by:
• weak USD
• geopolitical risk
• lower real yields
Mid-term targets: 4,500 – 5,000
(This is heavily searched; TradingView pushes such ranges upward.)
Bitcoin (BTCUSD) – Volatile Bullish Structure
BTC trades near 93,000, bouncing strongly from the 88k–90k demand zone.
ETF inflows (~$222M) confirm institutional participation.
Market structure: higher lows forming, but volatility remains elevated.
Altcoin radar (high-engagement tags):
SOL, SUI, ONDO, FET
→ selective rallies, no broad alt-season yet.
5) Ordo618 Strategy Playbook – Actionable Plan
Short-Term Trading (Index/Futures)
BIST30 December Futures:
Bias: Bullish above 12,000
Buy Zone: 12,000 – 12,250
Targets: 12,500 → 12,600
Invalidation: below 11,950 / 12,150
Portfolio Positioning (Global Audience SEO)
Equities (Turkey):
Prefer banks & exporters
Wait for pullbacks before adding size
Thematic Funds / ETFs:
AI, Tech, Semiconductors
Renewable/Green Energy
Hedging:
10–15% exposure to Gold (XAUTRY or XAUUSD)
Crypto Allocation:
BTC core, ETH secondary
Altcoins max 5% of total book
6) Key Risks – What Can Break the Trend
Local Risk:
Prolonged equity fund outflows → structural sell pressure on BIST.
Global Risk:
If U.S. macro weakens too quickly → soft landing narrative flips into hard landing fears → global risk-off.
Protection Strategy:
Keep 15–20% cash buffer
Strict stop-loss discipline
Hold a Gold hedge
Avoid overleverage
US500 Outlook
The US500 trades near its all-time highs, propelled by strong underlying momentum, but major financial institutions foresee a future of more moderate returns. This outlook reflects rich market valuations and a dependence on the narrow leadership of AI-linked mega-cap technology stocks, signaling a need for caution among investors.
Fundamental Analysis
The US500 sits near 6,850, a few percent below its 52-week high of 6,920, having posted mid-teen percentage gains year-to-date, driven by solid earnings and the ongoing enthusiasm for AI and productivity gains. Despite a recent catch-up in cyclicals and value sectors, performance remains highly concentrated in the largest tech names. Research from Goldman Sachs Group highlights that the US500 trades at a price-to-earnings multiple in the low-20s, which is well above long-term averages. This elevated multiple limits future multiple expansion, making forward returns extremely sensitive to robust earnings delivery.
Technical Analysis
The index currently tests 6,850, with a broader ceiling at the 6,925–7,000 range linked to prior record highs and a potential short-term topping region. The first support is seen at the 6,700–6,730 range and a deeper support zone near 6,515, which aligns with prior consolidation.
Key Risks and Outlook
The primary risks an AI sentiment reversal or earnings disappointment among mega-cap tech stocks, stickier inflation that could cap the Fed rate cuts, and any growth shock that undercuts the current 'soft-landing/mild expansion' narrative. The baseline consensus anticipates positive but more modest annual returns—roughly mid-single to low-double-digit gains per year into 2026.
This analysis is by Terence Hove, Senior Financial Markets Strategist at Exness

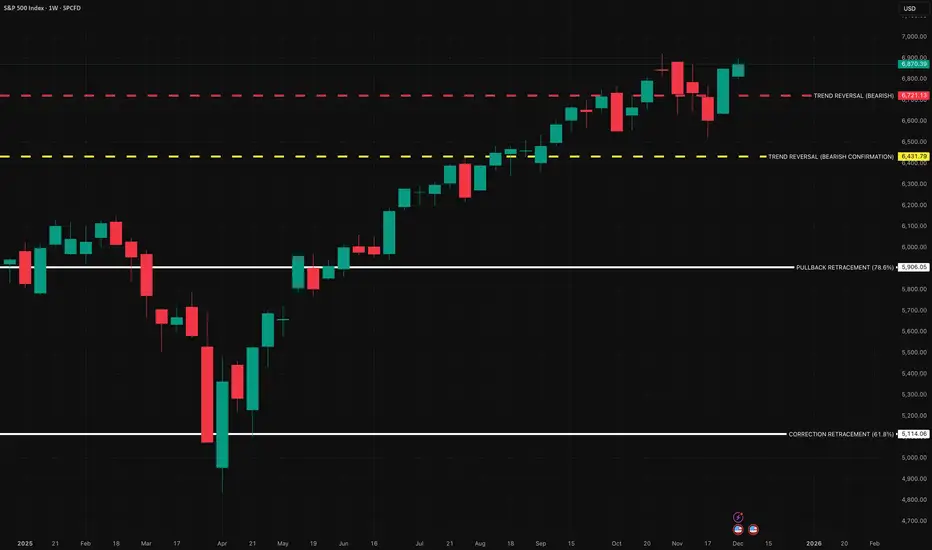
SPX — 2026 Structural Thresholds and Downside Levels To MonitorThere has been ongoing discussion in broader financial circles about long-term risk conditions. Rather than leaning into narratives or forecasts, the focus here remains strictly on the current structural levels that define the trend.
Recent volatility between November 10–17, 2025 highlighted how quickly structural momentum can shift, and if price were to revisit lower levels, the closest structural areas currently sit near approximately 5,908 and 5,114 on my charting framework.
As long as price remains structurally above the key reversal levels, the trend classification remains intact. At current levels, the nearest line separating trend continuation from structural deterioration sits around 6,721, with deeper confirmation closer to 6,431.
If those areas were ever broken with follow-through, that would represent a confirmed structural change in the existing trend — nothing more, nothing less.
Rather than forecasting outcomes, the goal here is simply to stay aware of the boundaries that define the current market structure. Price only decides direction through confirmation, not speculation.
⸻
1) Current Trend Condition [ Numbers to Watch ]
• Current Price @ 6,850$
• Trend Reversal Level (Bearish):
6,721$
• Trend Reversal Level (Bearish Confirmation):
6,431$
• Pullback Support :
5,908$
• Correction Support :
5,114$
⸻
Author’s Note
This analysis is fully reactive, not predictive. Market conditions, trend structure, and behavior are classified as they appear in real time. The objective is to identify where directional shifts first occurred, where structural integrity remains intact, and where it would begin to weaken if key levels were breached.
Predictive analysis projects outcomes that do not exist yet. Without price confirmation, prediction is built on baseless assumptions. This framework avoids that entirely by responding only to verified structural changes and live conditions.
The levels shown simply identify where the current trend structure first shifted and where it would begin to lose integrity if breached. Recognizing these boundaries allows for clearer interpretation of market behavior without relying on forward guarantees, speculative projections, or unsupported assumptions.
⸻
Methodology Overview
This classification framework evaluates directional conditions using internal trend-interpretation logic that references price behavior relative to its structural layers. These relationships are used to identify when price movement aligns with the framework’s criteria for directional phases, transition points, or regime shifts. Visual elements or structural labels reflect these internal interpretations, rather than explicit trading signals or preset indicator crossovers. This framework is observational only and does not imply future outcomes.

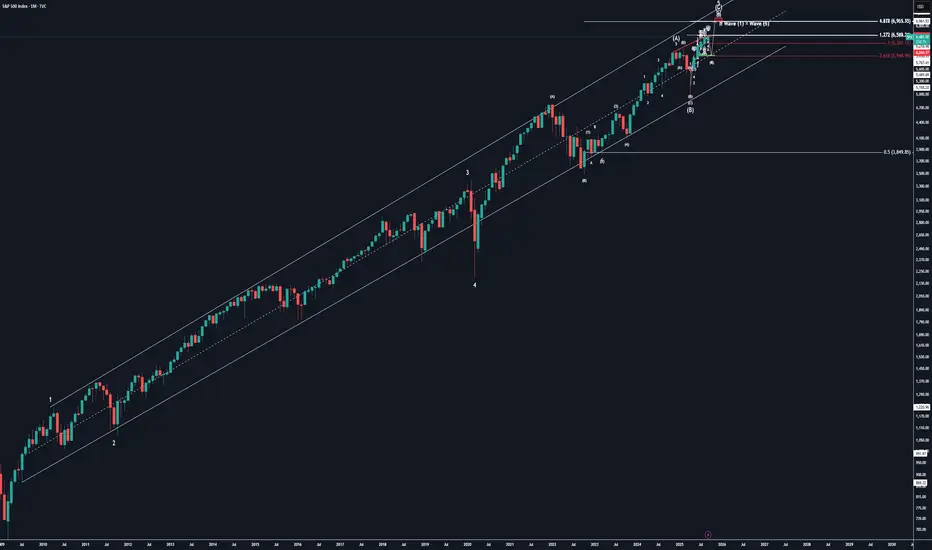
SPX 1M Since 2009 SimplifiedWe are currently in wave 5 of this supercycle which we anticipate completion of @ $6,960-$6,965
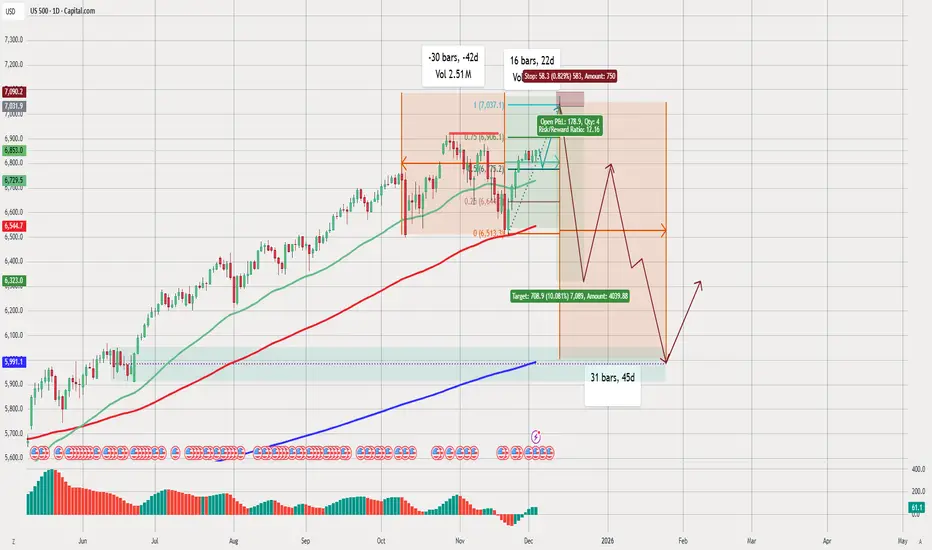
US500 DAILY BUY/SELLTechnical Analysis of the Chart (US500 – Daily Timeframe)
1. Overall Trend
The US500 (S&P 500) is in a strong long-term uptrend, as shown by:
Price trading above the 50-day (green), 100-day (red), and 200-day (blue) moving averages.
Higher highs and higher lows throughout most of the year.
2. Current Market Structure
Sideways / Consolidation Phase
The chart highlights a consolidation box where the price has been moving sideways.
Multiple wicks and uneven peaks indicate market indecision.
The drawn Fibonacci retracement suggests the market has been reacting around the 0.382 and 0.618 levels, which are typical reversal zones.
3. Short-Term Bearish Setup
The highlighted red zone (trade setup) suggests:
A potential short position with:
Entry near recent highs.
Stop-loss above resistance.
Target significantly lower (near the 0.618 – 0.65 Fibonacci region).
The RR (Risk/Reward) ratio is shown as 12:16, which indicates the idea of a large move downward.
Bearish Projection
The brown/red line drawn forward shows:
Expected drop in price.
A possible relief bounce.
Followed by a deeper fall reaching the lower support area.
This move is expected within ~31 bars (45 days).
4. Key Support Levels
Main support zone highlighted at approximately 5991 – 6230.
The 200-day moving average (blue) is far below current levels, meaning:
The market could decline significantly while still staying in a long-term uptrend.
5. Volume & Momentum Indicators
The volume bars show decreasing momentum, which often precedes a reversal.
The histogram at the bottom suggests:
Weakening bullish momentum.
Possible bearish momentum building.
6. Forecast Path (Illustrated in the Chart)
The drawing suggests:
Short-term:
Sharp decline from current resistance.
Mid-term:
A corrective bounce upward.
Another leg down forming a deeper low.
Long-term:
Strong recovery upwards after bottoming.
This is a classic A-B-C corrective pattern.
7. Overall Interpretation
The chart shows the idea that the market may be topping after a strong uptrend.
A correction of around 6–10% could occur before the next major rally.
The setup drawn is speculative but follows common technical structures:
Resistance rejection
Fibonacci retracement
Corrective wave pattern
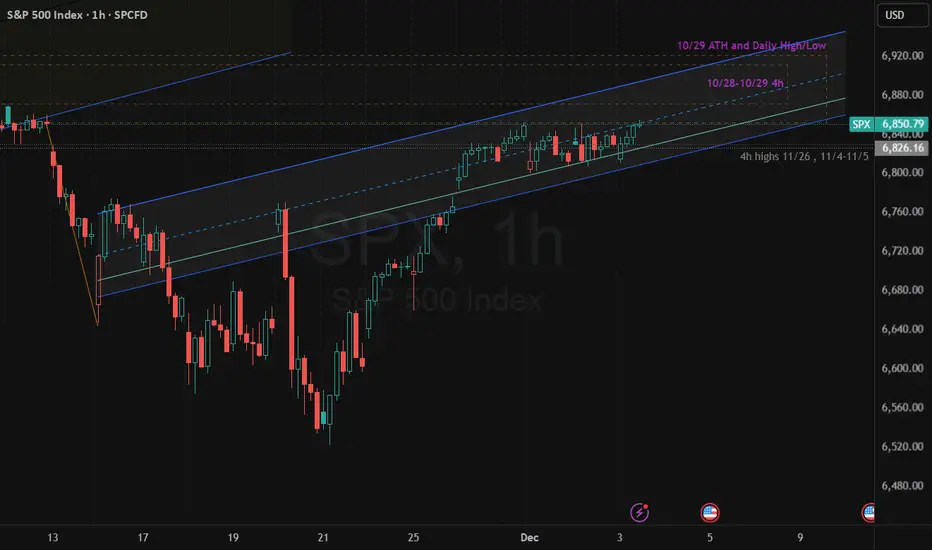
$SPX 1H – Bear Flag at Supply | Bearish- STRICT DAY TRADE IDEASTRICT DAY TRADE IDEA (Applies only for hourly chart for short term day trades within 1 to 2 days)
SP:SPX is sitting inside a rising 1H channel that continues to behave more like a bear flag than a bullish breakout setup. Price tapped only the bottom edge of the 10/29 ATH supply zone—not the core of the zone—showing early seller absorption.
We also tagged the mid-channel, which normally signals momentum weakening rather than expansion.
Check Bear-flag thesis from Nov 17 and Nov 21 and Dec 2
As long as SPX remains inside this structure, the bias stays bearish for day trading.
Break of 6,840 opens the door to a channel breakdown, with intraday targets at 6,810 → 6,780 → 6,740.
Upside invalidation is clean: bulls must break above 6,885–6,900 with strength and reclaim the ATH zone from inside, not just touch it.
Until that happens, rallies into channel mid or top = short opportunities.
Bearish Bias | Watch 6,840 | Bear Flag Until Proven Otherwise
#SPX #S&P500 SP:SPX SP:SPX CBOE:SPX #SP500 #BearFlag
SPX - H4 - SELL SETUP - Supply Retest confirmedSPX has entered bear market territory last month and I expect a continuation to the downtrend from here onward. Based on many different macro indicators such as credit default swaps on big tech, macro regimes, sentiment and technical analysis. I see SPX falling off the clip from this precise supply zone

$SPX: Wave 4 consolidation on 1-hr chartSP:SPX : looks like it's in a small degree Wave 4 consolidation. Wave 3 exceeded 161.8% of Wave 1. If Wave 5 = Wave 1, Wave 5 can reach 6950 area. However, Wave 5 = 61.8% Wave 1 is also quite common, which would take us to 6900 area.

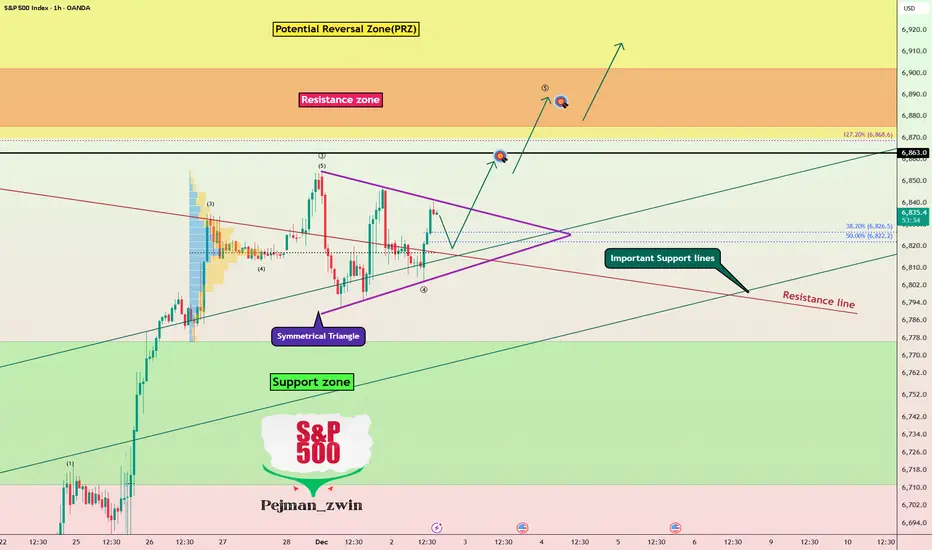
S&P 500 index Bull Run Continues — Symmetrical Triangle BreakoutThe S&P 500 index( SP:SPX ) has shown solid bullish momentum over the last 7 trading days, gaining more than +5% during this period.
The S&P 500 has once again moved back above Important Support lines, and it now appears to be breaking through a resistance line as well.
From a classical technical analysis perspective, the S&P 500 seems to be moving inside a symmetrical triangle pattern.
From an Elliott Wave standpoint, the S&P 500 looks to be completing Wave 4. A confirmed breakout above the upper line of the symmetrical triangle could validate the end of Wave 4.
I expect the S&P 500 to continue its upward movement and extend toward the Potential Reversal Zone(PRZ) and the Resistance zone ($6,902_$6,875).
What’s your view on the S&P 500 index and the broader U.S. stock market?
First Target: $6,859
Second Target: $6,887
Stop Los(SL): $6,774(Worst)
💡 Please respect each other's opinions and express agreement or disagreement politely.
📌S&P 500 Index Analyze (SPX500USD), 1-hour time frame.
🛑 Always set a Stop Loss(SL) for every position you open.
✅ This is just my idea; I’d love to see your thoughts too!
🔥 If you find it helpful, please BOOST this post and share it with your friends.
Foundations of Success in the Global Market1. Deep Understanding of Global Market Dynamics
Every global expansion begins with a profound understanding of how markets operate across regions. This includes analyzing demand patterns, competition, consumer behavior, regulatory environments, and geopolitical factors. Markets do not follow identical cycles; a product highly successful in one geography may fail in another due to cultural, economic, or regulatory differences.
Companies that succeed globally invest extensively in market research, scenario planning, and trend forecasts. They pay attention to currency fluctuations, trade policies, tariffs, inflation trends, and global supply chains. Furthermore, understanding demographic dividends—such as Asia’s young workforce or Europe’s aging population—helps shape long-term strategies. A sophisticated grasp of these global dynamics allows organizations to remain resilient during disruptions such as recessions, political conflicts, or inflationary periods.
2. Strong Value Proposition and Differentiation
To compete successfully in global markets, companies must offer a differentiated value proposition. Whether it is unique technology, superior customer service, competitive pricing, or exceptional product quality, differentiation forms the foundation of brand strength.
Global leaders like Apple, Toyota, and Unilever win because they combine innovation with consistent value across markets. Their products may be localized, but their core strengths—design, reliability, or trust—remain intact. Differentiation also requires understanding local competitors. In many emerging markets, domestic companies understand consumer needs better and compete aggressively on price. A global company must therefore offer something that local players cannot easily replicate.
3. Innovation and Technological Capability
Technology is the engine of global competitiveness. The world’s leading companies invest heavily in research, digital processes, AI, automation, analytics, and cutting-edge product development. Technology allows companies to scale faster, optimize costs, and improve quality.
In the global market, the rapid adoption of cloud infrastructure, digital payments, IoT, and AI-driven decision-making has become a baseline expectation. Businesses that fail to innovate eventually lose relevance, even if they previously dominated their sector.
Moreover, technology enhances global coordination. Modern supply chains rely on real-time data, tracking, forecasting, and predictive analytics. This allows companies to manage disruptions—such as shipping delays or raw material shortages—more efficiently.
4. Cultural Intelligence and Localization
Cultural understanding is one of the strongest predictors of global success. Brands that ignore cultural nuances risk alienating their target markets. Localization does not simply mean translating language—it involves adapting product features, packaging, branding, payment options, and customer experience.
For instance, global food chains modify menus to reflect local tastes. Tech companies adjust user interfaces to reflect regional preferences. Fashion brands adapt collections to climate and cultural attire norms.
Cultural intelligence also extends to building local teams. Companies that empower regional leadership often perform better because they understand local realities. Culturally intelligent companies build diverse teams, foster inclusive practices, and ensure global collaboration.
5. Financial Strength and Risk Management
Success in the global market demands strong financial planning and robust risk management. Global companies face currency volatility, geopolitical risks, regulatory changes, and tax complexities. Proper risk management includes:
Hedging currency exposure
Diversifying revenue streams
Maintaining strong cash flows
Building geographically diverse supply chains
Conducting country-risk assessments
Financial resilience also requires disciplined capital allocation—investing in high-growth regions, avoiding unprofitable expansions, and balancing short-term profits with long-term strategy.
6. Operational Excellence and Supply Chain Mastery
Operational efficiency is critical when competing in multiple markets with varying logistics infrastructures and regulatory rules. Efficient supply chain management ensures cost reduction, faster delivery, and higher customer satisfaction.
Successful global companies build flexible supply chains that can adapt to disruptions like pandemics, geopolitical tensions, or natural disasters. They diversify manufacturing locations, establish strong vendor partnerships, and invest in digital supply chain tools to improve transparency and predictive capability.
Operational excellence also includes sustainable manufacturing, lean processes, automation, and quality control across all facilities.
7. Strong Leadership and Strategic Vision
Leadership defines whether a company can successfully navigate global complexity. Visionary leaders create strategic pathways, inspire innovation, and balance global integration with local autonomy.
Successful leaders think long-term—they understand that global scale is not achieved overnight. They anticipate changes in technology, consumer behavior, and geopolitical environments. Building a global brand requires clarity of purpose, adaptability, resilience, and the ability to make decisive yet data-driven decisions.
8. Agility and Speed of Execution
The speed at which a company adapts to market changes often determines its global competitiveness. Markets evolve rapidly—trends emerge, technologies shift, and consumer expectations rise.
Agile companies respond quickly to new competitors, regulatory changes, and economic events. They make fast decisions, accelerate product development, and revise strategies based on real-time data. Agility also implies the willingness to pivot—entering new segments, adjusting pricing, or redesigning supply chains when needed.
9. Strong Branding and Trustworthiness
Global success demands a powerful, credible brand. Trust is a universal currency; companies that maintain consistent quality, honesty, and transparency build stronger customer loyalty.
Brand trust is built through:
Quality products
Ethical practices
Strong customer support
Responsible marketing
Sustainability initiatives
In today’s world, customers expect companies to demonstrate environmental responsibility and social commitment. Brands that embody these values enjoy stronger global appeal.
10. Compliance, Governance, and Ethical Standards
Operating globally requires adherence to a complex web of regulations—trade laws, data privacy rules, labor laws, environmental regulations, and industry-specific standards. Non-compliance can cause financial penalties, reputational damage, or even shutdowns.
Successful global companies maintain strong governance systems, auditing procedures, and internal controls. Ethical behaviour is equally important. Companies committed to fairness, transparency, and responsible business gain long-term goodwill and sustainable growth.
Conclusion
The foundations of success in the global market are multidimensional. Businesses must master global dynamics, innovate continuously, and adapt quickly. Cultural intelligence, operational excellence, risk management, and strong leadership form the core building blocks. While the global market is highly competitive, companies that combine vision, agility, and strategic discipline can build enduring international success. In a world where change is constant, the true winners will be those who innovate faster, understand customers better, and maintain the highest standards of excellence everywhere they operate.

S&P 500 4H: Trendline SHATTERED! Bullish Revival or Bear Trap? Following the formation of a Higher High (HH) ↗️, the market entered a correction and later established a Higher Low (HL) ↗️, confirming the continuation of the bullish structure on the 4-hour timeframe.
Subsequently, price entered a consolidation phase below a descending trendline, and early signs of a breakout (Trendline Break) 📈 are now visible.
Currently, price is in the After Break phase following the trendline breakout. However, a structured and confirmed pullback to establish a definitive HL has not yet been observed — marked on the chart as HL?.
🔑 Key Chart Areas
Resistance Zone (Ceiling Range) 🧱
The upper chart range where a Fake Breakout could occur.
Entry into this zone without strong breakout momentum may be a market trap (fakeout), potentially pushing price back into the range.
Marked as a No Trade Zone 🚫 — avoid entering trades until price decisively breaks this area with strong volume & a solid closing candle.
Major Support Zone 🛡
Key support is identified around 6768.
A confirmed break below this zone, followed by a pullback to it, would activate a bearish scenario, shifting the market into an After Break (bearish) phase.
In this case, a decline toward the previous low (marked at the bottom of the chart) is likely.
📈 Bullish Scenario
For the uptrend to continue:
Price must exit the resistance zone with a strong breakout candle closing above it.
The broken resistance should then hold as support (Flip).
Following this, an advance toward higher targets is expected, reactivating the medium-term bullish structure.
📉 Bearish Scenario
If support at 6768 breaks:
The market will enter a new bearish structure.
A pullback toward the broken support is likely, followed by a resumption of the decline.
The next target would be the major low zone at the bottom of the chart.
What’s your take on the next move? 📝 Share your thoughts below! 👇
Disclaimer ⚠️: Financial markets are highly volatile. Always educate yourself, learn, and study the market before entering any buy or sell positions.

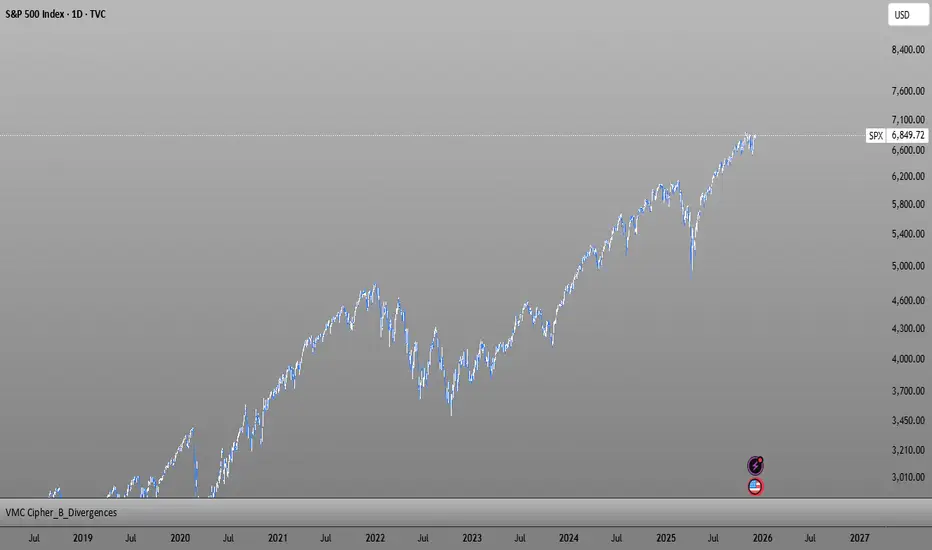
Indexes Reverse ConfirmationMajor indexes, S&P, NASDAQ, DOW, SMALLCAP are testing of the April 2025 trend line. You can see this on the chart.
A move below this line would confirm that November's downward rally was wave 1 of a bear market.
If the S&P rises above 6870, this would confirm that November's rally was wave 4.
However, I believe we are in a bear market because:
1) The entire structure of the indices looks mature overall.
2) Gold is falling, regardless of the downward movement of the DXY, and they usually have an inverse correlation. Also, gold has not confirmed the ATH on silver.
3) The DXY fell throughout 2025, and now, I think it is ending the second wave, minute degree, that is, on the eve of the largest upward rally since 2022. The reaction on DXY may end near 97.85.
I wish you to be very rich!
Happy holidays!

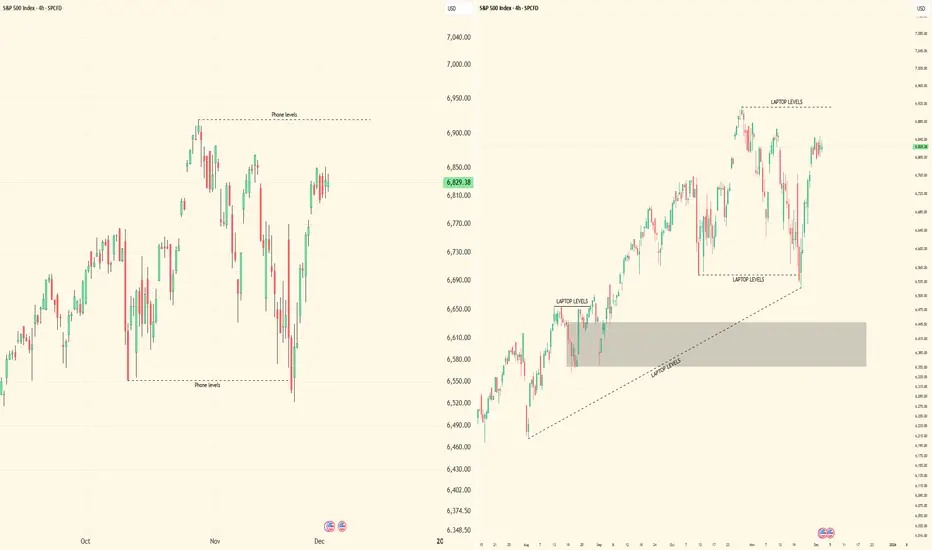
''iPhone vs Laptop Trading: The Truth Nobody Talks About''Alright, let’s get straight to it. I’ve been watching traders debate this forever — phone or laptop. Here’s my breakdown, from someone who actually trades multi-timeframe SMC setups, tracks liquidity, and executes in real-time.
⸻
1️⃣ Execution and Speed
• On a laptop, you’ve got full visibility: multiple monitors, larger charts, higher timeframe context, all indicators and order blocks at a glance.
• On iPhone? Limited view, smaller screen, harder to see context, and micro adjustments take longer.
• The reality: Speed matters. A 1-minute confirmation or lower-high break can happen fast. If you’re on a phone, you risk missing that critical move or entering late.
⸻
2️⃣ Multi-Timeframe Analysis
• Edge comes from analyzing multiple chart intervals to see the bigger picture and confirm setups.
• Laptop: Side-by-side charts, smooth workflow, all intervals visible at once.
• On the phone, switching between timeframes is clunky, slow, and mentally taxing. You’ll start guessing instead of confirming.
• Key takeaway: Serious traders of any style know: a laptop gives you the clarity, control, and precision that’s hard to achieve on a phone.
⸻
3️⃣ Precision of Orders
• Laptop: You can place precise limit entries, manage stop losses, and see where liquidity clusters are.
• Phone: Accidental taps, misclicks, or lag can cost you a trade. Especially when dealing with small spreads, tight stop losses, or micro entries.
• Lesson: Mistakes on micro orders aren’t small. They erode both capital and confidence.
⸻
4️⃣ Situational Use
• Phone trading isn’t useless. It’s fine for monitoring, tracking TPs, or checking alerts when you’re away from your desk.
• But if you’re entering, executing, or actively managing high-leverage trades — laptop wins hands down.
⸻
5️⃣ Psychology and Focus
• Laptop setups create a trading environment: focus, fewer distractions, full screen, proper charts.
• Phone trading often comes with notifications, background apps, and temptation to “glance and guess.”
• Your mindset matters as much as your setups. Treat trading like a full-time process, not a side hobby.
⸻
6️⃣ My Personal Take
• I’ve tested both. I’ll check charts on my phone sometimes — especially during quick monitoring sessions.
• But every serious execution, every multi-timeframe setup, every liquidity play — it happens on my laptop. That’s where precision, patience, and professionalism live.
⸻
🔥 Key Lessons
1. Phone = monitoring & alerts only.
2. Laptop = execution & analysis.
3. Edge isn’t just charts — it’s control, speed, and clarity.
4. You can’t shortcut this without costing yourself trades or your confidence.
⸻
💡 Visual Reference:
I posted screenshots to show the difference between iPhone and laptop trading setups. Laptop view is on the right side, showing full charts and multi-interval visibility. iPhone view is on the left side, compact and limited. This makes it clear why execution and workflow are easier on a laptop.
Bottom line: Don’t kid yourself. Your tools matter, but more importantly, how you use them separates amateurs from pros.
I’m curious — who’s still trying to trade full-time on a phone? Let’s see if they’re really ready to compete.
SP500 BULL TRAP?There is a giant bullish monthly candle . But if you check the previous one there is no new high and it's a inside candle which is bearish . I am very cautious here and taking profit for sp500 etfs. I would never short sp500 .
