SPX: Investors bet on December's cutDuring Thanksgiving week, markets were in a positive, holiday mood, bringing US equities to higher grounds. The S&P 500 had a five-day positive streak, moving from 6.530 up to 6.850 points on Friday. The mood among investors has shifted again back toward a more risk-on stance, as the market is now about 80% confident that the Fed will cut interest rates at December FOMC meeting. Many stocks included in the index are now trading at new all time highest levels, some of which are General Motors, Hilton Worldwide, Walmart stores.
Tech companies also gained during the previous week, as confidence in AI was restored supported by some promising macro developments. Meta was one of the biggest winners, surging around 9% for the week. Microsoft was traded higher by more than 4%, however, Nvidia continues to lag in gains. Company shares continued to decline, losing around 2% on a weekly basis and highlighting uneven sentiment among the tech sector.
The week ahead brings PCE data for September. This indicator is the Fed's favourite inflation gauge, in which sense, Friday might bring some higher volatility. Nervousness will be increased, considering that these data will be taken into account by FOMC members when voting for a rate cut. On the opposite side, starting with the week ahead, we are entering into the last trading month of the year, when investors are seeking positive sentiment to book yearly profits.
Market insights

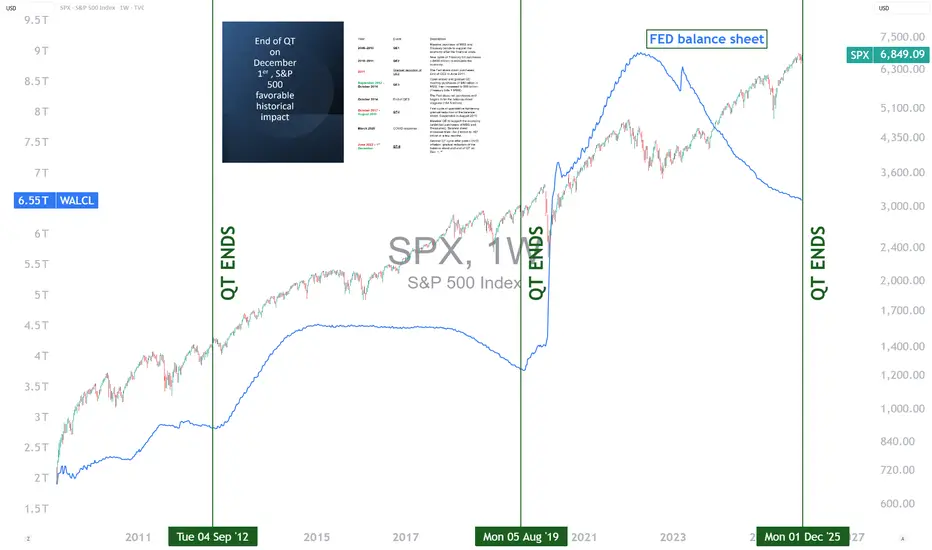
End of the Fed’s QT: What Impact on the S&P 500?The U.S. Federal Reserve (Fed) is expected to end its quantitative tightening (QT) program on December 1, 2025. This step marks the halt of the reduction of its balance sheet, after several years devoted to withdrawing liquidity from the financial system to fight post-COVID inflation. Historically, the end of a QT cycle has often coincided with an improvement in the S&P 500’s trend. However, while this development is generally a positive signal, it deserves a nuanced analysis in a context where the index is already trading at historically high valuation levels.
1) A look at history: a frequently favorable turning point
In previous episodes, notably in 2012 and 2019, the end of QT coincided with a stabilization, then a gradual acceleration of equity markets. The economic logic is intuitive: when the Fed stops reducing liquidity, pressure on financial conditions eases. Investors then anticipate a more predictable monetary environment, sometimes heralding a loosening cycle. This improvement in sentiment has often supported U.S. indices in the following months.
This is not a mechanical link, but an observed trend: the end of QT acts as a relief, removing a monetary tightening factor that weighed on valuation multiples.
2) Why remain cautious despite this signal?
The current context differs in several ways. First, by the end of 2025, the S&P 500 is showing valuation levels close to its records, driven by a handful of large technology stocks. This concentration means that part of the potential future upside is already priced in. Second, even if the Fed ends QT, this does not guarantee a rapid rate cut or a swift return to a highly accommodative monetary policy. The central bank may prefer to maintain a restrictive stance as long as inflation does not durably converge toward its target.
Finally, investors will have to deal with persistent uncertainties: slowing global growth, pressured margins in certain sectors, and geopolitical tensions that may create volatility.
3) Why keep an optimistic bias?
Despite these precautions, several factors justify measured optimism. Ending QT removes a significant headwind for equities. If inflation continues to normalize, the Fed will have greater flexibility, which could improve economic prospects and support corporate profits. In short, the end of QT is not a guarantee, but it represents a positive catalyst in a context where the risk of excessive market valuation is present.
DISCLAIMER:
This content is intended for individuals who are familiar with financial markets and instruments and is for information purposes only. The presented idea (including market commentary, market data and observations) is not a work product of any research department of Swissquote or its affiliates. This material is intended to highlight market action and does not constitute investment, legal or tax advice. If you are a retail investor or lack experience in trading complex financial products, it is advisable to seek professional advice from licensed advisor before making any financial decisions.
This content is not intended to manipulate the market or encourage any specific financial behavior.
Swissquote makes no representation or warranty as to the quality, completeness, accuracy, comprehensiveness or non-infringement of such content. The views expressed are those of the consultant and are provided for educational purposes only. Any information provided relating to a product or market should not be construed as recommending an investment strategy or transaction. Past performance is not a guarantee of future results.
Swissquote and its employees and representatives shall in no event be held liable for any damages or losses arising directly or indirectly from decisions made on the basis of this content.
The use of any third-party brands or trademarks is for information only and does not imply endorsement by Swissquote, or that the trademark owner has authorised Swissquote to promote its products or services.
Swissquote is the marketing brand for the activities of Swissquote Bank Ltd (Switzerland) regulated by FINMA, Swissquote Capital Markets Limited regulated by CySEC (Cyprus), Swissquote Bank Europe SA (Luxembourg) regulated by the CSSF, Swissquote Ltd (UK) regulated by the FCA, Swissquote Financial Services (Malta) Ltd regulated by the Malta Financial Services Authority, Swissquote MEA Ltd. (UAE) regulated by the Dubai Financial Services Authority, Swissquote Pte Ltd (Singapore) regulated by the Monetary Authority of Singapore, Swissquote Asia Limited (Hong Kong) licensed by the Hong Kong Securities and Futures Commission (SFC) and Swissquote South Africa (Pty) Ltd supervised by the FSCA.
Products and services of Swissquote are only intended for those permitted to receive them under local law.
All investments carry a degree of risk. The risk of loss in trading or holding financial instruments can be substantial. The value of financial instruments, including but not limited to stocks, bonds, cryptocurrencies, and other assets, can fluctuate both upwards and downwards. There is a significant risk of financial loss when buying, selling, holding, staking, or investing in these instruments. SQBE makes no recommendations regarding any specific investment, transaction, or the use of any particular investment strategy.
CFDs are complex instruments and come with a high risk of losing money rapidly due to leverage. The vast majority of retail client accounts suffer capital losses when trading in CFDs. You should consider whether you understand how CFDs work and whether you can afford to take the high risk of losing your money.
Digital Assets are unregulated in most countries and consumer protection rules may not apply. As highly volatile speculative investments, Digital Assets are not suitable for investors without a high-risk tolerance. Make sure you understand each Digital Asset before you trade.
Cryptocurrencies are not considered legal tender in some jurisdictions and are subject to regulatory uncertainties.
The use of Internet-based systems can involve high risks, including, but not limited to, fraud, cyber-attacks, network and communication failures, as well as identity theft and phishing attacks related to crypto-assets.
S&P 500 Technical & Fundamental Outlook — Week of De 1–5 2025Technical Analysis Summary – SPX Compression Structure
SPX is currently trading inside a contracting price formation, defined by a descending resistance trendline from recent highs and a rising support trendline from the early Q4 low. This structure represents a period of market indecision and volatility compression, where buyers and sellers are positioning before a larger directional move.
Key Observations
The upper trendline marks repeated rejection points — this is a clear overhead supply zone.
The lower trendline shows higher lows forming — underlying demand is still present.
Price is compressing toward an apex, and historically, these structures lead to strong expansion once resolved.
Because of this setup, entries inside the wedge are high-risk and low-reward, as price tends to chop and trap both sides until a breakout or breakdown is confirmed.
Bullish Scenario
A bullish continuation requires:
A clean breakout above the descending trendline
A successful pullback that holds as support (higher low)
Continuation momentum
This would indicate that buyers have absorbed supply and are in control. Upside levels then open toward the previous reaction highs, and momentum buyers may accelerate the move.
Bearish Scenario
A bearish continuation is confirmed by:
A breakdown below the rising trendline
A failed retest of that area from below (lower high)
Increase in downside momentum or volume
This would signal that buyers have lost control of the trend, and trapped long positions above could fuel a deeper correction toward prior support levels.
Conclusion
The SPX is coiling inside a clear compression pattern.
The proper approach is to wait for the market to choose direction, then position after confirmation, not before.
This is a breakout-or-breakdown environment — not a place to trade the middle.The Market Is Rallying — BUT The AI Trade Is Fragile
Stocks rebounded hard this past week after the biggest pullback since April, mainly because:
Markets believe the Fed will cut in December (rate-cut odds jumped to 80%+).
BUT:
Mega-cap AI names remain volatile.
AI profitability narrative is being challenged.
This is the key line in the sand for SPX right now:
AI spending is massive, but profits are not yet confirmed.
That’s the reason NVDA + GOOGL are whipping around so violently.
⚠️ 2. The Narrative Shift You Must Watch
The market is shifting from "AI growth" → "AI returns".
Matthew Maley (Miller Tabak):
“The narrative surrounding the profitability of AI is coming under question.”
Translation for traders:
No longer enough to say “AI spending”.
Now the market wants proof of revenue + margins.
If that narrative worsens → SPX pressure.
This week was a warning shot:
Alphabet mooning on Gemini 3 news → “AI winner” narrative
Meta possibly buying Google chips → hurts NVDA
Semis shook → volatility in the core leadership names
If NVDA becomes an AI CAPEX victim instead of the bottleneck supplier → the entire AI bull leg changes.
📉 3. Bitcoin’s Slide = Waning Risk Appetite
Bitcoin fell from $125k → under $90k.
King Lip (BakerAvenue):
“Bitcoin serves as a risk proxy for equities.”
This matters because:
SPX often peaks when BTC momentum dies.
Risk is shifting from growth/AI → defensives/small caps.
Crypto weakness = risk appetite fading.
📈 4. SPX Context — This Is NOT a Crash, It’s a “Narrative Test”
SPX is +16% YTD heading into a historically strong window.
December is the 3rd-best month since 1950 (avg +1.43%)
Market is still at the ceiling:
SPX is only ~1% below its October ATH
Nasdaq is ~3% off its high
This is not bearish selling.
This is positioning + narrative testing.
🧠 5. What Is Hurting Tech Right Now
Two forces:
A. Timing of monetization
Companies spent hundreds of billions on training + infra.
But when do earnings arrive?
Nobody knows.
Paul Nolte:
“Investors are rethinking how quickly this will hit bottom lines.”
This is the heart of the SPX risk.
B. Tech Debt Issuances
Big AI names issued heavy debt to fund expansion.
This scares valuation models.
When the “future promises” trade meets balance sheet reality → rotations begin.
💵 6. Fed Cuts: The Bullish Counterweight
Traders now price:
80%+ odds of a December rate cut
This is huge because:
Cuts expand breadth in the SPX
Small caps, cyclicals, value names get oxygen
This is the exact reason SMID outperformed this week.
Anthony Saglimbene:
“What I’m watching is if rate cuts bring momentum outside of tech.”
This is literally the rotation we’ve been waiting for.
🏭 7. Macro Ahead — SPX Sensitivity
Next week will hit:
Manufacturing ISM
Services ISM
Consumer sentiment
CRM, DLTR, KR earnings (consumer health)
Holiday retail performance (Black Friday / Cyber Monday)
👉 But note: many core economic releases were delayed or cancelled due to the 43-day government shutdown.
Saglimbene:
“Investors will have to deal with the fog.”
This creates high headline volatility on SPX going into January.
🔑 8. THE REAL TAKEAWAY FOR SPX & NDX TRADERS
This is no longer a hype-cycle AI rally.
You must trade:
Earnings
Margin guidance
Capex-to-revenue timing
🎯 AI → cost center (now)
🎯 AI → profit engine (unknown)
As long as that uncertainty persists,
➡️ volatility in NVDA, AAPL, GOOG, MSFT, META remains
➡️ SPX stays sensitive at the highs
🧨 Trader-Level Summary (no commentator BS)
Bullish forces
Fed rate cut probability exploding higher
Seasonality (December = historically strong)
Market breadth improving beyond megacaps
Bearish forces
Bitcoin risk proxy collapsing
AI spending profitability questioned
Mega-cap tech debt issuance
“Infra first, profits later” fear
🔥 HOW TO TRADE THIS (S&P Focused)
Watch these 3 things every day:
1️⃣ NVDA price action
If NVDA cracks ↓ → SPX loses leadership.
2️⃣ Alphabet’s Gemini 3 momentum
If Gemini models take market share:
→ NVDA supply chain narrative fractures
→ Rotation to CPUs/TPUs → hurting semis
3️⃣ Bitcoin risk proxy
BTC < $90k = risk appetite unwinding
🏁 ONE SENTENCE THAT MATTERS
SPX is still bullish, but leadership is no longer unquestioned — AI profitability and risk appetite are now the drivers, not AI hype.

SPX WEEK 48 — Strong Bounce Into Year-End! 2026 BULL RUN COMING?Strong week for the SP:SPX index. After two weeks of hesitation candles, price finally shifted back into strength and pushed decisively higher. This week’s candle not only reclaimed momentum but fully erased last week’s cooling-off behavior.
Price also moved well above the key mid-range levels that traders usually watch to define trend health. It’s now sitting firmly above the major risk zone and continues building distance away from it — a clear sign of strength. From the moment this week’s upside break triggered, the index has gained roughly 1.9%, and that kind of move typically translates into solid returns for options traders playing directional setups.
Major support zones sit lower around 5900, 5100, and the deeper structural support near 4000. As long as price holds above the upper layers of support, momentum remains intact.
On the higher-timeframe monthly chart, the trend has been active for eight straight months with no signs of exhaustion. Price is still far above the level where the monthly trend began, and even further above the long-term midline — showing how dominant the larger trend still is.
The 2-day chart continues to support the overall bullish structure, breaking above short-term levels and maintaining strength after multiple confirmations earlier in the week.
This week was a clean continuation of the broader uptrend — strong candle, strong momentum, and strong positioning above every major structural region.
Elite clarity. Elite precision. More coming soon.

Week 48 Market Update — $SPXStrong week for the SP:SPX index. After two weeks of hesitation candles, price finally shifted back into strength and pushed decisively higher. This week’s candle not only reclaimed momentum but fully erased last week’s cooling-off behavior.
Price also moved well above the key mid-range levels that traders usually watch to define trend health. It’s now sitting firmly above the major risk zone and continues building distance away from it — a clear sign of strength. From the moment this week’s upside break triggered, the index has gained roughly 1.9%, and that kind of move typically translates into solid returns for options traders playing directional setups.
Major support zones sit lower around 5900, 5100, and the deeper structural support near 4000. As long as price holds above the upper layers of support, momentum remains intact.
On the higher-timeframe monthly chart, the trend has been active for eight straight months with no signs of exhaustion. Price is still far above the level where the monthly trend began, and even further above the long-term midline — showing how dominant the larger trend still is.
The 2-day chart continues to support the overall bullish structure, breaking above short-term levels and maintaining strength after multiple confirmations earlier in the week.
This week was a clean continuation of the broader uptrend — strong candle, strong momentum, and strong positioning above every major structural region.
Elite clarity. Elite precision. More coming soon.

S&P500 Index Goes "Hanging Man" Due To Mixed Monthly ReturnsHanging man pattern is a single-candle bearish reversal signal that appears after an uptrend and warns that selling pressure is starting to emerge, even if the candle closes bullish.
For the S&P 500 November 2025 monthly candle, current data show a shallow pullback within an ongoing uptrend rather than a textbook hanging man, so any bearish implication is weak and unconfirmed.
What a hanging man is
A hanging man is a one-candle pattern that appears after a price advance and has a small real body near the top of the range, a long lower shadow (typically at least twice the body), and little or no upper shadow. It signals that sellers were strong intramonth (long lower wick) but buyers managed to push price back up by the close, creating a warning of potential trend exhaustion that must be confirmed by a subsequent bearish candle or downside break.
Key points for a valid hanging man on a higher timeframe such as a monthly chart are:
Clear prior uptrend into the candle.
Small body near the high, long lower shadow, minimal upper shadow.
Bearish confirmation the next bar (lower close or break of the low).
S&P 500 November 2025 monthly candle
Available November 2025 data show that the S&P 500 spent most of the month near recent highs after breaking above the 6,800 area, with the broader structure still strongly bullish into year-end 2025. While there was some downside volatility, the monthly action is better characterized as a modest pullback or consolidation after a strong advance than a classic hanging man with a pronounced long lower shadow and tiny body at the top of the range.
Several technical commentaries into late November and early December focus on resistance, overbought readings, and risk of correction, but they do not highlight a confirmed monthly hanging man or other completed exhaustion signal for 2025. One analysis even notes that a specific type of monthly exhaustion pattern is not yet in place for 2025, implying that the major trend remains intact despite short‑term risks.
Bearish technical perspectives from here
Even without a textbook monthly hanging man, there are credible bearish technical scenarios because the index is extended and pressing important resistance zones, meaning a confluence of resistance near high Fibonacci retracement levels, overbought momentum (elevated RSI), and key moving average and trendline tests as areas where a failure could trigger a correction.
Market breadth remains weak
In a short, in the year 2025 there're still no any new 52-week highs for major indices that count number of stocks above 200-Day average, like INDEX:MMTH , INDEX:NCTH , INDEX:R1TH , INDEX:S5TH and so on.
Potential bearish follow‑through in coming months generally centers on:
A failure to sustain above current resistance bands, leading to a pullback toward roughly the 5400 – 5000 region that aligns with prior supports and Fibonacci levels.
Rising volatility around macro catalysts such as inflation data and Federal Reserve policy decisions, which could accelerate downside if the index breaks below short‑term support and recent uptrend lines.
Overall, the S&P 500 remains in a longer‑term uptrend into late 2025, and any hanging‑man‑like monthly candle would be treated as an early warning, not a standalone sell signal; bears still need confirmation via a decisive break of support and a sequence of lower highs and lower lows on weekly and daily charts.

S&P 500 BullishPrice has broken out above the descending broadening wedge, confirming a strong bullish setup.
The market is currently testing the December Central Pivot (P) 6751.
As long as price remains above this level we expect continuation toward R1 at 6980.
A break above R1 would open the next upside target at R2 (7111).
The 1.618 Fibonacci extension aligns with the 7087 – 7140 zone creating a high probability resistance region.
Strong bullish momentum stays intact above the December Top Central Point (TC) 6800.

S&P 500: two false breakouts and signs of slowing momentumThe bullish scenario is still valid, but the market shows signs of exhaustion and a potential correction.
This analysis is based on the Initiative Analysis (IA) method.
Hello traders and investors!
On the weekly timeframe, the S&P 500 remains in a sideways range that has been forming since October.
The initiative is held by the buyers.
Upside targets:
First target: 6,883
Second target: a new ATH
Key observations inside the range
Two buyer-driven false breakouts (level manipulations).
Within this sideways structure, two clear false-breakout patterns have formed — both caused by buyers:
October 6 — manipulation around 6,580: A volume-backed attack by sellers → followed by buyer absorption → followed by a new ATH.
Manipulation around 6,637: A similar structure: strong seller attack → buyer absorption.
This pattern suggests that another ATH update is likely.
Signs of a potential pause or correction
The highest weekly volume in six months.
During the week of November 17, the index printed its largest weekly volume since April.
For a weekly timeframe, this is a meaningful signal — clear seller interest around current prices.
It is also possible that traders and funds are adding hedges in anticipation of a deeper correction.
A change in buyer behavior.
Looking at the entire move since May:
during the uptrend, no manipulations occurred — buyers simply pushed the price higher;
now, two manipulations inside a single range have already appeared, suggesting that buyers are finding it harder to push the market upward.
This is the second sign of potential momentum exhaustion.
Trading conclusions
Short-term (intraday):
Trades can be taken in both directions — the market is in a range, and both boundaries can be worked.
The daily timeframe also remains in a sideways structure.
Long-term (swing/position):
If positions are not for hedging, entries should be taken with caution.
Inside the range:
longs make sense when buyers defend the lower boundary,
shorts — when sellers defend the upper boundary.
Wishing you profitable trades!

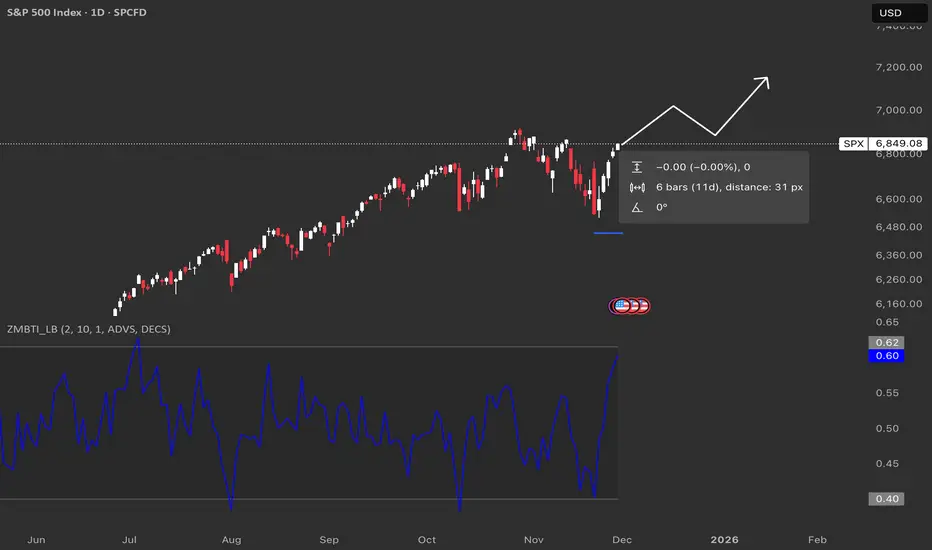
SPX : Potential Zweig Breadth ThrustThe Breadth Thrust Indicator is a technical indicator that looks at how many stocks advance vs. decline over 10 days.
When it snaps from around 0.40 to above about 0.615 in 10 trading days or less, that’s called a Zweig Breadth Thrust and has historically lined up with strong bull runs more often than not.
Historically it doesn’t happen often, but when it does, forward returns over the next several months have usually been positive, which is why traders get excited when the line on your chart surges like this.
Historically, once a full thrust has triggered, the index has often been higher 6–12 months later in the majority of cases.
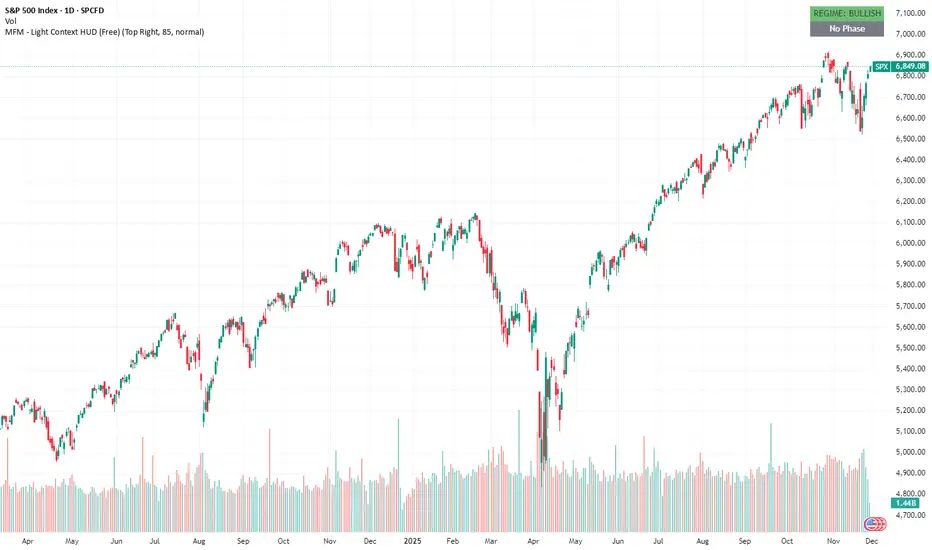
SPX – MFM Light HUD (Free) shows a clean bullish regimeThis post is an educational example of how to interpret the free MFM Light Context HUD. It does not provide trading signals or directional predictions.
The MFM – Light Context HUD (Minimal) gives a simple view of the structural state of the market. On SPX the model shows a clear bullish regime on the weekly momentum ratio. This does not predict direction. It only shows whether the underlying environment is supportive or restrictive.
The phase is currently neutral. That means SPX is not in a volatile phase, not in a compression field, and not in a drift phase. When no phase is active, price tends to behave without strong internal pressure. It is simply the absence of structural imbalance.
What the phases mean
These phases describe structure, not trade signals.
Volatile (Phase 1): fast movement and unstable conditions.
Compression (Phase 2): contracting conditions with slowing momentum.
Drift (Phase 3): more controlled and persistent movement.
Neutral: no clear structural condition.
This is why the HUD is useful. It removes noise and gives a clean top level reading.
You can still use your own strategy or analysis. The HUD just tells you what kind of environment you are operating in.
What you see in this chart
Weekly regime is bullish
No active phase
No signals or forecasts
Only structural context
Why this matters
In strong bullish regimes markets often react differently to pullbacks, volatility spikes or news events. Context does not replace analysis. It frames it.
Disclaimer
The Market Framework Model (MFM) and this indicator are for educational and informational purposes only. Nothing in this script, its visuals, or any documentation should be interpreted as financial advice or as a recommendation to buy or sell any asset.
All examples and historical references are illustrative only and do not imply future results. Trading and investing involve risk, including the potential loss of capital. Users remain fully responsible for their own decisions.
No guarantees are made regarding accuracy, completeness, or reliability. MFM describes structural market context only and should not be used as the sole basis for trading actions.
© 2025 Inratios. Market Framework Model (MFM) is protected via i-Depot (BOIP) – Ref. 155670.
Startups Reshaping the Global Market1. Innovation as the Core Driver of Market Transformation
Startups thrive on innovation—not just in products, but in processes, platforms, and business models. Traditional firms often struggle with legacy systems, bureaucratic decision-making, and risk aversion. Startups, however, operate with flexibility and a problem-solving mindset, enabling them to test new ideas quickly.
Examples of Startup-Led Innovations
FinTech companies introduced digital banking, mobile wallets, micro-lending, and crypto-based financial services.
HealthTech startups pioneered telemedicine, AI diagnostics, and wearable health monitoring.
CleanTech innovators built new pathways for sustainable energy, including solar SaaS models and electric mobility.
AgriTech startups are transforming farming with precision agriculture, drone monitoring, and smart irrigation.
By challenging traditional norms, startups create entirely new markets and redefine customer expectations.
2. Digital Transformation and the Acceleration of Automation
Startups have significantly accelerated global digital transformation. They adopt technologies like AI, machine learning, blockchain, IoT, cloud computing, robotics, and automation as foundational elements of their products and services.
Key Impacts
AI-driven startups are powering forecasting, personalization, fraud detection, and workflow automation across industries.
IoT startups are reshaping manufacturing, logistics, and smart cities by enabling real-time data flow and predictive maintenance.
Blockchain startups introduced decentralization in finance, supply chain tracking, and digital identity.
The rapid adoption of digital tools by startups forced larger companies to modernize at unprecedented speed. Today, many enterprises partner with or acquire startups to remain competitive.
3. Disruption of Traditional Industries
Startups often succeed by simplifying complex, expensive, or inefficient processes within existing industries. They disrupt markets by offering:
Lower costs
Better customer experience
Faster delivery
Unique value propositions
Personalized solutions
Industry Disruptions
Transportation: Ride-hailing and mobility startups like Uber, Ola, Grab shaped the future of mobility.
Hospitality: Airbnb redefined accommodation by turning homes into global travel assets.
Retail: E-commerce startups forced traditional retail to shift online.
Media and Entertainment: Streaming startups revolutionized how people consume content.
Education: EdTech platforms made learning accessible to anyone, anywhere.
These disruptions create ripple effects, compelling traditional players to adapt or risk extinction.
4. Democratizing Access to Products and Services
Startups often focus on removing barriers—whether financial, geographical, or technological. Their solutions frequently make services accessible to people who previously could not reach them.
Examples
FinTech startups provide digital loans to small businesses lacking access to traditional banking.
EdTech platforms bring high-quality education to rural areas.
HealthTech solutions enable remote diagnostics for patients in underserved regions.
E-commerce startups allow small merchants to sell nationwide.
This democratization gradually levels the playing field and broadens economic participation.
5. Globalization and Cross-Border Expansion
Startups scale quickly due to digital infrastructure, venture capital funding, and cross-border partnerships. Cloud technology and digital marketing allow them to reach global audiences with minimal physical presence.
Global Expansion Strategies
Launching digital-first products
Partnering with global distributors
Leveraging borderless payment gateways
Operating through remote teams
Using international venture ecosystems
China, India, the US, Southeast Asia, and Europe have emerged as startup hotspots, each contributing to the global innovation landscape. Today, a startup founded in Bangalore or Singapore can compete directly with players in Silicon Valley or London.
6. Redefining Work Dynamics and the Future of Employment
Startups have also reshaped the global labor market. Their work culture emphasizes:
Flexibility
Remote work capabilities
Decentralized teams
Innovation-centric roles
Project-based employment
They push the boundaries of traditional corporate structures, preferring flat hierarchies and collaborative environments.
Impact on the Global Workforce
The rise of freelancing and gig economy platforms.
Increased demand for digital skills—coding, analytics, design, marketing.
Hybrid work becoming a global norm.
New roles emerging in AI, Data Science, UX, and Sustainable Tech.
This shift changes how workers engage with employers and how companies attract global talent.
7. India, Southeast Asia, and Africa: Emerging Powerhouses
While Silicon Valley retains its influence, emerging markets are becoming innovation hubs. They offer young populations, rising internet penetration, and business-friendly policies.
India
Thriving FinTech, EdTech, and SaaS sectors
Large talent pool
Increasing unicorn count
Southeast Asia
Digital commerce boom
Mobility and logistics innovations
Rapid adoption of mobile-first solutions
Africa
FinTech revolutionizing financial inclusion
Startups solving local issues like energy and agriculture
These regions contribute to diversifying global innovation beyond traditional Western markets.
8. Venture Capital and Funding Fuel Startup Growth
The global flow of venture capital has empowered startups to scale quickly. Investors provide not only capital but also mentorship, networks, and strategic guidance.
Funding Trends
Focus on AI, deep tech, sustainability, and biotech.
Rise of sovereign wealth funds investing in global startups.
Increase in corporate venture capital.
Growth of startup incubators and accelerators.
This financial ecosystem feeds global innovation and drives market evolution.
9. Sustainability and Impact-Driven Startups
With climate concerns and ESG policies gaining momentum, startups are building environmentally responsible solutions. Sustainability-focused ventures are transforming energy, mobility, packaging, food production, and recycling.
Areas of impact
Renewable energy
Electric mobility
Carbon capture
Biodegradable materials
Circular economy models
Impact startups are pushing both governments and corporations toward greener practices.
10. Challenges Startups Face in Redefining Global Markets
Despite their strengths, startups also encounter significant barriers:
Regulatory uncertainty
High failure rates
Scaling challenges
Funding shortages during downturns
Talent acquisition struggles
Competition from large established companies
However, their ability to adapt quickly helps many survive and flourish.
Conclusion
Startups are no longer just small experimental ventures—they are powerful forces reshaping the global market. By driving innovation, accelerating digital transformation, democratizing services, disrupting traditional industries, and fostering global competition, startups are setting new benchmarks for how businesses operate. Their influence extends across economies, technologies, and societal structures, making them central to the future of global commerce.
In the coming decade, startups will continue to redefine not just markets, but also how people work, collaborate, and consume. Their role in shaping a smarter, more inclusive, and more sustainable world will be one of the defining forces of the global economy.
SPX to Money Supply WARNING!If the charts aren’t showing bubble setups, I’m not going to invent them. I post what the data shows. So please don’t shoot the messenger when I say GTFO & STFO.
And just to keep the facts straight:
Brokerage, stock, and crypto accounts are not part of M2.
Why does M2 matter?
It’s the actual spendable money in the economy.
When M2 grows faster than real output (as it did in 2021), price pressure builds.
The economy runs on liquidity.
Retail, goods, services all of it requires money you can actually spend, not paper gains in a trading account.
When the S&P 500 disconnects massively from M2 — like during the dot-com bubble — revenue and profit growth can’t keep pace. Valuations expand purely on speculation, not on real, organic fundamentals. That’s how multiples stretch and bubbles form.
The problem? Most retail traders have no idea this is happening. They’re trading with their hair on fire, following cute social-media stories dressed up as “analysis,” using strategies that have never been tested in real markets.
And that’s exactly how bubbles are fed:
big players sell into retail euphoria, and retail ends up holding the bag of schitt!
Buy when stocks are cheap, not at all-time highs in euphoria land.
"Price is what you payt, VALUE is what you get!"
THANK YOU for getting me to 5,000 followers! 🙏🔥
Let’s keep climbing.
If you enjoy the work:
👉 Drop a solid comment
Let’s push it to 6,000 and keep building a community grounded in truth, not hype.

More upside for SPX500USDHi traders,
Last week SPX500USD went up again just as I've said in my previous outlook.
Next week we could see a correction down and more upside for this pair.
Let's see what the market does and react.
Trade idea: Wait for a correction down. After a change in orderflow to bullish you could trade longs.
This shared post is only my point of view on what could be the next move in this pair based on my technical analysis.
But I react and trade on what I see in the chart, not what I've predicted or expect.
Don't be emotional, just trade your plan!
Eduwave

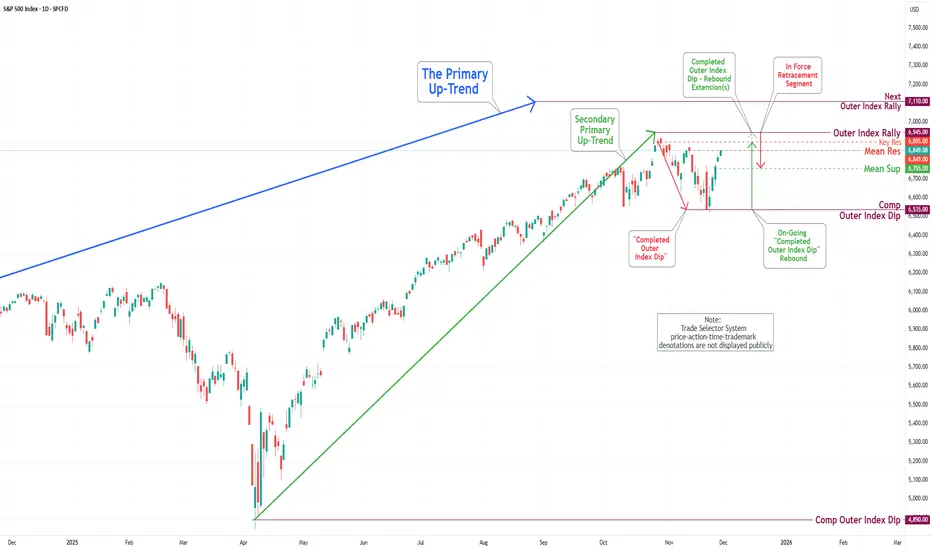
S&P 500 Daily Chart Analysis For Week of Nov 28, 2025Technical Analysis and Outlook:
In this abbreviated weekly trading session, influenced by a significant U.S. holiday and a cooling issue at the CyrusOne data centers at CME, the S&P 500 Index posted notable gains, reaching our primary target, the Mean Resistance at 6,849.
At present, this position suggests the potential for further upward movement, with primary targets established for a continuation of the robust trend toward Key Resistance at 6,895, followed by an extended target identified as the Outer Index Rally at 6,945.
Nevertheless, it is crucial to recognize that, given the prevailing market dynamics, there exists a considerable likelihood of an In-Force pullback from the aforementioned price targets.
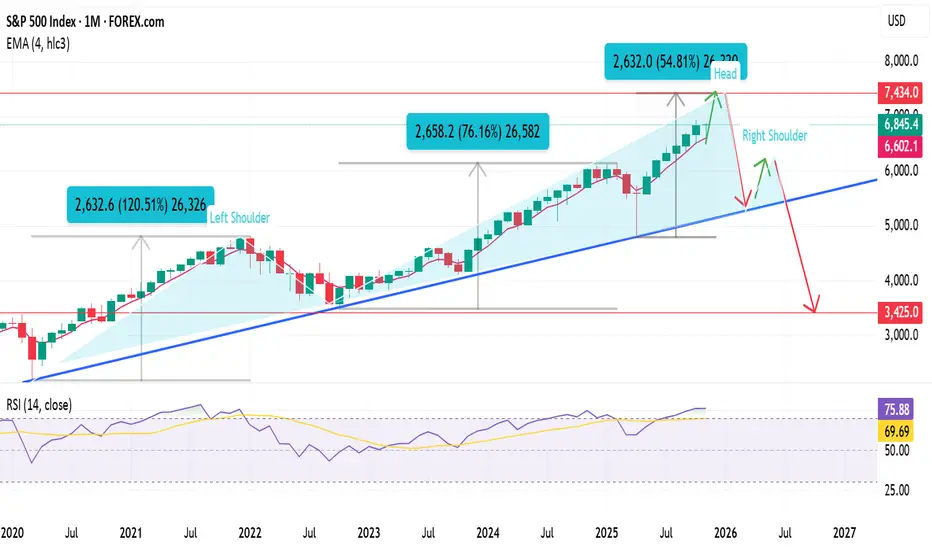
End of bull cycle targeting 7440 then bear market target 3400 In my view we're still in the bullish cycle started in 2020, my final target is 7440 area.
From that area I expect the beginning of the market bearish cycle.
On the monthly chart we can see an H&S pattern forming and a neckline supporting the bullish trend from 2020, I expect the break of the trendline in the next 3 months my target is 3420 area next autumn.
The Importance of Reserves in Trading1. Definition and Types of Reserves
Reserves generally refer to the assets that a country, financial institution, or corporation keeps aside to meet future obligations, emergencies, or to stabilize economic activities. In the context of trading, reserves are primarily associated with central banks, which maintain foreign exchange reserves, gold reserves, and other liquid assets.
Foreign Exchange Reserves (Forex Reserves): These are holdings of foreign currencies, usually in the form of government bonds or deposits, used to back a country’s currency, manage exchange rates, and intervene in the forex market.
Gold Reserves: Traditionally, gold has been a store of value and a hedge against currency volatility. It is part of a country’s overall reserve portfolio.
Special Drawing Rights (SDRs) and Reserve Assets: Allocated by the International Monetary Fund (IMF), these act as supplementary foreign exchange reserve assets to support international liquidity.
Corporate and Bank Reserves: On a smaller scale, businesses and banks maintain cash or liquid reserves to manage operational risks, meet obligations, and ensure stability in trading activities.
2. Stabilizing Currency and Exchange Rates
One of the primary reasons reserves are important in trading is their role in stabilizing a country’s currency. In international trade, goods and services are often priced in stable foreign currencies, particularly the US dollar, Euro, or Japanese Yen. If a country’s currency fluctuates excessively due to market pressures, trade becomes unpredictable and costly.
Reserves allow central banks to intervene in the forex market by buying or selling currencies to maintain exchange rate stability. For example, if the local currency is depreciating sharply, the central bank can sell foreign exchange reserves to support its currency, preventing sudden spikes in import costs and preserving the competitiveness of exports. This stabilization ensures smoother trade transactions, predictable pricing, and confidence among international trading partners.
3. Ensuring Liquidity and Meeting Payment Obligations
Trade often involves payments across borders, which requires liquidity in foreign currency. Countries and corporations holding sufficient reserves can easily settle import bills, service foreign debts, and maintain creditworthiness. For businesses, maintaining cash reserves ensures that operational transactions, supplier payments, and contractual obligations are met without delay.
In times of economic stress, such as a balance-of-payments crisis, reserves act as a crucial liquidity buffer. They allow a country to continue trading, importing essential goods, and servicing debts even when other sources of financing are constrained. Without adequate reserves, a country risks defaulting on payments, facing higher borrowing costs, or experiencing a freeze in trade flows, all of which can be catastrophic for the economy.
4. Building Market Confidence and Creditworthiness
Reserves are not only about liquidity—they are also a signal of financial strength. Large reserves indicate that a country or institution is well-prepared to handle external shocks, giving confidence to investors, traders, and international financial institutions. This confidence translates into lower borrowing costs, stronger credit ratings, and greater willingness of foreign partners to engage in trade.
For instance, countries with ample forex reserves are perceived as more stable and less risky, which encourages foreign trade and investment. Corporations with healthy cash reserves or liquid assets are considered reliable partners in trade agreements, leading to smoother transactions and more favorable credit terms.
5. Hedging Against Trade Risks
International trade is inherently risky due to fluctuating exchange rates, commodity price volatility, geopolitical tensions, and economic downturns. Reserves act as a hedge against these risks. For example:
If a country faces a sudden surge in import prices due to a weakening local currency, reserves can be used to stabilize the exchange rate.
In commodity trading, reserves of strategic goods or currency assets can prevent supply disruptions or price shocks.
During global financial crises, reserves provide a cushion to continue critical trade operations without resorting to excessive borrowing or austerity measures.
This risk mitigation ensures that trade continues even under adverse conditions, protecting both the domestic economy and international trade relationships.
6. Facilitating Monetary and Trade Policies
Reserves give governments and central banks the flexibility to implement monetary and trade policies. By managing reserves effectively, countries can influence interest rates, control inflation, and maintain competitive export pricing. For instance, a country seeking to boost exports might use its reserves to prevent excessive appreciation of its currency, keeping export goods affordable in the global market.
Reserves also enable governments to implement trade agreements, provide subsidies, or intervene in strategic sectors without destabilizing the economy. They act as a financial lever, giving policymakers tools to balance growth, trade, and economic stability.
7. Supporting Crisis Management
History has repeatedly shown that countries with insufficient reserves face severe consequences during economic crises. Examples include sudden capital outflows, currency collapses, or trade restrictions. Reserves act as a shock absorber, allowing countries to navigate crises with minimal disruption to trade. During the 1997 Asian financial crisis, nations with higher reserves were able to stabilize their currencies faster, maintain trade flows, and recover more quickly than those with depleted reserves.
8. Strategic and Geopolitical Importance
Reserves also carry strategic significance. Countries with substantial reserves can influence global trade dynamics, secure critical imports, and participate in international financial negotiations with greater leverage. In geopolitically tense situations, reserves ensure that trade and essential imports continue uninterrupted, supporting national security and economic sovereignty.
Conclusion
Reserves are much more than a financial metric—they are a critical tool that underpins trading activities at every level. They stabilize currency and exchange rates, ensure liquidity, signal creditworthiness, mitigate risks, and enable effective policy implementation. For businesses, sufficient reserves safeguard operational continuity and international trade reliability. For countries, reserves act as both a shield against economic shocks and a lever for strategic influence in global markets.
In an interconnected and unpredictable global economy, reserves are the silent guardian of trade. They enable economies to operate smoothly, sustain investor confidence, and maintain a competitive edge in international commerce. Countries or institutions that fail to maintain adequate reserves face heightened vulnerability to market volatility, trade disruptions, and financial crises. Therefore, managing reserves prudently is not just an accounting exercise—it is a vital component of sustainable economic growth and successful trading.
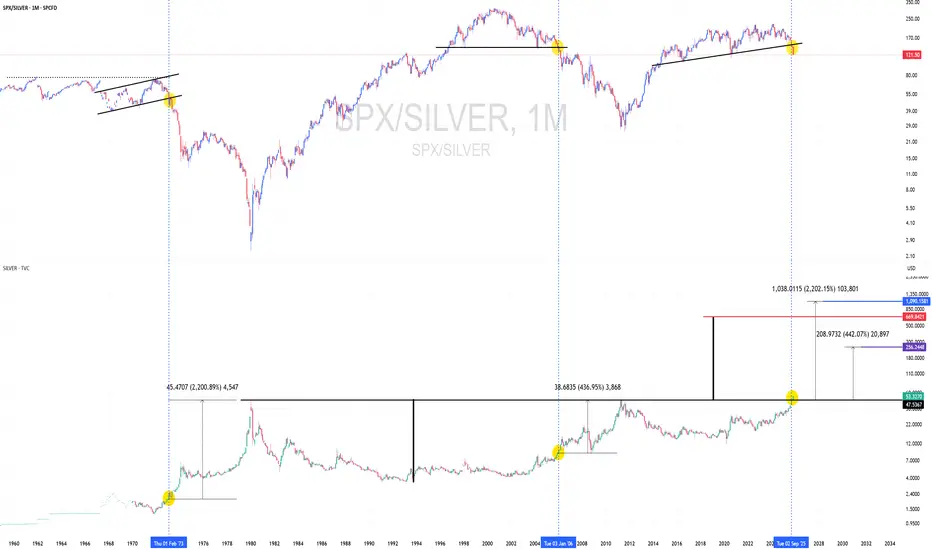
The bull market for silver is just getting started.Could be one of the most important charts out there right now.
The question is this: is this a 1970's bull market, or a 2000's one?
Silver targets: $250 or $1000? Cup and handle measured move is around $670.
US500 Remains BullishFundamental Analysis
US equities strengthened as the Fed rate-cut expectations solidified, which pushes bond yields lower and supports equity valuations. Markets now price in a high probability of a further cut in the coming Dec FOMC meeting. This sentiment reduces tightening fears and maintains the 'soft landing' narrative.
Corporate earnings remain broadly resilient. AI leaders and large-cap growth companies continue to underpin the US500 index despite recent volatility in some tech stocks. Meanwhile, macro data shows moderating growth and easing inflation. Investors are watching upcoming US data releases, including US PCE and US NFP, for confirmation of the disinflationary trend.
Technical Analysis
The US500 trades in a clear uptrend, with price holding above the recent resistance zone between 6,700 and 6,830. Price presses toward the old record high resistance at the 6,890–6,925 range. The index has strong support at approximately 6,515 points.
Dips toward the 6,700 area are currently viewed as 'buy-the-dip' zones. A decisive break above the prior record high would target the psychologically important 7,000 figure.
Sentiment Analysis and Outlook
Near term, the bias remains cautiously bullish: supportive the Fed expectations, solid earnings, and seasonal strength favor the upside. However, high valuations leave the index sensitive to any negative surprise in data or policy. A more hawkish tone from the Fed or unexpectedly strong inflation could trigger a pullback, but the base case assumes shallow corrections within the ongoing uptrend.
Analysis by Terence Hove, Senior Financial Markets Strategists at Exness

SPX/PA - SPX/Palladium ratio flashing a buy$SP:SPX/NYMEX:PA1!
Palladium is looking very good relative to equities currently, currently sitting at a ratio of over 4.50 : 1
I would be expecting to see this normalize around the 2.50-1.5 level, this would imply a significant period of outperformance of palladium relative to the SP500.
This coupled with the continued breakout of Silver and the strong performance of gold, comes together to form a very bullish outlook for palladium.

SP500 Bullish Divergence Detected (SPY)Bullish divergence of the SP500 and NYSE Advance Decline Line (ADL) is one of the most powerful and reliable "leading" indicators available. Here we see the ADL make a new high (a higher high) while the SP500 does not make a new high. This divergence indicates that market breadth is markly improving, which will ultimately drive the SP500 up to new all time highs in the coming weeks or months.
I am well aware of discussions about bubble fears and valuation concerns. It's important to note that the market can continue to increase for some time even with these concerns, so it would be a mistake to get out of or short the market at this time. Also, the technicals are pointing higher, not lower.
As long as this train keeps chugging, we should stay on this ride! Go long on SPY, VOO, QQQ!!!

Brace for Impact (I hope I am wrong)This market is reminiscent of the action before the 2020 crash. Above is now and below is 2020 covid crash. The charts are self explanatory so not much for me to say.
This is not a financial advice but for entertainment only. Please do your research!

A Storm Is Coming?Core Thesis: The market is colossally underestimating the risk of a deliberate US dollar devaluation. Contrary to popular belief, a weaker dollar in this specific context will not boost risk assets but will instead be the source of massive volatility, potentially exceeding 2008. The collapse will come from the unwinding of a global dollar-centric carry trade.
The Pillars of the Storm:
The Structural Imbalance (The Fuel):
The US, as the world's largest importer, sends dollars abroad. To maintain their export-oriented economies, foreigners reinvest these dollars into US assets (especially the top 7 S&P 500 stocks).
This has created a structural "carry trade": global investors are overexposed to US assets and, trusting that the dollar rallies in crises (like 2008), do not hedge their currency risk.
This continuous flow is a primary reason for extreme US equity market valuations. Global liquidity, not just fundamentals, has inflated prices.
The Trump Agenda (The Trigger):
The Trump administration is actively pursuing a weaker dollar to gain an upper hand in the economic conflict with China, using tariffs as leverage.
Since Trump took office, we have already seen episodes where the dollar and stocks sell off simultaneously – a warning sign that the traditional correlation is breaking.
The Federal Reserve (The Accelerator):
Trump needs a dovish Fed to weaken the dollar. The appointment of Steven Miran to the Fed, with his interest rate projections 100bps below other members, is a clear signal of this direction.
A new Fed Chair, more aligned with Trump, will likely take over in 2026 to implement a more aggressively accommodative monetary policy.
The Crisis Mechanism:
The trap is set in the following scenario:
The Fed cuts rates aggressively to weaken the dollar, following Trump's agenda.
The dollar devalues significantly.
For a foreign investor, the return is: (S&P 500 Return) + (FX Change). With the dollar falling, their gains are eroded or turn into losses.
This triggers a mass exodus of these foreign investors, who start selling US assets to protect their returns.
The selling is amplified by the structural fragility: everyone is positioned the same way. Liquidity evaporates.
Panic sets in when the typical "Fed put" (intervention to save the market) fails, because more liquidity injected by the Fed would depress the dollar even further, amplifying the equity selloff instead of containing it.
Warning Signals to Monitor:
Primary Signal: Equity selling occurring simultaneously with a depreciating dollar.
Confirmation Signal: A rise in implied volatility (skew) in the currency market.
Market Signal: Underperformance of high-beta and low-quality stocks, indicating that risk capital flows are drying up.
Critical Signal: Any Fed intervention that, instead of calming the market, causes an even larger selloff in the dollar and stocks.
Current Positioning & Conclusion:
In the short term, the author maintains long positions in equities, gold, and silver, as liquidity tailwinds are still favorable. However, the storm is forming. The market is as complacent about a weak dollar as it was about mortgages in 2007. When the signals above flash, indicating that cross-border flow risk is materializing, it will be time to position defensively: short equities, long volatility, and short the US dollar.
The crisis is not a matter of "if," but "when" these structural flows begin to reverse. Awareness of this mechanism is the single greatest edge an investor can have today.

Looking at SPX on a Large Timeframe Post the 08 market crash price has accelerated very fast away from the trend line I have drawn in white. Is it following another trend like the one drawn in dotted green, or will a retest of the white line come.
It is more likely in my opinion that it follows the green curve up as a drop like that would be a massive bubble pop.
See how it unfolds
Monthly timeframe
