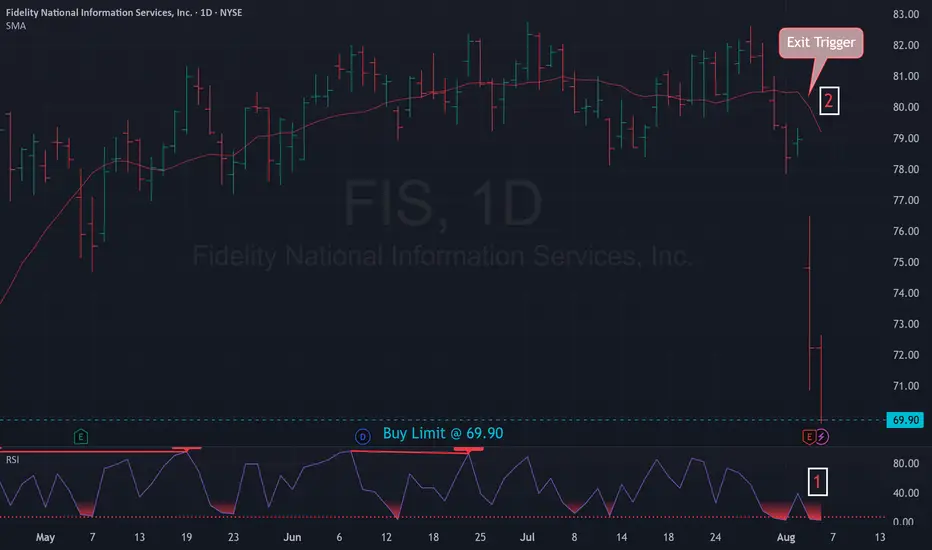
Mean Reversion Setup: FIS1. RSI in oversold region
2. Price likely to rebound back the the mean
Trade Rules:
Entry Trigger - RSI has cross below oversold region, enter limit buy at close price
Exit Trigger - Close at market when close price cross above exit trigger (Red Line)
Next report date
—
Report period
—
EPS estimate
—
Revenue estimate
—
0.28 EUR
760.22 M EUR
9.78 B EUR
517.26 M
About Fidelity National Information Services, Inc.
Sector
Industry
CEO
Stephanie L. Ferris
Website
Headquarters
Jacksonville
Founded
1968
ISIN
US31620M1062
FIGI
BBG00QPL5DZ6
Fidelity National Information Services, Inc. engages in the provision of technology solutions for financial institutions and businesses. It operates through the following segments: Banking Solutions, Capital Markets Solutions, and Corporate and Other. The Banking Solutions segment focuses on serving financial institutions with core processing software, transaction processing software, and complementary applications and services. The Capital Markets Solutions segment provides global financial services with buy- and sell-side solutions. The Corporate and Other segment includes corporate overhead expense, leveraged functions, and miscellaneous expenses. The company was founded in 1968 and is headquartered in Jacksonville, FL.
Related stocks
Not Yet CorrectedAlmost 22% in 1 rush in 1 week is a lot. The window is wide open. Wether we may close it is in the stars. But an attemptto do so may be well expected.

Cloud PenetratedThe drop was substantial today. Very often they are exaggerated and will correct.
The cloud is still rising. Mind that the present level where we seem to halt had been a critical one already almost exactly 1 year ago.

LONG FIS @ 85.50 - oversold in a falling wedge (maybe)NYSE:FIS is another decidedly unsexy and counterintuitive stock that I love to trade. It's pretty boring, except when it's not. It's in a year long uptrend so that alone is attractive. That falling wedge referenced in the title isn't particularly relevant to MY trade thesis but maybe it would be

Fidelity National launches climate risk assessment modelFidelity National Information Services Inc., a renowned financial services and outsourcing solutions provider, recently unveiled a new product to address climate risk assessment. As businesses grapple with the increasing uncertainty brought about by global climate change, Fidelity is positioning i

Fidelity ,,, Buy opportunity Uptrend
Trading on Pullback has several benefits such as setting a small SL and trading in the direction of trend.
As you see, it has been a pullback to the broken level and there is a good bullish candle as trigger for entry to buying position by offering a sl at about 73.

Fidelity Matrix with harmonic coneIn a taylorist expansion trend, the shaded area represents the 1.2 : .8 estimated strike targets. From which a Diamond appears. UNLESS fundamentals fail and the stock experiences a 0 02 % SD move. Can begin setting parameters for potential strikes with higher probability.

Looking extremely bullish on FIS.Thank you as always for watching my video! Please feel free to like, share, and comment on this video!

$FIS Ready for Base Breakout?NYSE:FIS has been forming a base for about a year. I like how it is above the 50 DMA and all other shorter term Moving Averages. It is, however, still below an 18-month AVWAP (meaning that going back 18 months, stockholders by price and volume are slightly underwater). That may be an area of overhe

$FIS Bearish Parallel Trend Line BreakNYSE:FIS : The stock has recently experienced a break in its bearish parallel trend line, signaling a reversal from bullish to bearish. Given this technical shift, we are now turning our stance to buying positions in $FIS.

See all ideas
Summarizing what the indicators are suggesting.
Neutral
SellBuy
Strong sellStrong buy
Strong sellSellNeutralBuyStrong buy
Neutral
SellBuy
Strong sellStrong buy
Strong sellSellNeutralBuyStrong buy
Neutral
SellBuy
Strong sellStrong buy
Strong sellSellNeutralBuyStrong buy
An aggregate view of professional's ratings.
Neutral
SellBuy
Strong sellStrong buy
Strong sellSellNeutralBuyStrong buy
Neutral
SellBuy
Strong sellStrong buy
Strong sellSellNeutralBuyStrong buy
Neutral
SellBuy
Strong sellStrong buy
Strong sellSellNeutralBuyStrong buy
Displays a symbol's price movements over previous years to identify recurring trends.
FIS4633271
Fidelity National Information Services, Inc. 4.75% 15-MAY-2048Yield to maturity
5.97%
Maturity date
May 15, 2048
US31620MAU0
Fidelity National Information Services, Inc. 4.5% 15-AUG-2046Yield to maturity
5.92%
Maturity date
Aug 15, 2046
FIS5442204
Fidelity National Information Services, Inc. 5.625% 15-JUL-2052Yield to maturity
5.82%
Maturity date
Jul 15, 2052
US31620MBU9
Fidelity National Information Services, Inc. 3.1% 01-MAR-2041Yield to maturity
5.68%
Maturity date
Mar 1, 2041
XS184343568
Fidelity National Information Services, Inc. 3.36% 21-MAY-2031Yield to maturity
5.12%
Maturity date
May 21, 2031
US31620MBR6
Fidelity National Information Services, Inc. 1.15% 01-MAR-2026Yield to maturity
4.74%
Maturity date
Mar 1, 2026
FIS5442203
Fidelity National Information Services, Inc. 5.1% 15-JUL-2032Yield to maturity
4.68%
Maturity date
Jul 15, 2032
US31620MBT2
Fidelity National Information Services, Inc. 2.25% 01-MAR-2031Yield to maturity
4.65%
Maturity date
Mar 1, 2031
US31620MBJ4
Fidelity National Information Services, Inc. 3.75% 21-MAY-2029Yield to maturity
4.45%
Maturity date
May 21, 2029
FIS5442202
Fidelity National Information Services, Inc. 4.7% 15-JUL-2027Yield to maturity
4.41%
Maturity date
Jul 15, 2027
US31620MBS4
Fidelity National Information Services, Inc. 1.65% 01-MAR-2028Yield to maturity
4.34%
Maturity date
Mar 1, 2028
See all FNIS bonds
Curated watchlists where FNIS is featured.


Frequently Asked Questions
The current price of FNIS is 55.56 EUR — it has increased by 2.08% in the past 24 hours. Watch Fidelity National Information Services, Inc. stock price performance more closely on the chart.
Depending on the exchange, the stock ticker may vary. For instance, on VIE exchange Fidelity National Information Services, Inc. stocks are traded under the ticker FNIS.
FNIS stock has fallen by −2.37% compared to the previous week, the month change is a −4.80% fall, over the last year Fidelity National Information Services, Inc. has showed a −31.90% decrease.
We've gathered analysts' opinions on Fidelity National Information Services, Inc. future price: according to them, FNIS price has a max estimate of 80.24 EUR and a min estimate of 51.77 EUR. Watch FNIS chart and read a more detailed Fidelity National Information Services, Inc. stock forecast: see what analysts think of Fidelity National Information Services, Inc. and suggest that you do with its stocks.
FNIS reached its all-time high on Feb 19, 2020 with the price of 147.00 EUR, and its all-time low was 44.84 EUR and was reached on Oct 30, 2023. View more price dynamics on FNIS chart.
See other stocks reaching their highest and lowest prices.
See other stocks reaching their highest and lowest prices.
FNIS stock is 2.53% volatile and has beta coefficient of 0.32. Track Fidelity National Information Services, Inc. stock price on the chart and check out the list of the most volatile stocks — is Fidelity National Information Services, Inc. there?
Today Fidelity National Information Services, Inc. has the market capitalization of 28.78 B, it has increased by 1.70% over the last week.
Yes, you can track Fidelity National Information Services, Inc. financials in yearly and quarterly reports right on TradingView.
Fidelity National Information Services, Inc. is going to release the next earnings report on Feb 17, 2026. Keep track of upcoming events with our Earnings Calendar.
FNIS earnings for the last quarter are 1.29 EUR per share, whereas the estimation was 1.27 EUR resulting in a 1.72% surprise. The estimated earnings for the next quarter are 1.46 EUR per share. See more details about Fidelity National Information Services, Inc. earnings.
Fidelity National Information Services, Inc. revenue for the last quarter amounts to 2.32 B EUR, despite the estimated figure of 2.27 B EUR. In the next quarter, revenue is expected to reach 2.38 B EUR.
FNIS net income for the last quarter is 224.98 M EUR, while the quarter before that showed −398.98 M EUR of net income which accounts for 156.39% change. Track more Fidelity National Information Services, Inc. financial stats to get the full picture.
Yes, FNIS dividends are paid quarterly. The last dividend per share was 0.34 EUR. As of today, Dividend Yield (TTM)% is 2.43%. Tracking Fidelity National Information Services, Inc. dividends might help you take more informed decisions.
As of Nov 24, 2025, the company has 50 K employees. See our rating of the largest employees — is Fidelity National Information Services, Inc. on this list?
EBITDA measures a company's operating performance, its growth signifies an improvement in the efficiency of a company. Fidelity National Information Services, Inc. EBITDA is 3.62 B EUR, and current EBITDA margin is 40.70%. See more stats in Fidelity National Information Services, Inc. financial statements.
Like other stocks, FNIS shares are traded on stock exchanges, e.g. Nasdaq, Nyse, Euronext, and the easiest way to buy them is through an online stock broker. To do this, you need to open an account and follow a broker's procedures, then start trading. You can trade Fidelity National Information Services, Inc. stock right from TradingView charts — choose your broker and connect to your account.
Investing in stocks requires a comprehensive research: you should carefully study all the available data, e.g. company's financials, related news, and its technical analysis. So Fidelity National Information Services, Inc. technincal analysis shows the sell today, and its 1 week rating is sell. Since market conditions are prone to changes, it's worth looking a bit further into the future — according to the 1 month rating Fidelity National Information Services, Inc. stock shows the sell signal. See more of Fidelity National Information Services, Inc. technicals for a more comprehensive analysis.
If you're still not sure, try looking for inspiration in our curated watchlists.
If you're still not sure, try looking for inspiration in our curated watchlists.