Fidelity National launches climate risk assessment modelFidelity National Information Services Inc., a renowned financial services and outsourcing solutions provider, recently unveiled a new product to address climate risk assessment. As businesses grapple with the increasing uncertainty brought about by global climate change, Fidelity is positioning i
Next report date
—
Report period
—
EPS estimate
—
Revenue estimate
—
−11.44USD
−6.65 BUSD
9.82 BUSD
555.83 M
About Fidelity National Information Services, Inc.
Sector
Industry
CEO
Stephanie L. Ferris
Website
Headquarters
Jacksonville
Employees (FY)
60 K
Founded
1968
FIGI
BBG000BK2F42
Fidelity National Information Services, Inc. engages in the provision of technology solutions for financial institutions and businesses. It operates through the following segments: Banking, Capital Markets, and Corporate and Other. The Banking segment focuses on serving financial institutions with core processing software, transaction processing software, and complementary applications and services. The Capital Markets segment provides global financial services with buy- and sell-side solutions. The Corporate and Other segment includes corporate overhead expense, leveraged functions, and miscellaneous expenses. The company was founded in 1968 and is headquartered in Jacksonville, FL.

Fidelity ,,, Buy opportunity Uptrend
Trading on Pullback has several benefits such as setting a small SL and trading in the direction of trend.
As you see, it has been a pullback to the broken level and there is a good bullish candle as trigger for entry to buying position by offering a sl at about 73.

Fidelity Matrix with harmonic coneIn a taylorist expansion trend, the shaded area represents the 1.2 : .8 estimated strike targets. From which a Diamond appears. UNLESS fundamentals fail and the stock experiences a 0 02 % SD move. Can begin setting parameters for potential strikes with higher probability.

Looking extremely bullish on FIS.Thank you as always for watching my video! Please feel free to like, share, and comment on this video!

$FIS Ready for Base Breakout?NYSE:FIS has been forming a base for about a year. I like how it is above the 50 DMA and all other shorter term Moving Averages. It is, however, still below an 18-month AVWAP (meaning that going back 18 months, stockholders by price and volume are slightly underwater). That may be an area of overhe

$FIS Bearish Parallel Trend Line BreakNYSE:FIS : The stock has recently experienced a break in its bearish parallel trend line, signaling a reversal from bullish to bearish. Given this technical shift, we are now turning our stance to buying positions in $FIS.

FintechDaily IndexFintechDaily Index with a collection of publicly traded companies representing banking, securities and insurance technology industries.

FIS - Holding breakoutI've been in FIS since Jul 5 and the follow-through action has been disappointing to say the least. Still, FIS is holding the breakout and finding support around the $58.25 area and now has the ascending 9ema caught up.
On the M5 there's a clear, well-established descending TL in place and FIS fin

April Gainers (FIS, account up 0.16%)9th trade in April is NYSE:FIS .
Holding period is 35 days (3/13/23-4/17/23).
Account is up 0.16%.
Total return in April is 1.81%

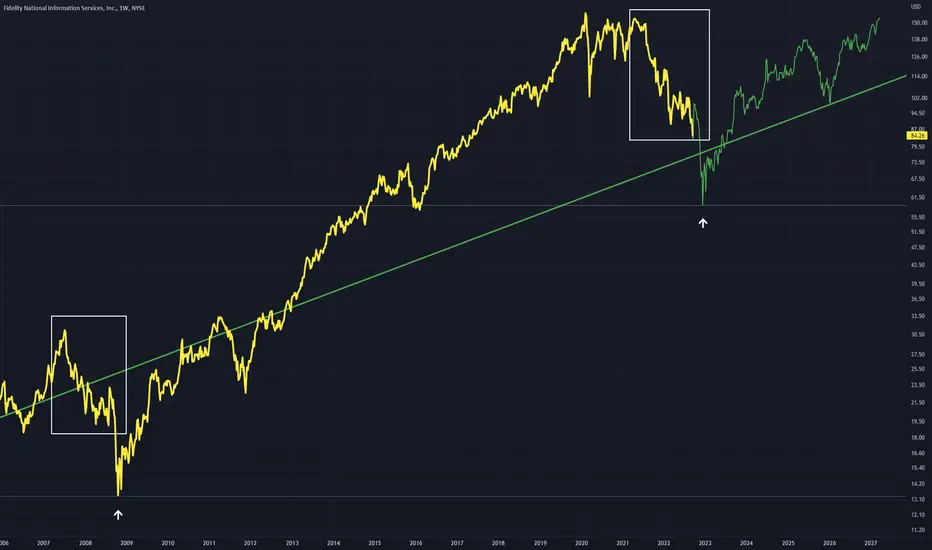
FIS - Similar Downward Structures If these downward periods are comparable FIS is in for a very sharp yet brief drop
From here price will lead to a recovery and maintain this green trend line
Downward structures in white boxes
See all ideas
An aggregate view of professional's ratings.
Trade directly on the supercharts through our supported, fully-verified and user-reviewed brokers.


Curated watchlists where FIS is featured.


Frequently Asked Questions
The current price of FIS is 75.68 USD — it has increased by 1.57% in the past 24 hours. Watch Fidelity National Information Services, Inc. stock price performance more closely on the chart.
Depending on the exchange, the stock ticker may vary. For instance, on NYSE exchange Fidelity National Information Services, Inc. stocks are traded under the ticker FIS.
FIS stock has fallen by 1.11% compared to the previous week, the month change is a 1.26% rise, over the last year Fidelity National Information Services, Inc. has showed a 22.90% increase.
We've gathered analysts' opinions on Fidelity National Information Services, Inc. future price: according to them, FIS price has a max estimate of 94.00 USD and a min estimate of 65.00 USD. Watch FIS chart and read a more detailed Fidelity National Information Services, Inc. stock forecast: see what analysts think of Fidelity National Information Services, Inc. and suggest that you do with its stocks.
FIS stock is 2.67% volatile and has beta coefficient of 1.05. Track Fidelity National Information Services, Inc. stock price on the chart and check out the list of the most volatile stocks — is Fidelity National Information Services, Inc. there?
Today Fidelity National Information Services, Inc. has the market capitalization of 41.45 B, it has decreased by 2.80% over the last week.
Yes, you can track Fidelity National Information Services, Inc. financials in yearly and quarterly reports right on TradingView.
Fidelity National Information Services, Inc. is going to release the next earnings report on Aug 6, 2024. Keep track of upcoming events with our Earnings Calendar.
FIS earnings for the last quarter are 1.10 USD per share, whereas the estimation was 0.96 USD resulting in a 14.12% surprise. The estimated earnings for the next quarter are 1.23 USD per share. See more details about Fidelity National Information Services, Inc. earnings.
Fidelity National Information Services, Inc. revenue for the last quarter amounts to 2.47 B USD, despite the estimated figure of 2.44 B USD. In the next quarter, revenue is expected to reach 2.49 B USD.
FIS net income for the last quarter is 17.00 M USD, while the quarter before that showed 251.00 M USD of net income which accounts for −93.23% change. Track more Fidelity National Information Services, Inc. financial stats to get the full picture.
Yes, FIS dividends are paid quarterly. The last dividend per share was 0.36 USD. As of today, Dividend Yield (TTM)% is 2.36%. Tracking Fidelity National Information Services, Inc. dividends might help you take more informed decisions.
As of Jul 27, 2024, the company has 60.00 K employees. See our rating of the largest employees — is Fidelity National Information Services, Inc. on this list?
EBITDA measures a company's operating performance, its growth signifies an improvement in the efficiency of a company. Fidelity National Information Services, Inc. EBITDA is 4.56 B USD, and current EBITDA margin is 36.57%. See more stats in Fidelity National Information Services, Inc. financial statements.
Like other stocks, FIS shares are traded on stock exchanges, e.g. Nasdaq, Nyse, Euronext, and the easiest way to buy them is through an online stock broker. To do this, you need to open an account and follow a broker's procedures, then start trading. You can trade Fidelity National Information Services, Inc. stock right from TradingView charts — choose your broker and connect to your account.
Investing in stocks requires a comprehensive research: you should carefully study all the available data, e.g. company's financials, related news, and its technical analysis. So Fidelity National Information Services, Inc. technincal analysis shows the buy rating today, and its 1 week rating is buy. Since market conditions are prone to changes, it's worth looking a bit further into the future — according to the 1 month rating Fidelity National Information Services, Inc. stock shows the neutral signal. See more of Fidelity National Information Services, Inc. technicals for a more comprehensive analysis.
If you're still not sure, try looking for inspiration in our curated watchlists.
If you're still not sure, try looking for inspiration in our curated watchlists.