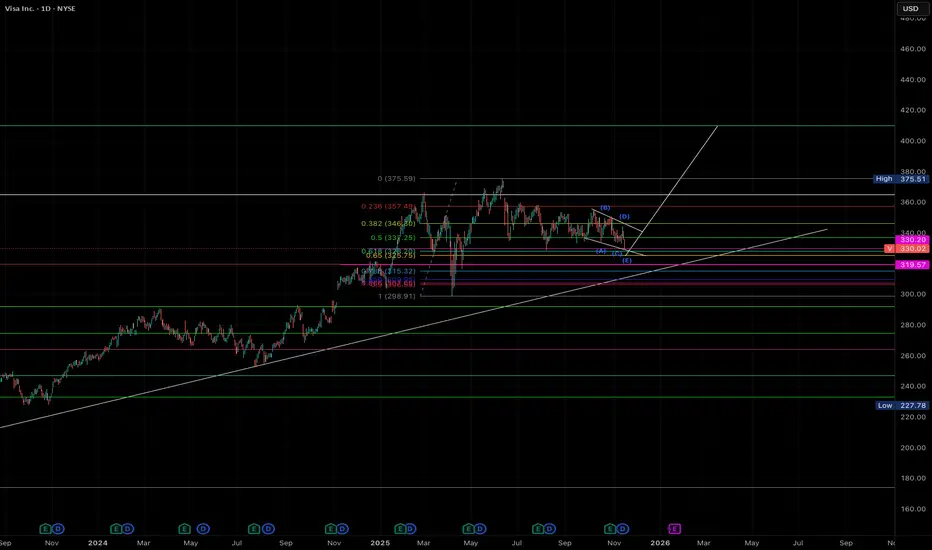
Visa Completing Corrective Structure Preparing for InflectionVisa is completing a corrective compression cycle into a multi-year trendline with Fib confluence and institutional support levels. This setup tilts the probability toward a bullish breakout and trend continuation. If visa holds this support area and breaks the descending wedge there is a possibilit
Next report date
—
Report period
—
EPS estimate
—
Revenue estimate
—
8.70 EUR
16.92 B EUR
34.09 B EUR
1.68 B
About Visa Inc.
Sector
Industry
CEO
Ryan McInerney
Website
Headquarters
San Francisco
Founded
1958
ISIN
US92826C8394
FIGI
BBG00GQ6SBW2
Visa, Inc. engages in the provision of digital payment services. It also facilitates global commerce through the transfer of value and information among a global network of consumers, merchants, financial institutions, businesses, strategic partners, and government entities. It offers debit cards, credit cards, prepaid products, commercial payment solutions, and global automated teller machines. The company was founded by Dee Hock in 1958 and is headquartered in San Francisco, CA.
Related stocks
VISA flashed a huge Sell SignalVisa Inc. (V) has been trading within a 7-year Channel Up and two weeks ago closed below its 1W MA50 (blue trend-line). Given that this took place after a June Higher High, we can claim that this break-out has confirmed the new Bear Cycle/ Leg of the pattern.
Observe the incredible symmetry of the

Visa May Be CrumblingVisa has been rangebound for months, but some traders may think it’s starting to head lower.
The first pattern on today’s chart is the consolidation period between late July and mid-November. At the beginning of the period, V’s 50-day simple moving average (SMA) was above its 100-day SMA. Both were

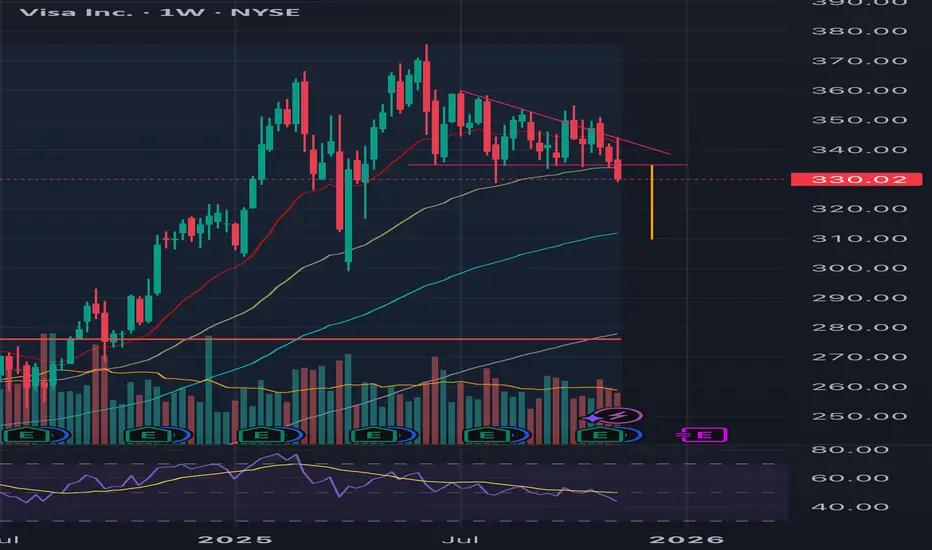
Descending triangle in VisaIt seems that $V has already broken a weekly descending triangle and want to revisit the $310 zone.
Visa Inc. In the financial sector, Visa Inc., a leader in digital payments globally, is getting closer to a critical support area and appears to be headed for possible decline. since Visa's shares approach this pivotal level, investors and experts are keeping a careful eye on it, since it may signal a change

$V Seismic shift is taking place.- $V & NYSE:MA will soon get toasted when their fees would compress which they charge for processing transaction.
- NYSE:XYZ has already started bitcoin based transaction which cost a seller no transaction fees. You might think this is contained but soon NYSE:TOST , NYSE:FI , NASDAQ:SHOP

Visa breaking lower? Bearish
- several head and shoulder set ups potentially setting up,
- initial 6% down stretching to 15%
- Price moves lower to closed the gap
- If the gap is closed it suggests a H&S pattern present
If the H&S pattern triggers possible down side of 50% from here,
In covid 2020 times it fell

$V$V – Market Review 💳📈
Our chart shows buyers are still willing to pay a premium for Visa demand remains strong, and price continues to respect higher support levels. That’s a signal of confidence.
However, I’m not seeing enough momentum yet for buyers to push above $360.
Why?
📌 Tariffs + tighter

VisaNYSE:V is forming a bull flag
weekly 9/21 EMAs and 50 SMA are supporting
daily 9/21 EMAs and 50/200 SMAs are supporting
NYSE:AXP earnings were good and that is a positive sign for Visa
I am bullish.
very good R/R with stops on weekly close below 50 SMA

**Trade Alert: $V NOV 07 2025 $345 CALLS – 37% ROI Target in 3 WEnter: $V NOV 07 2025 $345 CALLS
Buy in Price: $9.05 - $9.10
Take Profit: $12.47
Stop Bleeding: $8.01
ROI Potential: 37%
Exit Within: 3 Weeks

See all ideas
Summarizing what the indicators are suggesting.
Neutral
SellBuy
Strong sellStrong buy
Strong sellSellNeutralBuyStrong buy
Neutral
SellBuy
Strong sellStrong buy
Strong sellSellNeutralBuyStrong buy
Neutral
SellBuy
Strong sellStrong buy
Strong sellSellNeutralBuyStrong buy
An aggregate view of professional's ratings.
Neutral
SellBuy
Strong sellStrong buy
Strong sellSellNeutralBuyStrong buy
Neutral
SellBuy
Strong sellStrong buy
Strong sellSellNeutralBuyStrong buy
Neutral
SellBuy
Strong sellStrong buy
Strong sellSellNeutralBuyStrong buy
Displays a symbol's price movements over previous years to identify recurring trends.
3V69
Visa Inc. 3.65% 15-SEP-2047Yield to maturity
5.36%
Maturity date
Sep 15, 2047
3V68
Visa Inc. 4.3% 14-DEC-2045Yield to maturity
5.34%
Maturity date
Dec 14, 2045
US92826CAQ5
Visa Inc. 2.0% 15-AUG-2050Yield to maturity
5.33%
Maturity date
Aug 15, 2050
3V67
Visa Inc. 3.15% 14-DEC-2025Yield to maturity
5.14%
Maturity date
Dec 14, 2025
V4972835
Visa Inc. 2.7% 15-APR-2040Yield to maturity
4.97%
Maturity date
Apr 15, 2040
US92826CAE2
Visa Inc. 4.15% 14-DEC-2035Yield to maturity
4.58%
Maturity date
Dec 14, 2035
V4972836
Visa Inc. 2.05% 15-APR-2030Yield to maturity
4.00%
Maturity date
Apr 15, 2030
XS306372505
Visa Inc. 3.875% 15-MAY-2044Yield to maturity
4.00%
Maturity date
May 15, 2044
V5028512
Visa Inc. 1.1% 15-FEB-2031Yield to maturity
3.88%
Maturity date
Feb 15, 2031
V4972834
Visa Inc. 1.9% 15-APR-2027Yield to maturity
3.74%
Maturity date
Apr 15, 2027
3V6A
Visa Inc. 2.75% 15-SEP-2027Yield to maturity
3.73%
Maturity date
Sep 15, 2027
See all VISA bonds
Curated watchlists where VISA is featured.


Frequently Asked Questions
The current price of VISA is 280.90 EUR — it has increased by 1.39% in the past 24 hours. Watch Visa Inc. Class A stock price performance more closely on the chart.
Depending on the exchange, the stock ticker may vary. For instance, on VIE exchange Visa Inc. Class A stocks are traded under the ticker VISA.
VISA stock has fallen by −3.69% compared to the previous week, the month change is a −4.93% fall, over the last year Visa Inc. Class A has showed a −3.92% decrease.
We've gathered analysts' opinions on Visa Inc. Class A future price: according to them, VISA price has a max estimate of 389.41 EUR and a min estimate of 281.24 EUR. Watch VISA chart and read a more detailed Visa Inc. Class A stock forecast: see what analysts think of Visa Inc. Class A and suggest that you do with its stocks.
VISA reached its all-time high on Mar 3, 2025 with the price of 348.70 EUR, and its all-time low was 82.10 EUR and was reached on Jul 4, 2017. View more price dynamics on VISA chart.
See other stocks reaching their highest and lowest prices.
See other stocks reaching their highest and lowest prices.
VISA stock is 0.32% volatile and has beta coefficient of 0.89. Track Visa Inc. Class A stock price on the chart and check out the list of the most volatile stocks — is Visa Inc. Class A there?
Today Visa Inc. Class A has the market capitalization of 538.22 B, it has decreased by −0.55% over the last week.
Yes, you can track Visa Inc. Class A financials in yearly and quarterly reports right on TradingView.
Visa Inc. Class A is going to release the next earnings report on Jan 22, 2026. Keep track of upcoming events with our Earnings Calendar.
VISA earnings for the last quarter are 2.54 EUR per share, whereas the estimation was 2.53 EUR resulting in a 0.40% surprise. The estimated earnings for the next quarter are 2.72 EUR per share. See more details about Visa Inc. Class A earnings.
Visa Inc. Class A revenue for the last quarter amounts to 9.14 B EUR, despite the estimated figure of 9.05 B EUR. In the next quarter, revenue is expected to reach 9.26 B EUR.
VISA net income for the last quarter is 4.30 B EUR, while the quarter before that showed 4.43 B EUR of net income which accounts for −3.04% change. Track more Visa Inc. Class A financial stats to get the full picture.
Yes, VISA dividends are paid quarterly. The last dividend per share was 0.58 EUR. As of today, Dividend Yield (TTM)% is 0.73%. Tracking Visa Inc. Class A dividends might help you take more informed decisions.
Visa Inc. Class A dividend yield was 0.69% in 2025, and payout ratio reached 23.37%. The year before the numbers were 0.76% and 21.69% correspondingly. See high-dividend stocks and find more opportunities for your portfolio.
As of Nov 21, 2025, the company has 34.1 K employees. See our rating of the largest employees — is Visa Inc. Class A on this list?
EBITDA measures a company's operating performance, its growth signifies an improvement in the efficiency of a company. Visa Inc. Class A EBITDA is 23.93 B EUR, and current EBITDA margin is 70.22%. See more stats in Visa Inc. Class A financial statements.
Like other stocks, VISA shares are traded on stock exchanges, e.g. Nasdaq, Nyse, Euronext, and the easiest way to buy them is through an online stock broker. To do this, you need to open an account and follow a broker's procedures, then start trading. You can trade Visa Inc. Class A stock right from TradingView charts — choose your broker and connect to your account.
Investing in stocks requires a comprehensive research: you should carefully study all the available data, e.g. company's financials, related news, and its technical analysis. So Visa Inc. Class A technincal analysis shows the sell today, and its 1 week rating is sell. Since market conditions are prone to changes, it's worth looking a bit further into the future — according to the 1 month rating Visa Inc. Class A stock shows the neutral signal. See more of Visa Inc. Class A technicals for a more comprehensive analysis.
If you're still not sure, try looking for inspiration in our curated watchlists.
If you're still not sure, try looking for inspiration in our curated watchlists.