WAVES - 7th time lucky?looking good against above resistance, has been a sticky area. I'd be looking for a fail to short or a break in/above to open long
WAVESUSD trade ideas

#waves one of the strong altcoins against bitcoinWelcome to my analysis on waves/usd, in my opinion it is likely to bounce strong in coming days/weeks. Also, it is strong against bitcoin price action

Waves (WAVES) - July 4Hello?
Welcome, traders.
By "following", you can always get new information quickly.
Please also click "Like".
Have a good day.
-------------------------------------
(WAVESUSD 1W Chart)
If the price holds above the 9.4895768 point, it is expected that the uptrend will continue.
(1D chart)
An upward movement towards the 18.2242378-24.1237528 section is expected to accelerate the uptrend.
If it goes down, you should check for support at the 9.3749657-12.
If it falls from the 9.3749657 point, it is highly likely to enter the mid- to long-term investment zone, so you need to trade cautiously.
--------------------------------------
(WAVESBTC 1W chart)
If it rises above the 48850 Satoshi point and maintains the price, it is expected to create a new wave.
(1D chart)
It remains to be seen if the 46450 Satoshi-51340 Satoshi section can support and rise.
If it rises in the 46450 satoshi-51340 satoshi section, the upward trend is expected to accelerate.
If it falls from the 36650 Satoshi point, Stop Loss is required to preserve profit and loss.
------------------------------------------
We recommend that you trade with your average unit price.
This is because, if the price is below your average unit price, whether it is in an uptrend or in a downtrend, there is a high possibility that you will not be able to get a big profit due to the psychological burden.
The center of all trading starts with the average unit price at which you start trading.
If you ignore this, you may be trading in the wrong direction.
Therefore, it is important to find a way to lower the average unit price and adjust the proportion of the investment, ultimately allowing the funds corresponding to the profits to regenerate themselves.
------------------------------------------------------------ -----------------------------------------------------
** All indicators are lagging indicators.
Therefore, it is important to be aware that the indicator moves accordingly with the movement of price and volume.
However, for the sake of convenience, we are talking in reverse for the interpretation of the indicator.
** The wRSI_SR indicator is an indicator created by adding settings and options to the existing Stochastic RSI indicator.
Therefore, the interpretation is the same as the traditional Stochastic RSI indicator. (K, D line -> R, S line)
** The OBV indicator was re-created by applying a formula to the DepthHouse Trading indicator, an indicator disclosed by oh92. (Thanks for this.)
** See support, resistance, and abbreviation points.
** Support or resistance is based on the closing price of the 1D chart.
** All descriptions are for reference only and do not guarantee a profit or loss in investment.
Explanation of abbreviations displayed in the chart
R: A point or section of resistance that requires a response to preserve profits.
S-L: Stop Loss point or section
S: A point or section where you can buy to make a profit as a support point or section.
(Short-term Stop Loss can be said to be a point where profit and loss can be preserved or additional entry can be made through split trading. It is a short-term investment perspective.)
GAP refers to the difference in prices that occurred when the stock market, CME, and BAKKT exchanges were closed because they are not traded 24 hours a day.
G1 : Closing price when closed
G2: Opening price
(Example) Gap (G1-G2)

WAVES-USD climbing slow and steady LONGThank you for coming today , this post is my personal view on WAVES🌊, here we go🤸♂️🤸♀️🏄♂️🏁
I was just taking a look at WAVE price action, and we seem to be slowly, but surely climbing.
If we can keep this mild bullish momentum, I think we can easily reach our targets 🎯😃🐮
This is seeming to be a parabolic type✅💹⏫ situation , however, bear scenario🐻 might come into play if we break below blue curved line⤴🔵 on chart 📈🆗
WAVES has been around for about 4 years (Since June 2016)
With the WAVES🌊 technology and blockchain 💲⛓, users can create custom tokens💮 and Dapps🕹🎮, pretty cool 👏👌⭐!!
On May 21st📌📆 of this year, WAVES🌊 reached it's ATH(all time high,) of $43 dollars 👑
We are down approximately 60 percent in price from our all time high, I think its time we can make some bullish waves 🏊♂️🚣♂️💭🤔🌊
🎯📈📉
Targets are listed on chart, and it is wise to enter market with caution
Thank you for considering this short analysis!!
⏬⏬
👇
🛑🛑🛑 This is not financial advice 🛑🛑🛑 Above are approximate targets based on fibs and major trend lines etc. I always recommend looking at multiple charts when making a big investment, thank you!
Always have a stop loss ✋🛑💲 set🆗
Any thoughts 💭💡, questions 🙋♀️🙋♂️❓, good 👍, bad👎, happy 😄 or sad 😥, in the comments always welcome.😄
Jazerbay

Waves/usd bullish flag or pennant.. the point is that the price has to break the upper resistance. When this happens it may be a good idea to enter long.

I put a long position in Waves!!!In Daily timeframe, WAVES closed up with a bullish hammer in this timeframe and I decide to buy some WAVES contract to long position until $40 USD, that will be my target that I believe that WAVES going to up to recover the trend.

$waves calm before the stormWelcome to my analysis on $waves, in my opinion it dumped completely during btc crash, now it is the right time to accumulate..

Break the descending channel Break the descending channel and complete the pullback to it.
entry:15.5-15.8
t:17-20-28
sl:14


Waves break up the maximum historical price!!!This it's my targets for who invest or hold Waves. This cryptocurrency have a good fundamental key that make an unique cryptocurrency. But, I just prepare it for who hold Waves. Be prepare in this bull rally, Waves could to explode to $100 USD inminent. As Waves price it's around of $13.60 USD.

WAVEUSDWAVEUSD
Potential reversal zone (buying area) 26.80-25.80.
Targets 29.45-30.90.
Stop loss closing below 24.30

WAVESUSD Another Bullish Up Move.
Hi everyone:
Also eyeing WAVES for another bullish opportunity to the upside.
We can see price had a strong bullish impulse surge to the upside, and is now forming correction.
Naturally price needs time to correct the previous bullish move, and we start to see a bullish continuation structure, flag/channel in the making.
Currently price is at the lows of the correction, so best to wait for a completion of the correction its in , and look for bullish breakout and continuation correction to go higher.
Thank you


Waves can to continue to $25 USD!!! The trend it's keyWe see a good entry in this cryptocurrency. I use Simple FX and this broker offer this cryptocurrency to make trading. Now, Waves show us a good entry in the market price. Waves make support in the 0.618% of Fibonacci and this level work as support using Fibonacci. At the moment, I entry in Waves in long position until $25 USD. I believe that Waves make resistance in the Bitcoin crash.
s3.tradingview.com
In 3 Daily timeframe. We see that Waves continue bullish in this key support line to $25 USD.
s3.tradingview.com
And finally, look the monthly timeframe. Waves it's extremely bullish to $50 USD, That could be my first target if you hold Waves in this altseason. Based in my opinion, I don't know this cryptocurrency, but I interesting to know or make a specail analysis to talk about of their fundamental analysis in this cryptocurrency. I do not invest too in this cryptocurrency. But I found out that this cryptocurrency use blockchain parallel whether public or private blockchains. But, very soon, I will going to make an special analysis for you.


WAVES Coin TVL Reached To $1 Billion In 2021 Waves coin price traded at $20.30 with a gain of 46.45% in the last 24-hour. Furthermore, WAVES price bounced from the support of $11.50. In contrast, the market capitalization stands at $2.1 billion. Technically, investors can perceive a positive crossover in the EMA, and the price is above the 55-EMA. RSI index showcases an upward slope. Moreover, the price movement can be above the resistance of $23.50 in future trading sessions.
Resistance: $23.50
Support: $11.50


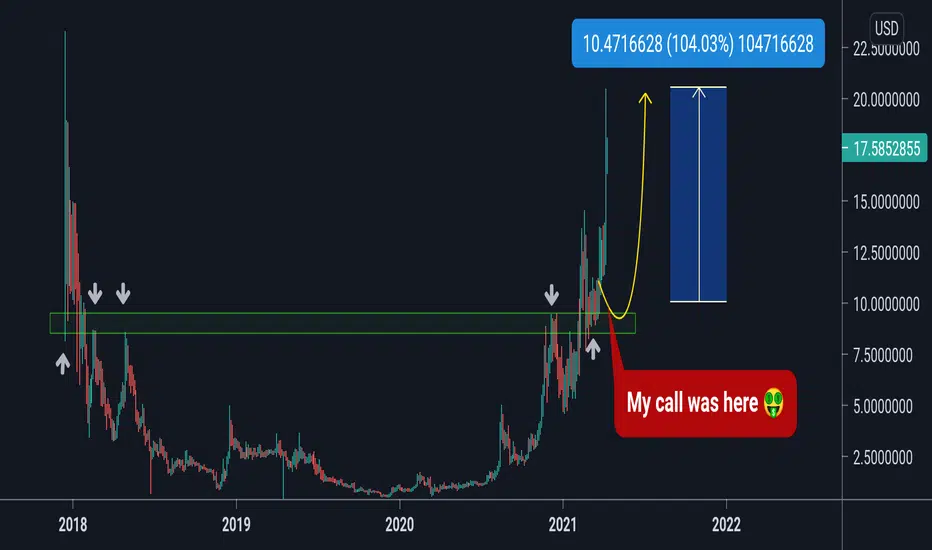
WAVES nice profits after my call (results)WAVES / USDT
hi guys i shared with you my call to buy waves in 17 march when it was in range 9$ - 10$
Yesterday it smashed 20$ and followed my arrows giving us more than 100% profit in spot 🔥
Hope you followed me in this call and did nice gains for everyone
Like and follow for more calls like this
WAVES ROCKET!?Guys I've been watching WAVES/USD for awhile now and it looks like we may be getting a break out here. Sorry if It's a bit clustered but the red box is a resistance area of value and the green and purple play a the support area of value. We continue to see higher lows as we come up to test this resistance at the red zone we also broke our last level of structure just slightly. The trend is up I think next time we come to test the top of this red box we will break through and sit on our next level of structure which is the yellow dotted line and hopefully continue up from there.
I meant to post this yesterday but here's where my brain is at on WAVES/USD
(NOT FINANCIAL ADVICE!)

WAVES - Catch the Wave - LONGLong. Important Resistance has got to crumble here. Two possible paths. $18 is inevitable. Target given.
