BTCUSD tripple TOPMonthly chart.
Tripple TOP.
Possible correction to 44.000 usd.
Price below 44.000 usd means that we are going more down to 30.000 usd.
Everybody is now bullish (if you look at charts on tradeview). Every one on youtube is screaming that the price is goin to 100-150.000 usd.
XBTUSD.P trade ideas

Short term SHORT Downtrend market structure in confluence with 61.8% fib levels and downtrend line support
Wait for double top on the M15 timeframe
#enjoytheprocess

HIDDEN PRICE TARGETS: MUST SEE MAGNETS 4 hour timeframe smart money contraction with value line. View MAGNET. Look at the bottom from how it made its way up. We had some dips.
Whales create those value lines as a symbol of chart language.
Please see most recent contractions. There is a green value line at the bottom. This means whales have decided to move up the trend. Will be wavy but will reach its destination.
Red trendline is a trendline the whales created so others may follow the lead moving downwards which indeed, came true and now they have ended it with a bullish green contraction.
Reads to move up to the next magnet because of value lines. Let’s be aware of sudden moves.

Bitcoin on a bearish trend but shows potential of a reversalBitcoin is currently on a confirmed bearish trend as it made an M formation with a support of about $67 000 and resistance of about $71 900, this is a confirmed bearish trend because it broke through the support and retested however, it still has not reached the lowest point of the last bullish start point which was $56 591 so that is the point where it is headed where it will make another support,likely to make a reversal at that point turning to a bullish trend that is likely to go through the ATH of $73 832, so dont be afraid to buy the coin as it goes down, you will thank yourself for the risk you have taken

Bitcoin price prediction, looks like its going to drop to a suppBitcoin looks like its heading for a support of $56 300, dont be afraid to keep buying the coin though as it showed potential of going up in the last weeks when it was triggereing the all time high of $71 000. It is simply giving investors a chance go maximise their profits because next time it shoots up to $70 000 it might go past the ATH going even over $80 000, watch how other investors predicted the price some of the most sensational investors predict it might even go over $100 000 so don't be afraid to buy the coin, you'll thank yourself later for the risk you took

BTCUSD technical and fundamental analysis.BTCUSD technical and fundamental analysis.
The price of the BTC is running between the traps but in this summer the price of the BTC may fly and reach to 100k. This analysis proves a little bit target of the BTC that it will reach to 75k in these coming days. If the price break the Stop loss and keep falling then we will be active again from 60k, 61k in the uptrend direction. BITSTAMP:BTCUSD
LIKE👍, COMMENT 💬 & FOLLOW ➕, these figures can encourage me to analyze more efficiently for you. My all followers are requested to support me, comment my ideas and share your thoughts in comment box and new comers are invited to follow and support me.

LONG X 50 HIGH PRECISION ODER FLOW TRADINGBTC futures leverage x 50 LONG
Entry Point : USD 64700
Goal : USD 70000
Stop Loss : USD 64100
Stall Brake : ??? USD
Leverage is extremely risky and must be executed with money that we are willing to lose or hit the stop loss.
Trading is the only profession in which the only person responsible for our actions is ourselves, our worst enemy is ourselves, here there is no one to blame, this is not a collective work, the only one who presses the sell button buy and know how much you invest and where to put a stop to losses, it is you, and only you, so always remember that.
Important note: THE LEVEL OF LEVERAGE OR LEVERAGE, the alert for taking early profits, loss stop adjustment and forced operation closure are not done by this means.
And also remember to always have control over your losses, focus on this and you will last.
Comment: WARNING!!!!
I AM NOT A FUTUROLOGIST, I DO NOT MAKE PREDICTIONS, I DO NOT DO ANALYSIS,
I AM 100% A MARKET OPERATOR, I WORK BASED ON MY EXPERIENCE, CONSISTENCY AND MY PLANNING IN TRADING.
Leave a comment that is helpful or encouraging. Together we can dominate the markets.

ı think this pattern can be occurı thind head and shoulder pattern can be occur and this stiation price will be increase but ı am not sure

What's Next For Bitcoin And Altcoins?Altcoins Bouncing, RSI About To Reverse & Why You Should Be Bullish 🚀
I hope you watched yesterday's market as excited as I did. Bitcoin broke a significant resistance and closed below 60k (today, it is already back above).
But there was an exciting aspect to watch: Despite the heavy dip, many altcoins dipped only moderately or were up!
As a result, the crypto market RSI stopped its long-term decline and didn't go lower.
The question is, what's next? Here's my scenario:
Bitcoin 📉
I am not a doom prophet, and I don't think Bitcoin will go much lower from here. Indeed, there might be another dip, but nothing substantial. Two other options are more likely, IMHO: a) Bitcoin goes sideways and hovers between 60-65k, or b) Bitcoin starts climbing and breaks the ATH.
Altcoins 🆙
We will see a more substantial relief rally for many altcoins now. Yesterday's performance was so strong that it showed we might have seen Bitcoin dominance at the top for this part of the cycle. From this point on, money should flow into the altcoins market.
How to trade 💹
Watch the coins that performed best yesterday (and today). BIST:LINK MIL:OCEAN , SEED_DONKEYDAN_MARKET_CAP:JASMY , SEED_DONKEYDAN_MARKET_CAP:FLOKI are just a few examples. Usually, the tokens that perform well on days like yesterday are the ones that deliver the best results.

BTCUSDRSI indicates Bullish Divergence. Which means that at any time the market trend can change to HH and HL.

Btcusd I have another position for others that didn't take the trade we are expecting price to move back to were it breaks out from so then we have more sell opportunities

BTC : I do not trade it but ...........if it breaks above the previous high, looks like it is aiming for $95,000
Just be careful.
Better still, SELL @ $95,000
As always, SELL when price is HIGH
Good luck.

Bitcoin Bull Cycle Timeframe Based on Halving Cycle DatesHistorically speaking, the number of days between the bottom of a bear market and the following halving date (Period A) is roughly the same number of days between the following halving date and the top of the following bull market (Period B). The positive rate of return comparing Period A vs B seems to be a diminishing ratio that gets halved every halving cycle.


BTC PERPPETUAL TRADE ,Bought at $65,770BTC PERPPETUAL TRADE
BTC BUY SETUP
Currently $65,810
Bought at $65,770
(Trading plan If BTC down to $64,200 we will add more buy)
Expecting target $66,900 0R ABOVE
Incase of early exist will update this anaylsis
Its not a Financial Advice

BTCSUDPair : BTCUSD ( Bitcoin / U.S Dollar )
Description :
Bearish Channel as an Corrective Pattern in Short Time Frame
Break of Structure
RSI - Divergence
Completed " 12345 " Impulsive Waves
Demand Zone


BTCUSDT 1WBTC ~ 1W
#BTC We found Important Support on the BITSTAMP:BTCUSD Chart.
If this price is reached, we will make a very large purchase here with our short term target still the same. $80,000 - $100,000+.

Bitcoin is in troubleGood day everyone
The last 5 times the Stoch RSI dropped below 77 within a monthly time frame there was a crash of more than 70%, I urge you to organize a chart and validate it for yourself. The TA if confirmed we can see a big dump and retest of around 28K to 5K. This will take the world by surprise and everyone will be in fear and confusion. However if we hold this area as support and mange to make a bullish cross in the Stoch RSI monthly this will invalidate and we can move towards 115k-180K.

BTCUSDT - at his mysterious area, what's next?? #BTCUSDT. well market very well holding his supporting area as we told you. and now market is at his today resistance area 66400 around.
keep close it that is your mysterious area for now.
if market hold it then again drop expected from here.
good luck
trade wisely

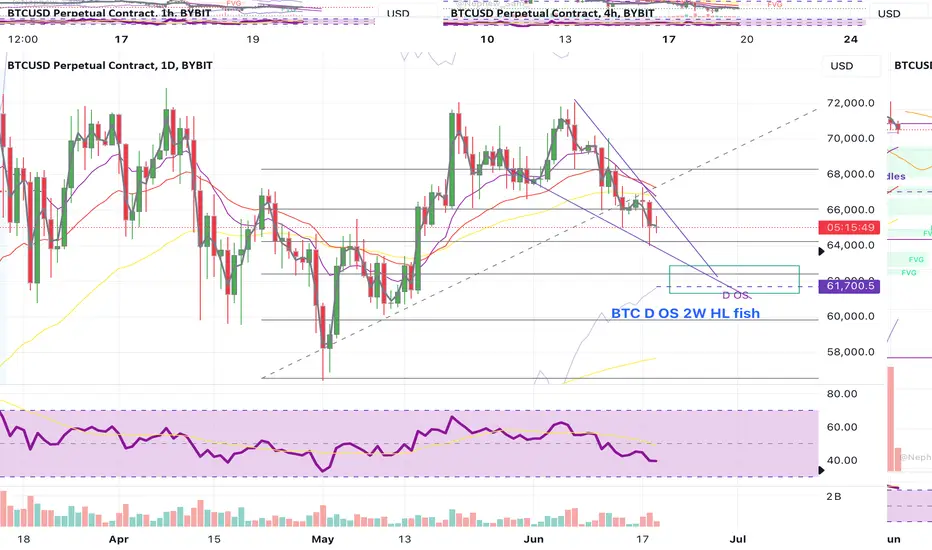
BTC keep it simple - play RSI Daily Oversold for the 2 week HLThis is the trade to focus on . B TC is currently grinding down the D and 4 H ema 12.
Wedge trading can be fun but a lot of work.
Better wait for clarity and buy some fear into Daily OS.
2 Week Higher low is the most likely scenario .
Also make a List of the strongest ALTS that you wanna play for the bounce.
mine is :
ETH ; PENDLE , UNI; MKR
Long BTCUSDIdea based on Classical chart patterns (Daily Chart).
Abbreviations:
M/W/D/H = Month/Week/Day/Hour
TL: Trendline
DT: Double Top
DTr: Descending Triangle
FW: Falling Wedge
Rct: Rectangle
We are still close to the all time highs, and we have also seen a breakout from a 4W FW on the weekly chart indicating some buying interest left near the relative lows.
When you look at the daily chart, there is a 6W DT which seems to be complete, but the downside breakout bar is with a long wick. And the closing bar was up.
This leads me to suspect this might be a fake breakout. Support is seen close to where we saw the 4W FW pattern completed, with levels close to the last bar acting as key bar to watch. Also, we can see the current market as inside a 20W Rct pattern and we are right around the middle of the box.
if the 6W DT fails the first target will be @ 77363, if completed, the target will become the 4W FW target @ 81678.90, and ultimately 20W Rct target @ 84001.60
the problem with this trade is that we still don't have a confirmation of a failure, so i need to place the stop loss at lows level within the formation of this DT pattern which is May16th low @ 64548, being fully aware that this trade might be one that could cause me to enter multiple times.
Risk reward calculated against capital using the first target is
Entry : 66330 or below
SL : 64548 (-0.73%) / TP: 77363(+4.50%)
RR: Apprx. 6:1
(as always, not investment advise or prediction)

My Plan on BTC Plan on btc
btc going down for fill daily fvg, charts are speaking mentioned everything on charts.
lets see what going next
