June 5 Bitcoin Bybit chart analysisHello
It's a Bitcoinguide.
If you have a "follower"
You can receive comment notifications on real-time travel routes and major sections.
If my analysis is helpful,
Please would like one booster button at the bottom.
Bitcoin 30-minute chart.
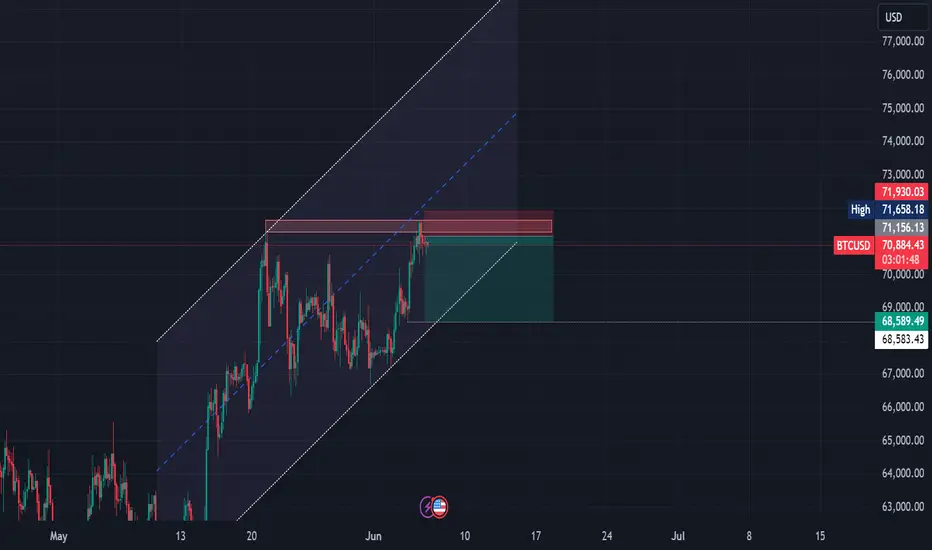
Based on tonight’s 30-minute chart
There are two indicator announcements at 9:30 and 11:00.
According to Nasdaq flow and Tether dominance movement
I created a strategy.
There's a lot of complicated stuff to explain, so I'll keep it very simple today.
*Red finger movement path
One-way long position strategy
1. $70698 long position entry zone / stop loss when breaking out of the green support line
2. $72446.5 long position 1st target -> Good 2nd target
Section 1 at the top is lateral to the right.
Section 2 at the bottom moves sideways to the right.
From the point of departure from section 2, the pattern is broken.
There is a possibility of further adjustment.
The vertical line on the right is because tomorrow is a holiday.
I have left a drawing based on the daily chart being generated on Friday, June 7th.
If you drag up or down
You can check support and resistance prices that are not visible on the chart.
As mentioned in the Good section,
This is the section where Bitcoin exceeds 100 million again.
After the rebound on Nasdaq today
There is a high possibility that there will be a downward movement.
If this movement is an upward wave, or even if it is only a sideways movement,
The beat can rise strongly.
Please watch to see if Tether dominance is connected to a vertical decline.
Because tomorrow is a holiday
I'll take a break tomorrow and see you on Friday.
Please note that my analysis up to this point is merely for reference and use.
I hope you operate safely with principled trading and stop loss required.
thank you
XBTUSDT trade ideas

A BULLISH SCENTThe Pressure on 72K is accumulating power for a gravitational breakthrough for the crypto Indutry.....BRIGHTSON

There is uncertainty about the trend of BitcoinToday, Bitcoin rose rapidly after breaking through the resistance levels of 69840 and 69000, reaching a peak of around 70250. But then it unexpectedly fell rapidly, falling to around 68550 in an hour, directly breaking the important resistance level of 68800 I mentioned. These show that the short-selling force completely suppressed the long-selling force in the short term, and the bullish trend cannot continue in the short term. You can wait until the price rebounds to the resistance level to sell. At present, you can pay attention to the resistance range of 69500-69800 above.
You can sell when the price rebounds to the resistance range of 69500-69800, with a target of 68500-68800
The above trading strategies are for reference only, and I will update the market analysis in my guidance group at any time

next posibblity moveStochastic at oversold, the price is making sideways movement and we have higher low above EMA50. soon next move posibilty is upward after breakout from shortime downtrend. $75k next new high or $85k?

MONEY FLOW INDEX We need RSI to reach 88.00, RSI is currently at 73.23. MONEY FLOW INDEX is currently at 70.86. Shows will reach 88.00. Please go back and see in two occasions where it did reach the top according to this 35DAY TF.
LMONEY FLOW INDEX has unveiled BTC next targets.
Next I want you to see the smart money contraction at the bottom. Reads 7k zone from its value line and its BULLISH. Now I want you to see the next HIGHER HIGHS from the 7k zone.
We have a new BULLISH contraction in PROCESS, current candle has not closed. There’s 18 days and 19 hours left.
Contraction is a 3 candle pattern. UP, DOWN, UP. Smart money creates them. If this current candle closes above into a certain location then it’s BULLISH. If so, LOOK OUT.

I suspect a breakout is imminent Price has managed to hold this range for the past two weeks. Therefore it can said that there has been enough time for active sellers to sell. Spot flows are bullish. The perp market is not yet overextended.
It seems most probable that equilibrium is higher.

breakout or 58k5th test of the highs you would be crazy to short it here when it's about to break out to 80-120
but
i have a weird feeling it's going to range for a while longer 60-70 june/july
and unlikely worst case it turns bearish and dumps somewhere 30-50

BTC in Elliot Waves Pattern. Bullish flag breakout soon?Hello guyzzz!
New week, new market update!
We are still in the same 3-month bullish flag. Adding Elliott Waves and a red rectangle here, if we reach it, will be the best option to open long positions.
Also, it seems like we're trying to retest the resistance line of the flag for the second time. If we don't reach the box, I think I will open a position around $66,000-$67,000 because, according to seasonal analysis, we are really close to the middle of the month, and the breakout can happen soon.
For sure, I suppose the movement will not be very active due to low volumes and the summer season, so be careful, use SL, and follow RM strategy!
Share your market vision in the comments 👇👀

BTCUSD Bearish ForecastHello there,
The BTCUSD moved higher from the low of 67,430, reaching the 69,123 resistance level. A drop below 68,336 could continue down to 63,464.
Bitcoin's volatility is expected to decrease, with 50-60% crashes being more likely than the 80-90% crashes seen in previous bear market.
Happy trading
K.
Disclaimer:
Past performance is not necessarily indicative of future results. Cryptocurrency markets are highly volatile and can change rapidly. It's essential to do your own research, set your own risk tolerance. This analysis is for educational /sharing purposes only and should not be taken as investment advice.

BTC : 3 wedges to Monitor + Double TopBTC : 3 wedges to Monitor + Double Top
On the rise :
1 Falling wedge has been detected , and it could bring the price to 72 928 $
______________________________
On the decline :
We can see on my graph a "Double top" + 2 Falling wedges
Regarding the double top, the bitcoin can reach 48 000 $ minimum!
About the 2 wedges :
The potential targets can reach 56 425 which is a strong support to break
be safe

Bitcoin (BTC) Price Resurgence, Binance Coin (BNB) Hits a New HThe price of the primary cryptocurrency has been on an uptrend in the past few days, rising to as high as $71,700 on June 5. Currently, it hovers the $71,000 mark (per CoinGecko’s data), representing an 11% increase on a monthly scale.
The resurgence coincided with record figures related to spot Bitcoin ETFs in the USA. Those products witnessed a total inflow of almost $900 million yesterday, the second-best day since their approval in January.
Numerous analysts believe BTC could soar even higher in the near future, assuming certain factors are in place. The X user, Captain Faibik, predicted a rise above $90,000 should the asset surpass the “crucial resistance level” of $71,300.
On the other hand, Ali Martinez assumed that a pullback is not out of the cards based on the TD sequential, which presents a sell signal on the four-hour chart. This technical analysis tool identifies potential price exhaustion points in the market and indicates when a trend is likely to reverse.
Could Bitcoin be worth $600,000?😱Hello, friends!🫶 Could Bitcoin be worth $600,000?😱
🧐Today, let's take a look at the weekly logarithmic chart of Bitcoin and try to identify similarities and patterns in its movement to discuss the future price development.
I've highlighted support levels with green 🟢 lines (looking at the overall chart, these levels represented accumulation zones for future growth), and resistance levels with red 🔴 lines (where bullish trends typically ended).
💡 Pay attention! The lower support line was touched twice in 2015-2016, and the next time this happened was in 2023-2024! Looking at the chart, it strongly resembles an accumulation zone!🔋
Could there be a longer cycle?🤩 Let's say, not a 4-year cycle (from halving to halving), but a cycle lasting 10 years? Could Bitcoin be worth $600,000?😱
I'm so interested to hear your opinions and expectations for the upcoming halving and the following year.😏
The world situation is worrisome and doesn't inspire optimism.😔 But if we remember the times of the coronavirus pandemic, then similar sentiments prevailed.🤪
What are your expectations? Let's discuss!😇
Thanks for Your attention!
Sincerely yours, Kateryna💙💛

Why I think Bitcoin Trades to $64k NextWhile there have been lots of wins on the fundamentals and adoption of Bitcoin globally increasing. There is still more to be desired from a technical perspective in my opinion.
This chart might look busy, but the outlook from here is quite simple for me. Let me break it down.
Why I think its weak
Price has on the 21st of May (Orange circle) failed to remain above resistance from the previous highs.
We have also failed to make any new higher highs since this rejection.
The Big Picture is still Bullish
We are also current trading in a range within the overall March range structure, that has yet to take out the high or low.
As my current thesis is the Bitcoin will trade higher in the coming months, It's reasonable to think that we go lower before the next leg higher.
I think there also some pragmatic selling happening ahead of the FOMC and CPI data that will release in the coming weeks.
Lower then Send It Higher
So in summary, $64,000 -> towards the fair value gap (green box) as the next likely move. And then I would like to see accumulation in that zone for the next move into new all time highs.
Invalidation of this idea, would be to close back above $72,000.

Stand pat!Hey guys and girls,
Here is an updated chart from my (Nov 12, 2023) post
As you can see, this is only half of the battle!
Further targets: $ 74k, $ 84k, and $ 100k
Appendix:
Structure: 5-3-5 (Inverted)
Bitcoin halving countdown: 49 Days
Technical Section:
Wave 5 has two different relationships:
1- If wave 3 is less than 161.8% of wave 1 -----> the 5th Wave overextends itself.
2- If Wave 3 is greater than 161.8% of wave 1 -----> Wave 5 = 100% , 161.8% or 262% of wave 1

BTC - Silence before the storm?BTC has been quite quiet lately but is it accumulating for an ATH? Let's look at the technicals.
Technicals
→ We broke above the channel and respected the retest. However, we failed volume to confirm the trend break. Are we accumulating to go up, or we are we failing?
→ There is also a zone which price touched multiple times.
Trade
→ I am conservative here for a swing trade. I like to see we a confirmed break at the 8H first resistance of around 70K$
Your trading friend,
Simba Trades


Bitcoin: Wyckoff TheoryAccumulation or distribution? An important question which comes to mind at this spot.
Wyckoff's theory was simple, accumulation occurs when larger participants are bidding supply, while retail & soft spoken traders are taking profits. With a little socio-economical understanding; a very-viable-variable here. People like to spend in the summer, the only issue is.. they spend what they have, not what they borrow! Now, in a distribution phase, you can assume what happens. Larger participants offload previous bids into soft spoken buyers hands, and exit the market in due size & time... Let's give a little thought here - If Blackrock was buying throughout 30's to near now... would they sell? would they let themselves become other's exit plan? An independent decision to make on their side.
Wyckoff’s concept of the “Composite Man” has been idealized as a guiding 'radar' in the markets, a “Composite Man” should and will lead the markets, allowing soft spoken traders to factualize the understanding of order flow, liquidity preference & the demand for money. His personalized idea of a 'market maker' explains how anyone can determine meaning, curvature & limitations in the market that is being rationalized. The methodology provides a framework to visualize & grasp how liquidity is utilized. Highlighting potential zones for reversals, different phases, & driving actions of market makers.
As Bitcoin progresses through this range, our deviation will get narrower; resulting in a larger move in either direction. Lingering through summer while the euphoria lasts seems best fit. Which then would either drop off a cliff or rebound back, into the cold winter. The time-price opportunity here suggests this will happen before the end of summer, thus saying if we do reach the $63,000-$64,000 level from here by mid June, the likely-hood of a large move will become exponential. Versa, in hopes this is an accumulation phase, seeing $80,000 would give me the confidence to say.. buy more alts & hold on. It would be nice to see Bitcoin push for the $100,000 level, we all want cheaper prices, though I hope in the end we all want a greater world to live in.
Who's your exit liquidity?
Index:
preliminary support (PS)
secondary test (ST)
sign of strength (SOS)
automatic reaction (AR)
sign of weakness (SOW)

Expert analysis may be able to help youIn this Analysis, we can see some Buy or sell Levels that I shared, watch it carefully, and Follow Price action.Thanks

June 4 Bitcoin Bybit chart analysisHello
It's a Bitcoinguide.
If you have a "follower"
You can receive comment notifications on real-time travel routes and major sections.
If my analysis is helpful,
Please would like one booster button at the bottom.
Bitcoin 30-minute chart.
There is a Nasdaq indicator announcement at 11pm tonight.
The beat is relatively good.
Nasdaq broke its pattern and reached the danger zone.
The Nasdaq movement is very important today.
Even when looking at the beat and tether dominance movement
In sections where there is a high possibility of sideways movement
We proceeded with the most reasonable strategy.
The purple finger section on the left is $68,950.
Yesterday, June 3rd, it was the entry section for long positions,
Let’s connect and continue today’s strategy.
*Sky blue finger movement path
Two-way neutral
Short->Long switching strategy
1. Short position entry zone at $69446 / Stop loss when the orange resistance line is broken
2. Switching long position at $68732.5 / Stop loss when breaking out of the light blue support line
3. $70494.5 long position 1st target -> Top 2nd -> Good 3rd
Those who have maintained long positions since yesterday
When the light blue support line at the bottom breaks away, operate with a stop loss (1 + 4 sections).
From the point of breaking the orange resistance line,
Since the upward trend can be connected, those who operate short positions
You need to be careful
If there is an immediate adjustment without short entry
Wait for long position in section 1 at the bottom
Even if a short entry at the top is successful,
Please note that you may be delayed up to 1 section.
Strong rise if the purple support line is maintained
Even if the green support line strategy is followed,
Upward rebound -> This may lead to a vertical rise after tomorrow.
Please refer to it.
I would like to ask you to simply use my analysis up to this point.
I hope you operate safely with principled trading and stop loss required.
thank you

June 7 Bitcoin Bybit chart analysisHello
It's a Bitcoinguide.
If you have a "follower"
You can receive comment notifications on real-time travel routes and major sections.
If my analysis is helpful,
Please would like one booster button at the bottom.
Bitcoin 30-minute chart.
At 9:30 tonight
There is one moderately important indicator announcement for the Nasdaq Non-Agricultural Index.
Even on Nasdaq, the short-term pattern is broken.
In the afternoon, Bitcoin was restored as explained in the details.
6-hour chart MACD deadcross in progress
The short-term pattern is broken.
So, after considering various conditions comprehensively,
I brought a one-way long position strategy.
This is because it is very difficult to explain positions with a high possibility of sideways trading.
I will simply summarize the analysis.
*Red finger movement path
One-way long position strategy
1. $70848.5 long position entry area / stop loss when breaking out of the light blue support line
2. $72446.5 long position primary target -> Good secondary target
Possibility of vertical rise if the purple support line is maintained
Even if we succeed in rebounding today
Because short-term patterns continue to break, NASDAQ
It must be strongly raised and coupled.
The MACD death cross on the 6-hour chart alone is not that scary.
As expected, I think the Nasdaq movement will be important.
Section 1 at the bottom is a section that traverses downward to the right.
If this section is exceeded or damaged, it will be adjusted below the Bottom during the weekend.
It can be connected, so be careful.
If you drag the chart up or down
Resistance line price and
You can check the support line price at the bottom.
If you succeed with today's strategy, this time you will really go to 100 million.
As the sideways movement gets longer, I keep turning into a shepherd boy.
Although it takes a long time
Because the overall flow and movement is in an upward trend,
Don't forget to follow principle trading and stop loss.
I hope you operate safely.
Thank you for your hard work this week too.
Although it's not enough, you're always with me
thank you!

BTC. Weekly trading levels 27.05.2024 - 2.06.2024During the week you can trade from these price levels. Finding the entry point into a transaction and its support is up to you, depending on your trading style and the development of the situation. Zones show preferred price ranges WHERE to look for an entry point into a trade.
If you expect any medium-term price movements, then most likely they will start from one of the zones.
Levels are valid for a week, the date is in the title. Next week I will adjust the levels based on new data and publish a new post.
! Please note that brokers have a difference in quotes, take this into account when trading.
The history of level development can be seen in my previous posts. They cannot be edited or deleted. Everything is fair. :)
----------------------------------------------
I don’t play guess the direction (that’s why there are no directional arrows), but zones (levels) are used for trading. We wait for the zone to approach, watch the reaction, and enter the trade.
Levels are drawn based on volumes and data from the CME. They are used as areas of interest for trading. Traded as classic support/resistance levels. We see the reaction to the rebound, we trade the rebound. We see a breakout and continue to trade on a rollback to the level. The worst option is if we revolve around the zone in a flat.
Do not reverse the market at every level; if there is a trend movement, consider it as an opportunity to continue the movement. Until the price has drawn a reversal pattern.
Don't forget to like Rocket and Subscribe!!! Feedback is very important to me!

Bitcoin in the short and mid term 2According to the previous analysis, Bitcoin reached the range of $70,000. (With the difference that he omitted the first short wave.)
It can now move towards the $62,000 target and have another bullish wave before a heavier fall, with a slight possibility of crossing the ceiling (orange scenario).
The ultimate goal of this analysis is for Bitcoin to fall to the $27,000 range in the coming months.
@JalilRafieefard
June 4, 2024

BTCUSD SHORT - THE ULTIMATE BIG SHORT SWINGHi all,
This time I present my big BTC short position I already jumped into at 70800 BTCUSD price after taking short liquidity on 4th of June.
This is multi-day/week SWING position entry!
Risk - Reward ratio is around 1:4.
If the price continue upwards, I will be adding to this position around 71500 and after sweeping 72k
Stop loss for this trade is 74222.
Take profit targets as presented.
Good luck and have fun!
