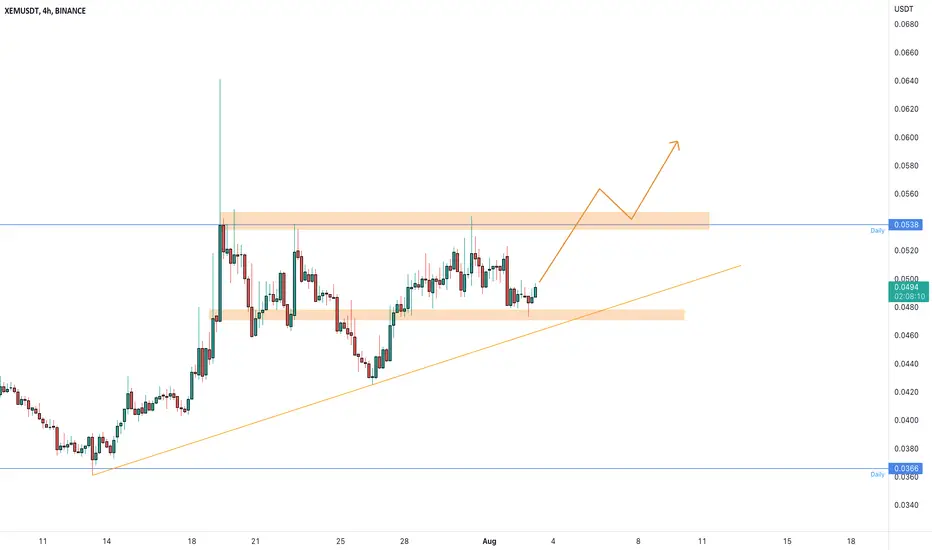
XEM/USDTXEM hasn't gone crazy yet and it looks like a good opportunity to ride.
Wait for the breakout to confirm and start accumulating.
The green space is for illustration only, it depends on your hands, as always.
You can find my channel, if you want.
XEMUSDT.P trade ideas

XEMUSDT #XEMUSDT
we published and shared this idea with you and gave good profits
Target 1️⃣ : done✅
Price reached : 0.0384$ ✅
Profit: 26.18%🚀🤑

XEMUSDT#XEMUSDT
there we have ppowerful support zone as you can see at the chart buy and hold it to the next targets at the chart we are in over sold area MACD is showing bullish EMAs showing a bullish move RSI is neutral Ichimoku cloud is bullish ZELMA is neutral Parabolic SAR is bullish Accumulation distribution is bullish Awesome oscillator is showing bullish

Is it possible that XEM like Bitcoin decides to be a butterfly?butterfly harmonic pattern:
AB=0.78 XA
BC=0.88 AB
CD=1.6 BC
or
CD=2.24 BC

XEMUSDTXEM is a cryptocurrency that powers the New Economy Movement blockchain. To verify transactions, NEM uses a unique consensus algorithm called Proof of ...

XEM
#XEM/USDT
Exchanges: Binance-Bittirex
Signal Type: Regular (Long)
Amount: 2.0%
💎 Entry Targets:
1) 325- 318
Take-Profit Targets:
Target 1: 337
Target 2: 341
Target 3: 358
Target 4: 365
Target 5:
Target 6:
Target 7:
🚫 Stop loss:
310

XEM / USDT LongBreak of trendline, targeting extensions, at 100% and 161.8%, with an intermediate target.


XEMUsdtlong time analyse
Xem can save own this time and now can back up
this is analyse for HODLERS not for short time but u can set close point for short time targets
GLL
EntryPoint:
0.0262
0.0249
Supports:
0.0209
0.0189
0.0151
Resistances:
0.0308
0.0359
Targets:
0.0418
0.0504
0.0650
0.0848
0.1089
mid time and HODL:
0.1649
0.2500
0.4520
GOAL:
0.9614
GL
Remember this for safe entry should wait break orange trend resistance line

XEMUSDT | APPROACHED TO SUPPORTXEMUSDT has been trading under the falling resistance. The price has approached to horizontal support after took a beat from falling resistance. The bullish candles formation on support will confirm the support hold by bulls.
The bulls need to hold the support zone and break above the resistance zone . While bears will be active below break of support.
Trade your levels accordingly.


XEMUSDT | SETUPXEMUSDT has been trading in bearish channel .
The price has approached to the upper boundary of channel.
There is a confluence zone having upper boundary of channel and 100MA.
The bulls need to break and sustain above the 0.23 fib level for further bullish trend
The bulls need to break above the horizontal resistance too.
Manage your trades accordingly.

XEMUSDTthe rocket is preparing to get up!
get ready !
it will not w8ing on u any more ! gEt rEday!
have fun ! & be rich !

XEM⚡⚡ #XEM/USDT ⚡⚡
Exchanges: Binance Futures
Signal Type: Regular (Long)
Leverage: Cross (20X)
Entry Zone:
1) 394
2) 389
3) 386
Take-Profit Targets:
1) 397
2) 402
3) 410
4) 421
Stop Targets:
1) 379
Trailing Configuration:
Entry: Percentage (0.5%)
Take-Profit: Percentage (0.5%)
Stop: Moving Target -
Trigger: Target (1)

Just pay attention to the compression intensity of the bollingerJust pay attention to the compression intensity of the bollinger bands indicator to see the huge currency pump


XEMUSDT | PARALLEL CHANNELXEMUST is trading within a parallel channel. The price is currently trading near the upper boundary of the channel.
The bulls need to break above the channel. While bears are active below the upper boundary of the channel.
Trade your levels accordingly.

XEM...make it simpleXEM is in buy zone, i see a huge opportunity here, stay tuned for updates.
THIS IS NOT A FINANCIAL ADVICE, PELASE INVEST AT YOUR RISK


XEMUSDT needs to create a breakoutThe price is creating an ascending triangle below the daily resistance at 0.053$ area where the price got rejections in the past.
On the 4h timeframe, the price is testing the 4h local support at 0.5$
How to approach it?
The price needs to create a new breakout from the daily historical resistance and retest it a new support, According to Plancton's strategy , we can set a nice order
–––––
Keep in mind.
🟣 Purple structure -> Monthly structure.
🔴 Red structure -> Weekly structure.
🔵 Blue structure -> Daily structure.
🟡 Yellow structure -> 4h structure.
–––––
Follow the Shrimp 🦐
XEMUSDT Breakout in 4HXEM/USDT forming in Ascending Triangle in 4H around : 0.0544
RSI Forming : Bullish Trend
EMA 20/500/200 : Is Good
1 Target : 0.0563

NEM (XEM) - July 20Hello?
Welcome, traders.
By "following", you can always get new information quickly.
Please also click "Like".
Have a good day.
-------------------------------------
(XEMUSDT 1W Chart)
Whether or not it can move higher than 0.0852 is crucial.
(1D chart)
Primary resistance: 0.0578-0.0666
Secondary resistance: 0.0852
Support: 0.0497
To move above the 0.0578-0.0666 range, the key is to keep the price above 0.0497.
------------------------------------------------------------ -------------------------------------------
** All indicators are lagging indicators.
Therefore, it is important to be aware that the indicator moves accordingly as price and volume move.
However, for the sake of convenience, we are talking in reverse for the interpretation of the indicator.
** The MRHAB-T indicator used in the chart is an indicator of our channel that has not been released yet.
** The OBV indicator was re-created by applying a formula to the DepthHouse Trading indicator, an indicator disclosed by oh92. (Thanks for this.)
** Support or resistance is based on the closing price of the 1D chart.
** All descriptions are for reference only and do not guarantee a profit or loss in investment.
(Short-term Stop Loss can be said to be a point where profit and loss can be preserved or additional entry can be made through split trading. It is a short-term investment perspective.)
---------------------------------

NEM/USDT Elliott Wave count 6H TFNem (New Economy Movement)formed a running triangle pattern that can send it to a new low. Entries below 0.0357 and TP1 0.0264 TP2 0.0225 TP3 0.0169 TP4 0.0098
