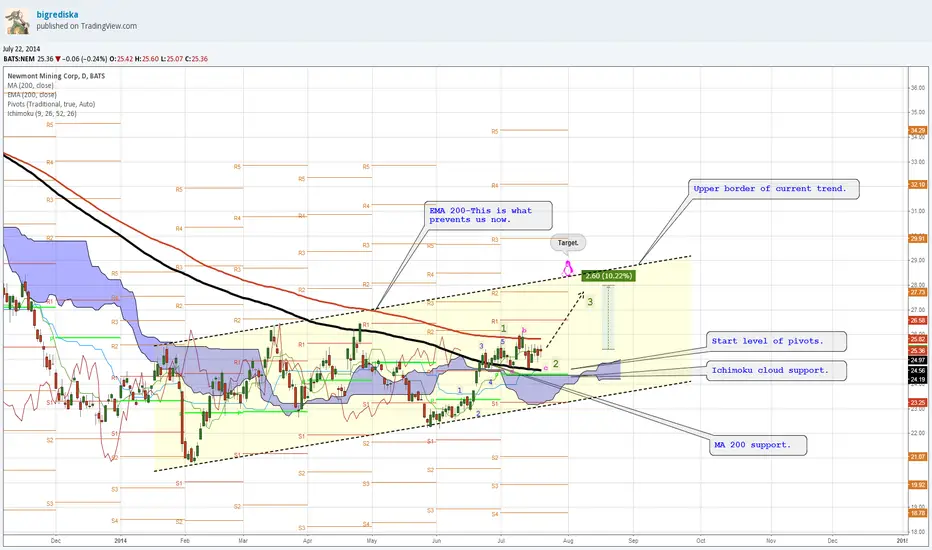
Not bad start position.What you should pay attention to?First- start level of pivots. Second- upper border of Ichimoku cloud support. Ma 200 is also not superfluous.
NMM trade ideas
Newmont Mining NEM - Daily - Setting up for a 3 pt rallyWe need an entire day above the "max time" level mentioned on the chart for a 16-day rally towards $28/sh.
Earnings are due in 7 days, so be mindful of that. If you can't accept a major move against you, then don't take this trade.
If the buy signal triggers, then we can look for a rally for 16 days that could carry up to the measurement from the low up to the "max time" (22.20 up to 25.14 = almost 3pts up to 28 for a target).
Note how well NEM has moved with these "TIME AT MODE" concepts in the past. Note the many other "time at mode" charts I have presented here at TradingView.
25.36 last NEM
Tim 1:02AM EST 7/22/2014

$NEMUnless the dark solid line is crossed at 26.42 on a weekly basis, this is a no-good stock. I am long lot of miners but not this

Newmont Mining NEM Daily Trend AnalysisNEM has nearly reached the conservative target for the move out of the 13-day accumulation area.
A more aggressive 27.40 target still stands and there is plenty of time left in the 13-day pattern.
If you are already long, stops can be raised to breakeven.
It is tempting to take some off the table given the decent return in a short period of time.
10:27AM EST, 3/17/2014
Tim 26.14 last NEM

Newmont Mining NEM to play catch up to the GDX GroupRisk 3% on the pair.
Target 10% return.
If the spread closes then the maximum gain is 21%.
The next step is to plot the ratio graph of these two (NEM/GDX) and make sure that is turning up.
I like the way NEM is acting here relative to the group and to the stock market.
Go long NEM and go short GDX. The profit is in the performance difference between the two. You only make money if NEM moves up more than GDX. The key is to put equal dollars into this trade.
Cheers.
Tim 11:32AM EST, Tuesday, March 4, 2014

Newmont Mining NEM base building patternThe chart is showing us that NEM has tried to base a number of times and all have failed. Each time there was a different pattern. This time we have a nice head&shoulders bottom formation.
I have noted key levels with the blue rays across the chart emanating from the price points that I think are important.
The risk-reward ratio here seems solid given the recent pullback. NEM fell back yesterday on a tad less volume and the last 3 up days have higher volume than the last 3 down days. So, some new buyers are coming in here and pushing up the price.
Let's see how this pans out.
Cheers.
Tim 12:19PM EST, Tuesday, Jan 28, 2014

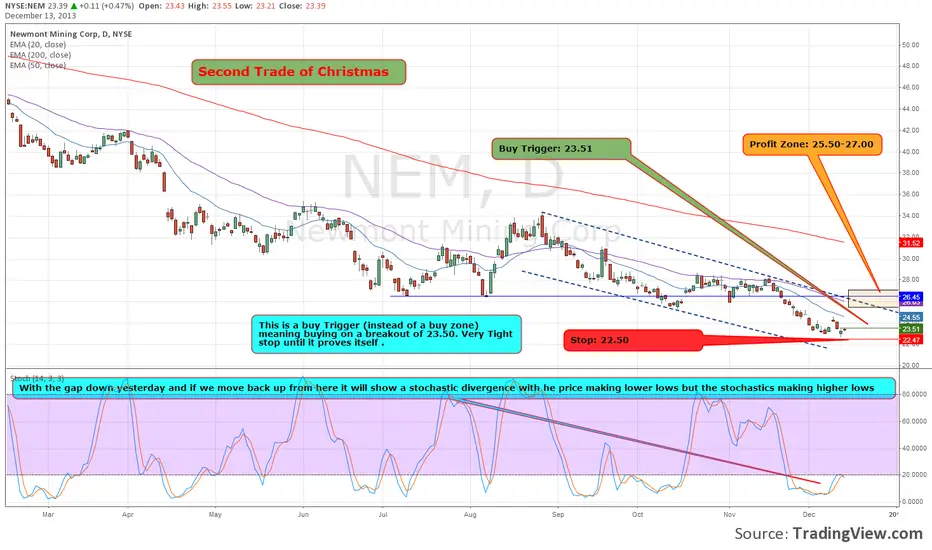
Second Trade of Christmas $NEM Possible Stochastic DivergenceThe Second in a series of 12 stocks leading up to Christmas. These are pure HPS set ups and I will personally take each set up when and if it triggers. You can follow along on www.daytradingradio.com live everyday from 8;00am-4;00pm et
Remember this is a buy on a break above 23.50
You could also substitute the GLD etf as they should move together (GLD a little stronger)


Interpreting gold with a minerIf the chart of gold cant tell you much (double -bottom similar to the 2008 retracement), try with NEM... as it has just formed a nice H&S inv. At the neck b/o w/ volumes TGT could be the yellow upper parallel with a double gap-fill and the 144 sma, which looks to be playing with the same GLD.
RSI div +
Correlation >0 and growing
