XLMBTC trade ideas

XLM/BTC daily chart long position #XLX/BTC daily chart long position buy in red box.... best entry in yellow line...... SL: 0.00000768..... TARGET : green lines 👉🏻@merlincryptogroup👈🏻

XLM - Ascending TriangleTaking a closer look at XLM, the 1H is looking great. We are currently in an ascending channel with a great chance of breaking above resistance around 990 sats. Currently still sitting on our 940 entry for the other chart, I can see us hitting 990 sats within the next 24 hours. From there the targets are still 990 - 1,100 - 1,300. Good luck my fellow traders!

XLM - One More RunLooking at the daily chart on XLM/BTC, it looks like we have one more good run left in us. I am making a risk trade to ride this for a good 10-20% profit since the data looks good. Doing a fib retracement of the last pump I am setting my targets at those levels of 980 - 1,100 - 1,300 sats. I will be entering here at 940 sats. Setting a stop loss at 915 - a close one in case there is a crash due to Bitcoin's current volatile movement. Good luck traders!


XLM Fib timezones and targetsJust a quick study based on the current periodic spikes. Considering major trendlines and the most prominent fib retracement.

XLMBTC - Long - Potential 10.68%XLMBTC - Long - Potential 10.68%
Entry- 989
TP1- 1037
TP2- 1098
SL- 932
- Key Notes - BTC PRICE STABLE, DOM DOWN = ALTS INCREASE
- RR - 1.78
- Trailing Buy - 1%
- Trailing Profit - 1%
- Trailing Stop-Loss - no

XLM breakout?XLM leaving his triangle and going for the first resistance, if it breaks there's a nice profit ahead.


Time to make stellar performance again XLM!Looking at the longer term development helps to put the recent price action into perspective. XLMBTC has actually moved back and forth across the old downward sloping trendline that originates from June 2019. That trendline now coincides with a strong support/resistance against which XLM is presently forming an ascending triangle. That can be seen better from the 12h chart below.
Last November there was a tremendeous impuls to the upside all the way to 1200 sats level. After that started a strong correction, while BTC was making a strong move up, taking XLM all the way down to 400 sats level. From that bottom on 3 Jan XLM has recovered to the present level, back to the 840-880 strong S/R zone.
In December XLM broke from that S/R zone downward after creating a descending triangle. Now it is completing an ascending triangle that most often breaks upward. I am holding XLM and buying more if that breakout takes place with a good volume. Tell me what you have concluded based on your research.
Trade safe and take care.
Cheers
Whoop

Resistance Area For XLMBTC /w Ascending Triangle ?It more looks like we're currently getting an ascending triangle with a resistnace area on top with higher lows.
MACD cooling of and arround 0.
Ascending triangles are a bullish pattern, so in my guess and with what's currently going on we'll get a break to the upside.
No Financial advise do your own research.


XLMBTC is ready for long-term bull runRe-testing wedge:
XLM with US Dollar pair, after breaking out from the wedge on the weekly chart, the priceline has re-tested the resistance of wedge and support and the long-term breakout has been confirmed.
BULL FLAGE and testing EMA supports:
On the daily chart, the priceline has formed a bull flag and being consolidated. In the meanwhile, the XLM is also testing the EMA 10 and 21 as supports.
SMAs on weekly chart bitcoin market:
With Bitcoin pair, on weekly chart, the priceline of Stellar is breaking out the 50 simple moving average then there will be 100 and 200 SMA resistance levels.
Ichimoku cloud:
On the same weekly chart, with Bitcoin pair, the price action of Stellar is moving under an Ichimoku bearish cloud for a long time. Now the cloud has turned weak and it can breakout the cloud at any time for a powerful bullish rally.
Long-term big harmonic moves:
On long term-two week chart the price action of stellar has formed a bullish Butterfly:
And on 2-month chart, it has formed a big BAT pattern and entered in potential reversal zones of both patterns.
Conclusion:
XLM needs a breakout of weekly 200 SMA and the bearish cloud as soon as possible to start the long-term bull run. The harmonic moves are indicating that the breakout is very much confirmed.
For exact buy and sell targets for this trade, and other harmonic trading signals you can join:
www.patreon.com

Stellar, a coin to watch in this ALT SEASON !!! #XLMBTCWelcome to my update:
As all of us may have noticed till now, we are in the alt season.
But what coins are valuable and +100X during this bull run?!
- Any coin that has created higher lows since 2019 is considered a promising one.
- Coins with a high market cap ( just check the top 20 and pick those that have a green chart)
- Coins with strong fundamental news around them.
- XLMBTC :)
.$STELLAR has created bullish divergence o RSI indicator, on weekly and daily time frames !!!!
.The volume has increased magnificently since Nov 2020.
.It is in the top 10 of the high market caps, with $6,357,600,985.
.It is currently trading above its crucial support area and
.Great news about them
.Grayscale has doubled their holding of this coin lately
So both fundamentally and technically, $XLM is in a great spot to be bought.
My first target is 2143 satoshis
My third target would be the 0.61 fibo level (3128 satoshis)
And the last target is 7275 satoshis
Feel free to share your own insight of this pair, and please hit the like button and support my idea if you want this coin to moons in this bull run.


Stellar - target $0.8 for next movewant to see above .33 previous high and breakout and btc and USD
looking good so far
not financial advice


BINANCE: XLM/BTC🛒 Pair: XLM/BTC 🛒
== SPOT==
⏰ 1399/10/27 ⏰
🕰 16/01/2021 🕰
Duration:
📈 SHORT - MID 📈
Ex: Binance
#20
🛒 Buy : 790 - 800 🛒
👉Sell Targets👈
🎯TP1: 845 🥉
🎯TP2: hidden🥈
🎯TP3: hidden🥇
🎯TP4: hidden🏆
🎯TP5: hidden🚁
🎯TP6: hidden✈️
🎯TP7: hidden🚀
🎯TP8: hidden🛰
⛔️ SL: 730 By closing **4hrs.** candle below

XLMBTC Symtrical TriangleSoon Breakout To Come IMO.
With on RSI a Bullish divergence, and forming a local double bottom pattern.
Having a consolidation after our pump to the upside, giving us more and more ways to believe that we'll stay in the current uptrend we're setting.
If we would have a same amount of percentage gain. We would reach arround 1800 Sats with a minimum of 1600 Sats as our target.
Not Financial Advise Do Your Own Research, GL HF Trading And Making Gains.

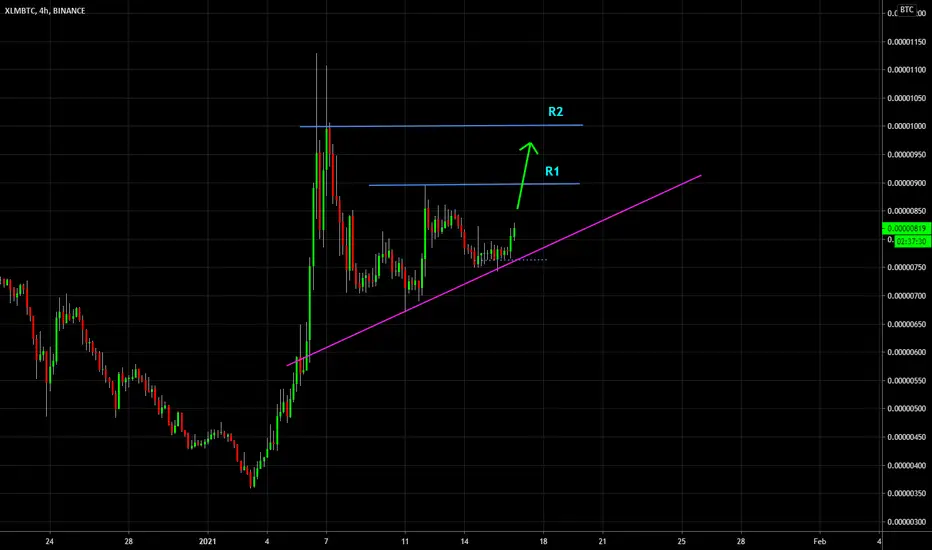
XLM/BTC Is Gaining Strength: Bullish OutlookXLM/BTC has gained a lot of ground recently. After a few days of quiet, I see that price action and volume are picking up again.
On the chart I've marked two areas of potential resistance, R1 and R2, based at recent highs. Happy trading!

XLMBTC is testing Monthly resistance 🦐$XLM.X if the price will have a breakout from monthly and retest as new support the daily resistance, According to Plancton's strategy (check our Academy), we can set a nice order
–––––
Follow the Shrimp 🦐
Keep in mind.
🟣 Purple structure -> Monthly structure.
🔴 Red structure -> Weekly structure.
🔵 Blue structure -> Daily structure.
🟡 Yellow structure -> 4h structure.
⚫️ Black structure -> <4h structure.
Here is the Plancton0618 technical analysis, please comment below if you have any question.
The ENTRY in the market will be taken only if the condition of the Plancton0618 strategy will trigger.
