XMR Technical Analysis: A potential breakout awaits!Hello everyone, I’m Cryptorphic.
For the past seven years, I’ve been sharing insightful charts and analysis.
Follow me for:
~ Unbiased analyses on trending altcoins.
~ Identifying altcoins with 10x-50x potential.
~ Futures trade setups.
~ Daily updates on Bitcoin and Ethereum.
~ High time frame (HTF) market bottom and top calls.
~ Short-term market movements.
~ Charts supported by critical fundamentals.
Now, let’s dive into this chart analysis:
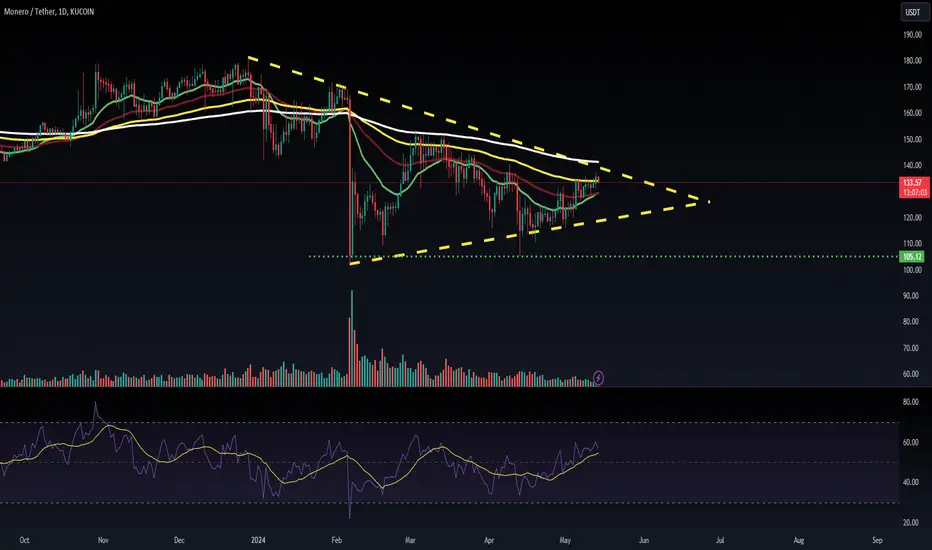
#XMRUSDT is showing signs of a potential bullish reversal. The price is supported by the 50 EMA and is approaching a significant resistance level.
A successful break and close above this resistance could lead to further upside, with potential targets around $283. Conversely, a failure to break the resistance might see the price retesting the support levels.
Key Observations:
- Long-Term Resistance: The price must break the long-term resistance level, marked around $178.92, to signal a strong bullish trend.
- 50 EMA Support: The 50 EMA (Exponential Moving Average) currently acts as a dynamic support level of around $149.62.
- Lower Support: The support level is established around $117.75.
- Price Action: The price is currently trading above the 50 EMA, indicating a short-term bullish trend.
The chart shows a potential bullish breakout if the price manages to sustain above the resistance level.
- Stochastic Oscillator: The Stochastic Oscillator is in the oversold territory, suggesting a potential upward momentum.
DYOR, NFA.
Please hit the like button to support my content and share your thoughts in the comment section. Feel free to request any chart analysis you’d like to see!
Thank you!
#PEACE
XMRUSDT trade ideas

Monero - Golden Pocket + Range Point of Control Support AreaThe current massive range lends us a sweet confluence area below where the 618 and 786 wrap the range Point of Control nicely.
Lets see if we can retrace down to get a healthy bounce from here.
Not ever financial advice.

Monero (XMR): Testing Neckline Zone / Might Fall Hard!Monero Coin has not been on our radar for some time but today is the day. The coin is at the crucial zone of the neckline after breaking both 100 and 200 EMAs in a 4-hour timeframe.
As we are testing that support (the neckline zone), we are looking for a full-scale breakdown to happen, which would open a huge zone for us to fall into!
Swallow Team


XMR - Monero is gonna explode soon#XMR/USDT #Analysis
Description
---------------------------------------------------------------
+ The price has hit the resistance level and appears to be rejected from it (confirmation will come once the candle closes).
+ We can consider entering a long trade once the price retraces.
+ There is good potential in the bull run if the price bounces back after reaching the support zone.
---------------------------------------------------------------
VectorAlgo Trade Details
------------------------------
Entry Price: 170.1 - 152.88
Stop Loss: 95.96
------------------------------
Target 1: 183.27
Target 2: 240.56
Target 3: 295.61
Target 4: 370.83
Target 5: 469.02
------------------------------
Timeframe: 1M
Capital Risk: 1-2% of trading amount
Leverage: 5-10x
---------------------------------------------------------------
Enhance, Trade, Grow
---------------------------------------------------------------
Feel free to share your thoughts and insights.
Don't forget to like and follow us for more trading ideas and discussions.
Best Regards,
VectorAlgo

#LQR #TOBTC #XMR monero got a huge chance to reject from the resistance painted on chart
you may add this level to you'r watchlst and loook for a sell trigger

XMR IS VERY BEARISHHi, dear traders. how are you ? Today we have a viewpoint to SELL/SHORT the XMR symbol.
For risk management, please don't forget stop loss and capital management
When we reach the first target, save some profit and then change the stop to entry
Comment if you have any questions
Thank You

XMRUSDT.1DUpon examining the daily chart for XMR/USDT, the technical analysis unveils notable insights regarding Monero's price behavior and future prospects.
Price Action: Currently, Monero is priced at $179.99, following a significant drop of 2.96%. This decline places it near a crucial support line around $98.39. Over the past year, the price has shown a tendency to oscillate between this support and resistance levels, forming a descending triangle pattern—a bearish signal generally indicative of potential continuation downward unless there is a significant shift in market sentiment or external factors.
Resistance and Support Levels: The most prominent resistance level is at $187.63, where the price has previously faced substantial selling pressure. Overcoming this level could shift the medium-term outlook from bearish to bullish. The support level at $98.39 is equally significant as a breach below this could lead to a test of the lower boundary at $96.37, marking the year's low.
Moving Average Convergence Divergence (MACD): The MACD indicator displays a bullish crossover as the MACD line (blue) has recently crossed above the signal line (orange)
, suggesting increasing bullish momentum in the short term. However, both lines are still below the histogram's zero line, which implies that the prevailing longer-term trend remains bearish.
Volume and Volatility: While the chart does not detail volume and volatility, these factors would typically add critical context, particularly in confirming the strength of price movements through volume-supported breakouts or breakdowns.
Conclusion:
The current technical setup of XMR/USDT presents a cautious scenario. The recent bearish momentum and position within a descending triangle pattern generally suggest a downward continuation. However, the bullish crossover in the MACD indicates a potential for short-term recovery. Traders should monitor whether the price can sustain above the $98.39 support. A break below this level could be detrimental, signaling a likely continuation to lower lows. Conversely, a successful breach above the resistance at $187.63 could invalidate the bearish pattern, possibly leading to further upside. Therefore, maintaining stop-loss orders slightly below the support and considering profit-taking near resistance levels would be a strategic approach under current conditions.

$XMR is back on track againSince the drawdown by major exchanges, OMXSTO:XMR has seen big losses
But now on the last weeks, it has regained previous price area!
One more evidence of an algorithmic price behavior in crypto markets
If you want to know more about how you can leverage your game with algorithmic price behaviors, just check my signature link

XMR short setup ALL trading ideas have entry point + stop loss + take profit + Risk level.
hello Traders, here is the full analysis for this pair, let me know in the comment section below if you have any questions, the entry will be taken only if all rules of the strategies will be satisfied. I suggest you keep this pair on your watchlist and see if the rules of your strategy are satisfied. Please also refer to the Important Risk Notice linked below.
Disclaimer

XMRUSDT.PHello Trader BINANCE:XMRUSDT.P
There is a pattern, Eve has shown valid evidence of a breakout at the yellow nickline and has penetrated the resistance area, but please mark the red trend line to take profit. The first area could be a decline area first, you can scalp this area.
Please add a comment and Positive feedback and constructive criticism are important to authors and the community.
Disclamer: Not Financial Advice

XMRUSDT: Bullish Butterfly Update: Bullish Breakout Seems LikelyXMR, despite the spot pairing having been delisted on Binance a few months ago, has survived and held above the PCZ that was of very much importance to the historic price action. During the delisting XMR had sold off back down to the PCZ in record volumes on the exchange, however, in spite of record selling the support still held, since then, the price has stagnated at this level potentially hinting towards accumulation. If the Support had Broken XMR likely would have crashed all the way back down to 20 but for the time being the coin has proven resilient at this price level and it would seem that we will soon be marking up to significantly higher prices as the diagonal Bearish Trend seems to be coming to a close.

XMR PriceThe Monero (XMR) coin decisively retained gains from the primary support mark of $100 and gained momentum in the past sessions.
Monero (XMR) or Moonero?Greetings citizens of the world
Monero price today is $145 with a 24 hour trading volume of 100 million dollar. XMR price is up 0.7% in the last 24 hours and 7% since last week
Monero is the top privacy centric cryptocurrency based on the CryptoNote protocol, a secure, private and untraceable currency system and after what happened to Tornado cash more "people" use XMR.
100-110$ is the most important support level for monero so if you were long from that level take some profit because at 160 we can have a little correction but if we break 160$ then 165,170 and 179 are next targets. If you want to buy monero for long term hold, 100-120$ are good dip zone for loading some coins.
as you see XMR repeat its pattern in downtrend so there is no reason for FOMO or any crazy leverages

XMRUSDT LONG Hi ,
XMRUSDT looking good above the resistance line,
Do not buy below that resistance line,
Once it break it cam follow the arrow line
Not a buy/sell signal ,just my views,
Trade carefully.

XMRUSDT BULLISH SETUP XMR has formed an expanding channel, with a distinct breakout and subsequent pullback occurring at the upper boundary of the channel. Maintaining a steady position above the highlighted key level, we anticipate a reversal or bullish rally back towards the upside. According to our price analysis, we foresee a target in the vicinity of the $151 region or higher.

Downward Risk For MoneroThe price of XMR has recently broken out of a long-term downtrend and exited this pattern. Currently, the price is fluctuating within a specific range and is in a trading range phase. If the price breaks out of this range, it is expected to change by the width of the rectangle. Additionally, if strong bearish patterns form, the price may decrease to the area of the green line.

MONERO HALVING OPPORTUNITYDue to the halving of Bitcoin expecting strong bounce of the price to the higher areas of interrest.
Stoploss marked with red color. Good luck.
Target 1 : 188
Target 2 : 294,75
Target 3 : 430 -440

XMR inteligentassetBullish scenario
Resistances 135 in 50 ema & horizontal, 146 in 200 ema, 153 ascending trend, 171, 182
Bearish scenario
Supports 116.2, 109 pivot low, 102

XLMUSDTHi!
I believe monero (privacy coin) has huge upside potential. Binance delisted XML some time ago but as traders we are always looking to buy fear.
Price is currently trading inside this perfect range to trade. I am personaly long for a swingtrade. TP at 146 and 176 USD.


XMR/USDT preparing for resistance Breakout? 👀 🚀Monero💎 Paradisers, turn your attention to #XMRUSDT as it's currently charting a significant course in the market. Positioned in a demand zone, it is gearing up for another attempt to breach a formidable resistance level, hinting at a strong potential for a bullish movement.
💎 Delving into #MONERO market history, we observe its adherence to a descending channel pattern, culminating in a break and subsequent upward movement. Recently, after a rejection from the solid resistance level at $152.20 it is regaining momentum to challenge this threshold again. A successful breakout here could pave the way for a likely upward trend. Should this bullish momentum persist, OMXSTO:XMR is set to target the resistance levels of $188.25.
💎 However, experienced #XMR traders understand that the path in crypto markets isn't always linear. If the anticipated breakout becomes a close call and deviates from expectations, be ready to pivot towards a bullish resurgence from the demand level of $125.56. This should be part of your strategic contingency planning.
💎 Additionally, if #XMR dips below this support level, a strategic shift may be necessary. Such a development would indicate the need for a reassessment of the bullish perspective, requiring an adjustment in strategy to align with the evolving market dynamics. 🌴💰

