YFI/USDT Ready to Capture Above Liquidity? 👀 Positive Outlook💎Paradisers, let's examine the latest market movements for #YFIUSDT, which have taken a fascinating turn.
💎Currently, #YearnFinance is approaching the resistance within a descending triangle. A breakout above this level will indicate a bullish trend reversal, leading to the capture of the significa

YFI: Igniting the Cryptoverse - Prepare for a Galactic Journey YFI's potential is sky-high! Recall when it surged from 0.10 BTC to 4 BTC in no time? That's just a taste of what's to come. Now's the prime moment to seize every opportunity for the next five years. The future holds endless possibilities, and YFI stands tall as a leading yield aggregator. Buckle up

YFI after the rejection from the support zoneYFI after the rejection from the support zone will continue to go up
🔵Entry Zone 8196 - 8394
🔴SL 7505
🟢TP1 9084
🟢TP2 9914
Risk Warning
Trading Forex, CFDs, Crypto, Futures, and Stocks involve a risk of loss. Please consider carefully if such trading is appropriate for you. Past performance is not

Let's explore the mathematical possibilities -YFI- $120.000.000Imagine this: YFI blasting off to an unparalleled all-time high, launching from a mere 95K and skyrocketing by an astounding 1267%, reminiscent of its previous surge, ultimately reaching an astonishing total value of $120,000,000.
At present, it may seem entirely ludicrous, but who's to say it won'

Chill out with a deal on bear meat!It appears that the bear meat discount season has kicked off, and the market seems to be thriving. Despite a few minor resistances, YFI appears quite bullish. I've set the minimum target at $49,000 and the maximum for 2024 at $95,000. If Bitcoin reaches a new all-time high, we might anticipate some

YFI when mOOn ?Send it .
No words , a miracle , if u missed 10k btc , here is ur chance ,It will bolster up.
Just wait.
10x leverage long will give u a 83x roi at previous ATHs , whilst the fib extension at -127 it will provide us a 136x ROI.
Not a financial advice.

$Yfi pretty straight forward
invalid back below yellow
activate beast mode like it does once in a while
flip blue to get its groove on

Alikze → YFI |Descending channel failureIn times H4 and H8, after the breakdown of the descending channel in the form of a pullback to the range of $7500 and confirmation of the continuation of the trend, it is possible to reach the specified supply area according to the important resistance range, as well as the neck line of the range of

YFI/USDT Long Trading Opportunity!The weekly chart has breached a significant resistance level, propelling prices upwards. This surge signals a promising long trading prospect, with a potential target range between USD 70K to 74K.
#YFI/USDT SPOT LONG ENTRY
Leverage: 3x
Entries: $10559
Take profit 1: $13985
Take profit 2: $25266
T

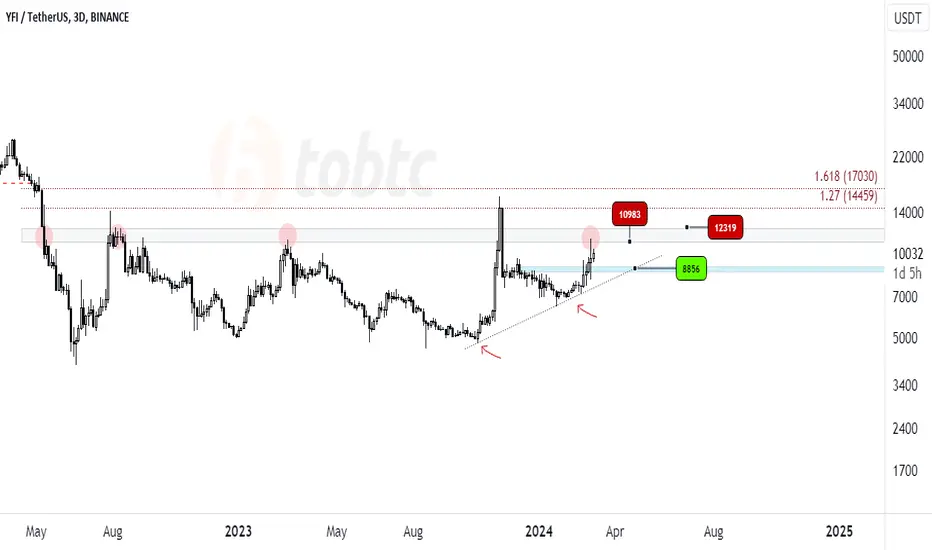
#LQR #TOBTC #YFI in 3Day Time Frame YFI got a Up Trend which is to important for next touch , for now these red Price Lable are resistance , which is important to break first
for new comer theres no place here , high risk level is green price lable
good luch
See all ideas
Frequently Asked Questions
Yearn.Finance / USD Tether (YFI) reached the lowest price of 1905 USDT on Jul 26, 2020.
See the list of crypto losers to find unexpected opportunities.
See the list of crypto losers to find unexpected opportunities.
Yearn.Finance / USD Tether (YFI) reached its highest price on May 12, 2021 — it amounted to 94760 USDT.
See the list of crypto gainers and choose what best fits your strategy.
See the list of crypto gainers and choose what best fits your strategy.
You can discuss Yearn.Finance / USD Tether (YFI) with other users in our public chats, Minds or in the comments to Ideas.
Yearn.Finance / USD Tether highest price ever is 94760 USDT, and the maximum drawdown from this value it has ever experienced is 4.87 K%, when Yearn.Finance / USD Tether reached 1905 USDT.
The safest choice when buying YFI is to go to a well-known crypto exchange. Some of the popular names are Binance, Coinbase, Kraken. But you'll have to find a reliable broker and create an account first. You can trade YFI right from TradingView charts — just choose a broker and connect to your account.